INTERNATIONAL MONETARY FUND. Navigating Global Divergences (October 2023) - page 3
WORLD ECONOMIC OUTLOOK: Navigating Global Divergences
Box 2.2. Fiscal Imprudence and Inflation Expectations: The Role of Monetary Policy Frameworks
Fiscal imprudence—high levels of public debt to GDP—
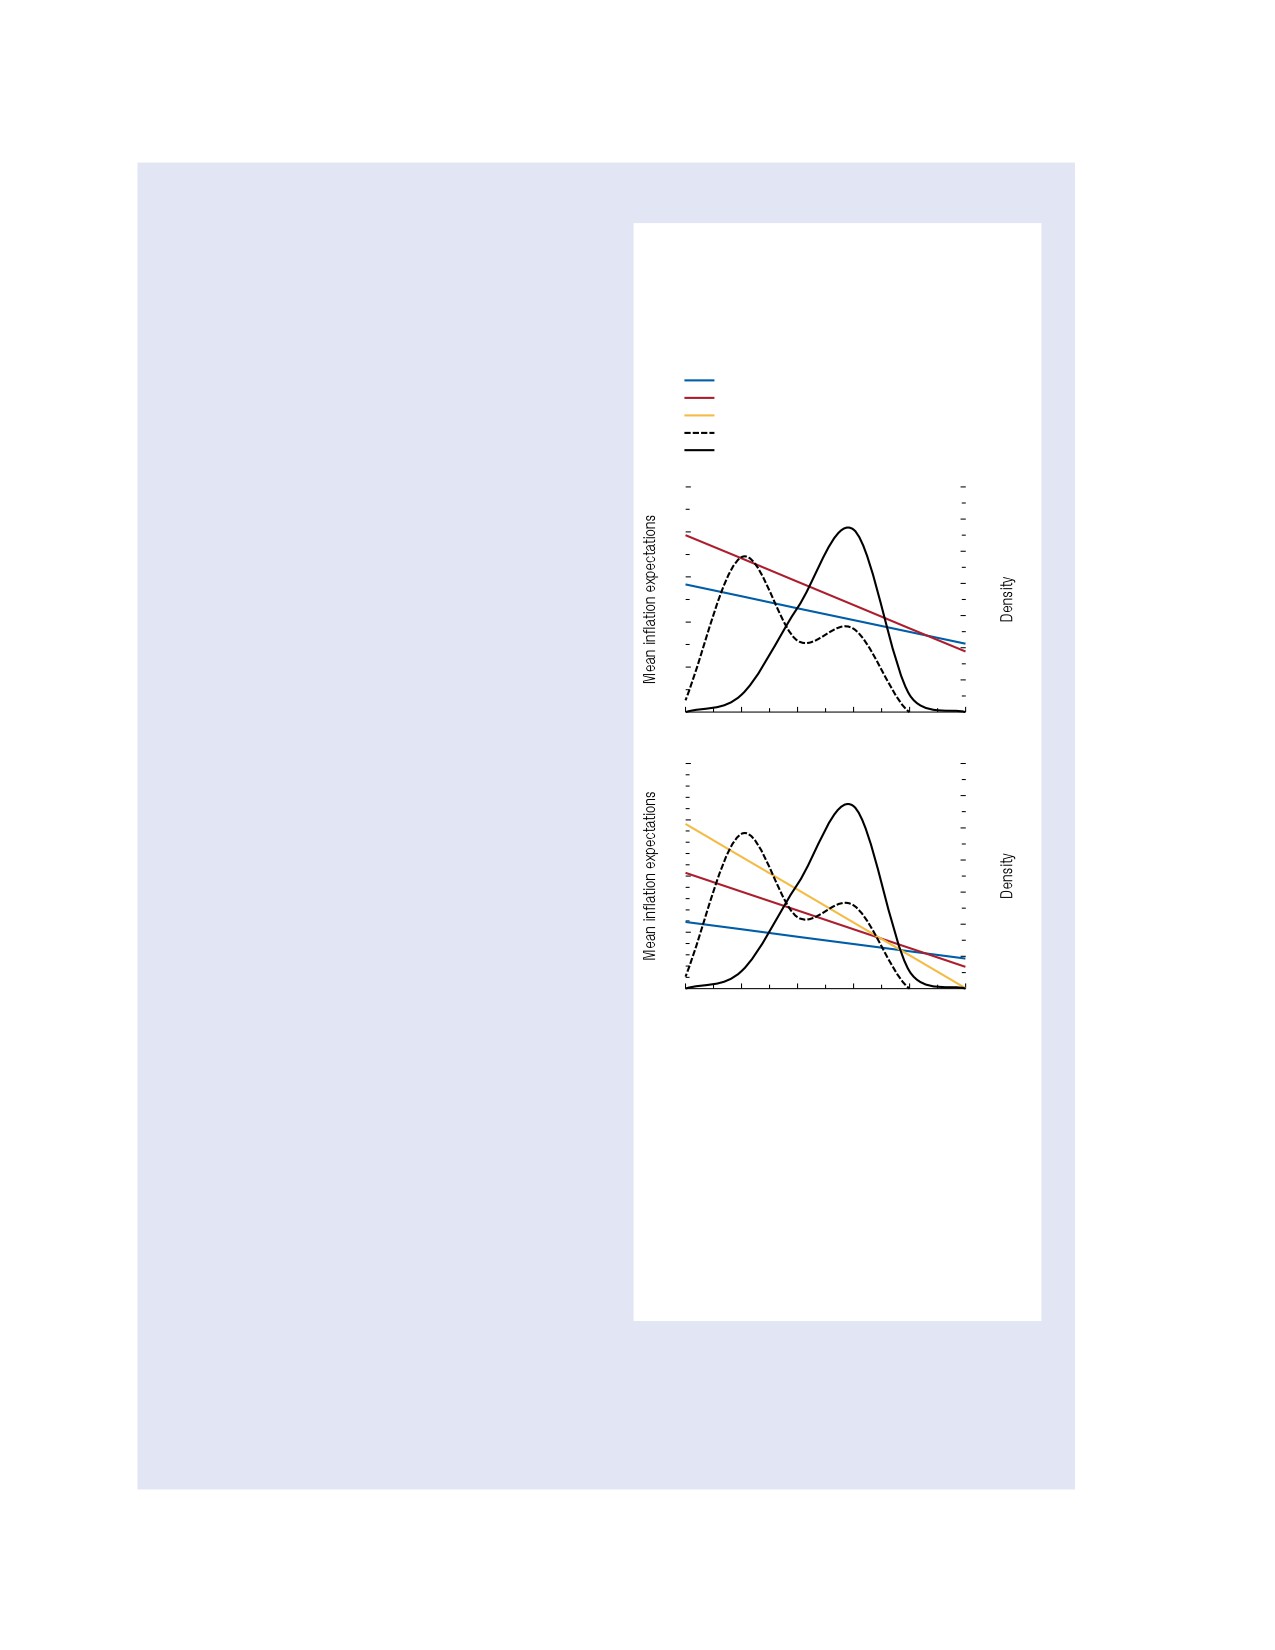
Figure 2.2.1. Inflation Expectations in
is generally regarded as having the potential to generate
Emerging Market and Developing Economies:
uncertainty and influence inflation expectations by
Monetary Policy Frameworks and Public
eroding perceptions of monetary policy credibility and
Debt Interactions
independence.1 That much has been clear since the work
(Percent)
of Sargent and Wallace (1981) and Leeper (1991).
This box empirically examines how the level of inflation
Lower debt to GDP
Higher debt to GDP
expectations is related to an economy’s monetary policy
Higher debt to GDP plus persistent deficit
framework, given the level of public debt.
Distribution in 2007 (right scale)
Distribution in 2021 (right scale)
In the study presented in this box, the soundness
10
1. Government Debt
0.7
of monetary policy frameworks is captured by a
0.6
new index, the IAPOC index, developed by Unsal,
8
0.5
Papageorgiou, and Garbers (2022).2 It shows that even
after economy-specific controls and time-invariant
6
0.4
characteristics are accounted for, higher public debt
0.3
4
is associated with expectations of higher inflation,
0.2
given a specific level of monetary policy framework
2
(Figure 2.2.1, panel 1).3 Tis heightened impact is
0.1
even more evident when the focus is on the stock of
0
0.0
public debt in foreign currency and exacerbated when
0.0
0.2
0.4
0.6
0.8
1.0
fiscal deficits are persistent (Figure 2.2.1, panel 2).
20
2. Government Debt in Foreign
0.7
However, as monetary policy frameworks are improved
Currency
0.6
(as seen with the shift in the IAPOC index distribu-
15
tion in emerging market and developing economies
0.5
over the past 15 years), inflation expectations become
0.4
10
less sensitive to the level and composition of public
0.3
debt or persistent fiscal deficits.
0.2
Overall, the study findings indicate that difficulties
5
posed by higher public debt levels for managing infla-
0.1
tion expectations in emerging market and developing
0
0
economies could be eased by adopting strong monetary
0.0
0.2
0.4
0.6
0.8
1.0
policy frameworks. Whereas monetary policymaking
Sources: Consensus Economics; Unsal, Papageorgiou, and
Garbers (2022); and IMF staff calculations.
Te authors of this box are Omer Akbal, Mariarosaria Comu-
Note: Horizontal axes show the IAPOC index level. The lines
nale, Marina Conesa, Chris Papageorgiou, and Filiz Unsal.
show the marginal effects of monetary policy framework
1See Brandao-Marques and others (2023) for a recent empir-
changes (according to the IAPOC [Overall Monetary Policy
Framework] index) on mean inflation expectations,
ical study of the issue and Bianchi and Melosi (2022), Bianchi,
conditional on the ratio of total (foreign-currency)
Faccini, and Melosi (2022), and Cochrane (2022) for theoreti-
government debt to GDP. “Higher (lower)” debt is the
cal arguments.
average debt to GDP, conditional on its being above (below)
2Te IAPOC index and its subindicators quantify the
the sample mean. Estimates are from a fixed-effects panel
soundness of monetary policy frameworks across countries
regression across economies of mean inflation expectations
through three pillars: Independence and Accountability
on the interaction of the IAPOC index score and debt to GDP.
(I and A), Policy and Operational Strategy (P and O), and
Distributions represent the density of the IAPOC index for the
Communications (C). Tis comprehensive index enables
assessed economies in 2007 (dashed) and 2021 (solid), with
a multidimensional characterization of monetary policy
a rightward shift indicating improvement.
frameworks—going beyond monetary policy or exchange rate
regime classifications—across 13 advanced economies and
in many of these economies is better equipped than
37 emerging market and developing economies. See Unsal,
15 years ago to serve as an anchor of stability, the adop-
Papageorgiou, and Garbers (2022) for further details. Te
tion of a prudent fiscal policy approach remains key to
data set has been updated to 2021.
effective preparation for challenges and to prevent the
3Advanced economies do not show this differential sensitivity
to debt levels over different IAPOC index scores.
risk of fiscal dominance in the future.
66
International Monetary Fund | October 2023
CHAPTER 2 Managing Expectations: Inflation and Monetary Policy
Box 2.3. Energy Subsidies, Inflation, and Expectations: Unpacking Euro Area Measures
Several European economies have used energy subsidies,
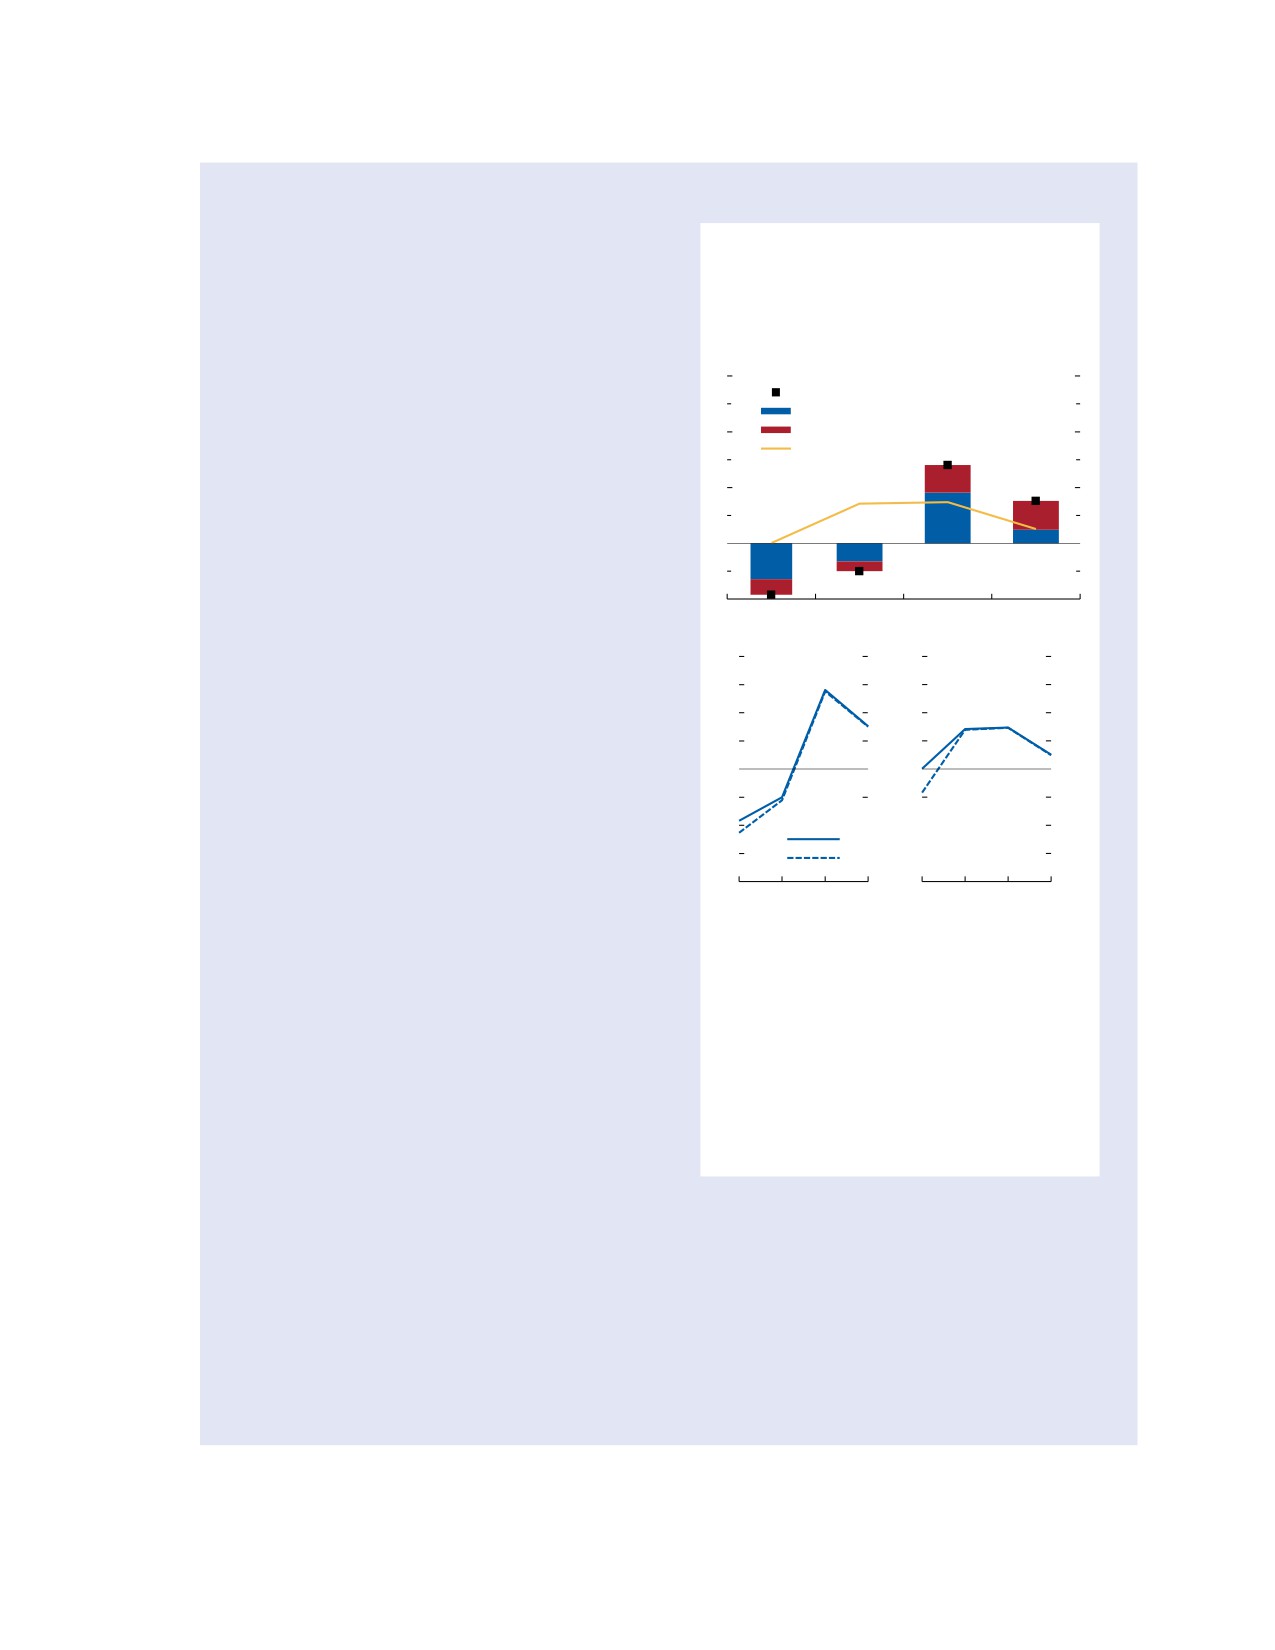
Figure 2.3.1. Marginal Impacts of Fiscal
tax cuts, and price caps to help smooth the impact of
Measures for Relief from the Energy Price
recent shocks to energy prices on incomes and inflation.
Shock on Inflation and Expectations
The effectiveness and desirability of such measures depends
(Percentage point deviation from no-measures
on many factors beyond the scope of this box, including
scenario)
their impact on energy markets, resource misallocation,
3
1. Channels
and fiscal sustainability, as well as details of the policy
Headline
design. One important channel is inflation expectations.
Direct
Temporary energy subsidies directly lower inflation today
2
Indirect effects
One-year-ahead core inflation
but increase it relative to the no-measures scenario after
they expire, smoothing the overall inflation path. If energy
1
subsidies are perceived as temporary, the expectations
channel may reduce their effectiveness in lowering infla-
0
tion, as expectations of higher future inflation may affect
price-setting today.
-1
2022
23
24
25
A model from the IMF’s Flexible System of Global
Models is used in this box to simulate the impacts on
2.0
2. Headline
3. Core Inflation
2.0
Expectations
expected and realized inflation of announced energy
1.5
1.5
relief measures (price subsidies and caps) in the euro
1.0
1.0
area.1 Te simulation assumes that the sharp upward
0.5
0.5
shock to energy prices in 2022 is temporary and
0.0
0.0
unwinds. It also includes the indirect effects of energy
-0.5
-0.5
prices on core inflation through the supply chain. Te
-1.0
By perceived relief persistence:
-1.0
model estimates that fiscal relief measures lowered
Baseline, as announced
-1.5
-1.5
euro area inflation by 0.9 percentage point in 2022
Alternative, longer by one year
and by half a percentage point in 2023 (Figure 2.3.1,
-2.0
-2.0
2022
23
24
25
2022
23
24
25
panel 1). Although additional fiscal borrowing to
finance subsidies boosts demand, its effect on core
Sources: Dao and others (2023); and IMF staff calculations.
inflation is more than offset by the reduction in
Note: Panel 1 shows the marginal impacts on inflation of
supply-chain costs. Tese fiscal measures smooth out
announced fiscal relief measures for energy, using the IMF’s
Flexible System of Global Models. The blue bars show the
the inflation impact of the energy shock over time,
direct effects of measures (subsidies, tax cuts, or price caps
leading to a rise in inflation over 2024-25 (relative to
on consumer energy prices), and the red bars show the
the no-measures scenario) and preventing an under-
indirect effects from changes in aggregate demand, supply
chain costs, and core inflation expectations. The baseline in
shoot as energy subsidies expire and the energy shock
panel 2 assumes fiscal relief measures last in 2022 as
unwinds. Te measures have a net neutral effect on
originally announced. The alternative assumes that
core inflation expectations in 2022 but increase them
households misperceive and expect measures will last
longer, but then in 2023 they realize their error and adjust to
by 0.7 percentage point over 2023-24. Tese find-
the announced path.
ings assume, however, that agents fully understand
the temporary nature of the subsidies. What if agents
misperceive and think that the subsidies will last
prices by more in 2022, because they now expect core
for a year more than announced? In this alternative
inflation to be lower in 2023. Te fall in inflation
scenario, expectations fall more in 2022 (Figure 2.3.1,
expectations increases the impact of fiscal policy on
panel 2). Subsidies also lead firms to lower their
inflation from -0.9 to -1.1 percentage points in 2022
and from -0.5 to -0.6 percentage point in 2023. But
once agents realize their error and correct, inflation
Te author of this box is Chris Jackson.
1See Dao and others (2023) for further details on the structure
and expectations bounce back, highlighting the role of
of the model and simulation calibration.
the expectations channel.
International Monetary Fund | October 2023
67
WORLD ECONOMIC OUTLOOK: Navigating Global Divergences
References
Clements, Michael P., Robert W. Rich, and Joseph S. Tracy.
Acosta, Miguel. 2023. “Te Perceived Causes of Monetary Policy
2023. “Surveys of Professionals.” In Handbook of Economic
Surprises.” Unpublished, Board of Governors of the Federal
Expectations, edited by Rüdiger Bachmann, Giorgio Topa, and
Reserve System, Washington, DC. https://www.acostamiguel
Wilbert van der Klaauw, Chapter 3. Elsevier: London.
.com/papers/acosta_mp.pdf.
Cochrane, John H. 2022. “A Fiscal Teory of Monetary Policy
Albrizio, Silvia, Allan Dizioli, and Pedro Vitale Simon. 2023.
with Partially-Repaid Long-Term Debt.” Review of Economic
“Mining the Gap: Extracting Firms’ Inflation Expectations
Dynamics 45: 1-21.
from Earning Calls.” IMF Working Paper 23/202, Interna-
Coibion, Oliver, Yuriy Gorodnichenko, Saten Kumar, and
tional Monetary Fund, Washington, DC.
Mathieu Pedemonte. 2020. “Inflation Expectations as a Policy
Alvarez, Jorge, and Allan Dizioli. 2023. “How Costly Will Rein-
Tool?” Journal of International Economics 124: 103297.
ing in Inflation Be? It Depends on How Rational We Are.”
Coibion, Olivier, Yuriy Gorodnichenko, and Michael Weber.
IMF Working Paper 23/021, International Monetary Fund,
2022. “Monetary Policy Communications and Teir Effects
Washington, DC.
on Household Inflation Expectations.” Journal of Political
Andre, Peter, Carlo Pizzinelli, Christopher Roth, and Johannes
Economy 130 (6): 1537-84.
Wohlfart. 2022. “Subjective Models of the Macroeconomy:
D’Acunto, Francesco, Daniel Hoang, Maritta Paloviita, and
Evidence from Experts and Representative Samples.” Review
Michael Weber. 2020. “Effective Policy Communication:
of Economic Studies 89 (6): 2958-91.
Targets versus Instruments.” Becker Friedman Institute for
Ball, Laurence. 1994. “What Determines the Sacrifice Ratio?”
Economics Working Paper 2020-148, Becker Friedman
In Monetary Policy, edited by N. Gregory Mankiw. Chicago:
Institute for Economics, Chicago.
University of Chicago Press.
Dao, Mai Chi, Allan Dizioli, Pierre-Olivier Gourinchas, Chris
Bems, Rudolfs, Francesca Caselli, Francesco Grigoli, and Ber-
Jackson, and Daniel Leigh. 2023. “Unconventional Fiscal
trand Gruss. 2021. “Expectations’ Anchoring and Inflation
Policy in Times of High Inflation.” Paper presented at the
Persistence.” Journal of International Economics 132: 103516.
European Central Bank Forum on Central Banking, Sintra,
Bianchi, Francesco, Renato Faccini, and Leonardo Melosi.
Portugal, June 25-28.
2022. “A Fiscal Teory of Trend Inflation.” NBER Work-
Dincer, Nergiz, Barry Eichengreen, and Petra Geraats. 2022.
ing Paper 30727, National Bureau of Economic Research,
“Trends in Monetary Policy Transparency: Further Updates.”
Cambridge, MA.
International Journal of Central Banking 18 (1): 331-48
Bianchi, Francesco, and Leonardo Melosi. 2022. “Inflation as
European Central Bank (ECB). 2021. “Economic, Financial,
a Fiscal Limit.” Federal Reserve Bank of Chicago Working
and Monetary Developments.” ECB Economic Bulletin 8,
Paper 2022/08, Federal Reserve Bank of Chicago, Chicago.
European Central Bank, Frankfurt.
Binder, Carola. 2017. “Fed Speak on Main Street: Central Bank
Forbes, Kristin J., Joseph Gagnon, and Christopher G. Collins.
Communication and Household Expectations.” Journal of
2021. “Low Inflation Bends the Phillips Curve around the
Macroeconomics 52: 238-51.
World: Extended Results.” Peterson Institute for International
Blanchard, Olivier J., and Ben S. Bernanke. 2023. “What Caused
Economics Working Paper 21-15, Peterson Institute for Inter-
the US Pandemic-Era Inflation?” NBER Working Paper 31417,
national Economics Washington, DC.
National Bureau of Economic Research, Cambridge, MA.
Frankel, Jeffrey. 2010. “Monetary Policy in Emerging Markets.”
Brandao-Marques, Luis, Marco Casiraghi, Gaston Gelos,
In Handbook of Monetary Economics, vol. 3, edited by
Olamide Harrison, and Günes Kamber. 2023. “Is High Debt
Benjamin M. Friedman and Michael Woodford.
Constraining Monetary Policy? Evidence from Inflation
Hajdini, Ina. 2023. “Trend Inflation and Implications for the
Expectations.” IMF Working Paper 2023/143, International
Phillips Curve.” Federal Reserve Bank of Cleveland Economic
Monetary Fund, Washington, DC.
Commentary 2023-07, Federal Reserve Bank of Cleveland,
Candia, Bernardo, Oliver Coibion, and Yuriy Gorodnichenko.
Cleveland, OH.
2023. “Te Macroeconomic Expectations of Firms.” In
Haldane, Andrew, Alistair Macaulay, and Michael McMahon.
Handbook of Economic Expectations, edited by Rudiger
2020. “Te 3 E’s of Central Bank Communication with the
Bachmann, Giorgio Topa, and Wilbert van der Klaaw.
Public.” CEPR Discussion Paper 14265, Centre for Economic
Carotta, Gianni, Miguel Mello, and Jorge Ponce. 2023. “Mone-
Policy Research, London.
tary Policy Communication and Inflation Expectations: New
Kamber, Güneş, Madhusudan S. Mohanty, and James Morley.
Evidence about Tone and Readability.” Latin American Journal
2020. “What Drives Inflation in Advanced and Emerging
of Central Banking 4 (3): 100088.
Market Economies?” BIS Papers 111, Bank for International
Céspedes, Luis Felipe, Ilan Goldfajn, Phil Lowe, and Rodrigo
Settlements, Basel, Switzerland.
Valdés. 2005. “Policy Responses to External Shocks:
Kganyago, Lesetja. 2023. “A Road Well Traveled.” Finance &
Te Experiences of Australia, Brazil, and Chile.” Cen-
Development 60 (1): 44-45.
tral Bank of Chile Working Paper 321, Central Bank of
Kose, Ayhan, Hideaki Matsuoka, Ugo Panizza, and Dana
Chile, Santiago.
Vorisek. 2019. “Inflation Expectations: Review and Evidence.”
68
International Monetary Fund | October 2023
CHAPTER 2 Managing Expectations: Inflation and Monetary Policy
In Inflation in Emerging and Developing Economies: Evolution,
Sargent, Tomas J., and Neil Wallace. 1981. “Some Unpleasant
Drivers, and Policies, edited by Jongrim Ha, Ayhan Kose, and
Monetarist Arithmetic.” Federal Reserve Bank of Minneapolis
Franziska Ohnsorge. World Bank: Washington, DC.
Quarterly Review 5 (3): 1-17.
Kumar, Saten, Hassan Afrouzi, Olivier Coibion, and Yuriy
Tetlow, Robert J. 2022. “How Large Is the Output Cost of
Gorodnichenko. 2015. “Inflation Targeting Does Not Anchor
Disinflation?” Finance and Economics Discussion Series
Inflation Expectations: Evidence from Firms in New Zealand.”
2022-079, Board of Governors of the Federal Reserve Sys-
Brookings Papers on Economic Activity 46: 151-225.
tem, Washington, DC.
Lamla, Michael J., and Dmitri V. Vinogradov 2019. “Central
Unsal, Filiz D., Chris Papageorgiou, and Hendre Garbers. 2022.
Bank Announcements: Big News for Little People?” Journal of
“Monetary Policy Framework: An Index and New Evidence.”
Monetary Economics 108: 21-38.
IMF Working Paper 22/022, International Monetary Fund,
Leeper, Eric M. 1991. “Equilibria under ‘Active’ and ‘Passive’
Washington, DC.
Monetary and Fiscal Policies.” Journal of Monetary Economics
van der Cruijsen, Carin, David-Jan Jansen, and Jakob de
27 (1): 129-47.
Haan. 2015. “How Much Does the Public Know about the
Lovell, Michael C. 1986. “Tests of the Rational Expectations
ECB’s Monetary Policy? Evidence from a Survey of Dutch
Hypothesis.” American Economic Review 76 (1): 110-24.
Households.” International Journal of Central Banking 42
Ottonello, Pablo, and Tomas Windberry. 2020. “Financial Het-
(December): 169-218.
erogeneity and the Investment Channel of Monetary Policy.”
Weber, Michael, Bernardo Candia, Tiziano Ropele, Rodrigo
Econometrica 88 (6): 2473-502.
Lluberas, Serafin Frache, Brent H. Meyer, Saten Kumar, Yuriy
Reis, Ricardo. 2020. “Te People versus the Markets: A
Gorodnichenko, Dimitris Georgarakos, Olivier Coibion,
Parsimonious Model of Inflation Expectations.” Centre for
Geoff Kenny, and Jorge Ponce. 2023. “Tell Me Something
Macroeconomics Working Paper 2033, Centre for Macroeco-
I Don’t Already Know: Learning in Low and High-Inflation
nomics, London.
Settings.” NBER Working Paper 31485, National Bureau of
Reis, Ricardo. 2021. “Losing the Inflation Anchor.” Brookings
Economic Research, Cambridge, MA.
Papers on Economic Activity (Fall): 307-61.
Weber, Michael, Francesco D’Acunto, Yuriy Gorodnichenko,
Reis, Ricardo. 2023. “Expected Inflation in the Euro Area:
and Olivier Coibion. 2022. “Te Subjective Inflation Expec-
Measurement and Policy Response.” CEPR Discussion Paper
tations of Households and Firms: Measurement, Determi-
17849, Centre for Economic Policy Research, London.
nants, and Implications.” Journal of Economic Perspectives
Sargent, Tomas. 1983. “Stopping Moderate Inflations: Te
36 (3): 157-84.
Methods of Poincare and Tatcher.” In Inflation, Debt,
Werning, Ivan. 2022. “Expectations and the Rate of Inflation.”
and Indexation, edited by Rudiger Dornbusch and Mario
NBER Working Paper 30260, National Bureau of Economic
Henrique Simonsen. Cambridge, MA: MIT Press.
Research, Cambridge, MA.
International Monetary Fund | October 2023
69
FRAGMENTATION AND COMMODITY MARKETS:
3
VULNERABILITIES AND RISKS
Russia’s invasion of Ukraine in 2022 caused major com-
and declines in transportation costs. Integrated
modity markets to fragment, and continued geopolitical
commodity markets have provided cheap inputs
tensions could make matters worse. This chapter examines
that have supported global growth and so have
the key channels through which further disruptions in
helped raise living standards, especially in emerg-
commodity trade could affect prices, economic activity,
ing markets.1
and the clean energy transition. It finds that commod-
However, the war in Ukraine put this process in
ity markets are particularly vulnerable in the event of
reverse. For the first time since the 1970s, commodities
fragmentation. Commodity production is often highly
such as crude oil, natural gas, and wheat were broadly
concentrated because of natural endowments, and many
used to exert pressure in a major conflict. Exports
commodities are difficult to substitute in the short term.
were restricted and countersanctions imposed. Tese
Further fragmentation of commodity markets—which had
disruptions in commodity trade contributed to surging
been on the rise even before the war in Ukraine—could
inflation in 2022 in many parts of the world, food
cause large price changes and more price volatility. Model
insecurity in low-income countries, and slower global
simulations suggest that trade disruptions could result in
growth (IMF 2023).
substantial economic impacts in commodity-dependent
While most commodity prices have since normal-
economies. However, due to offsetting effects across produc-
ized, geopolitical tensions signal that more severe
ing and consuming countries, global economic costs appear
fragmentation of commodity trade is a major risk.2
modest. Crucially, low-income countries with a high reli-
Many countries are trying to reshore commodity sup-
ance on agricultural imports would be disproportionately
ply chains for national security, geopolitical, or other
affected, raising food security concerns. The fragmentation
reasons. Measures include those for critical minerals
of mineral markets could also make the clean energy
for clean energy technologies, semiconductors, and
transition more costly and lead to lower-than-needed
defense (examples of actions are the US Inflation
investment in renewable energy and electric vehicles.
Reduction Act, the European Chips Act, and China’s
Taken together, the findings present yet another argument
export restrictions on gallium and germanium).
for multilateral cooperation on trade policies. At the
As a result, concerns about fragmentation, deglobal-
very least, agreements on a “green corridor” for critical
ization, and nearshoring have risen sharply, especially
minerals and a “food corridor” would safeguard the global
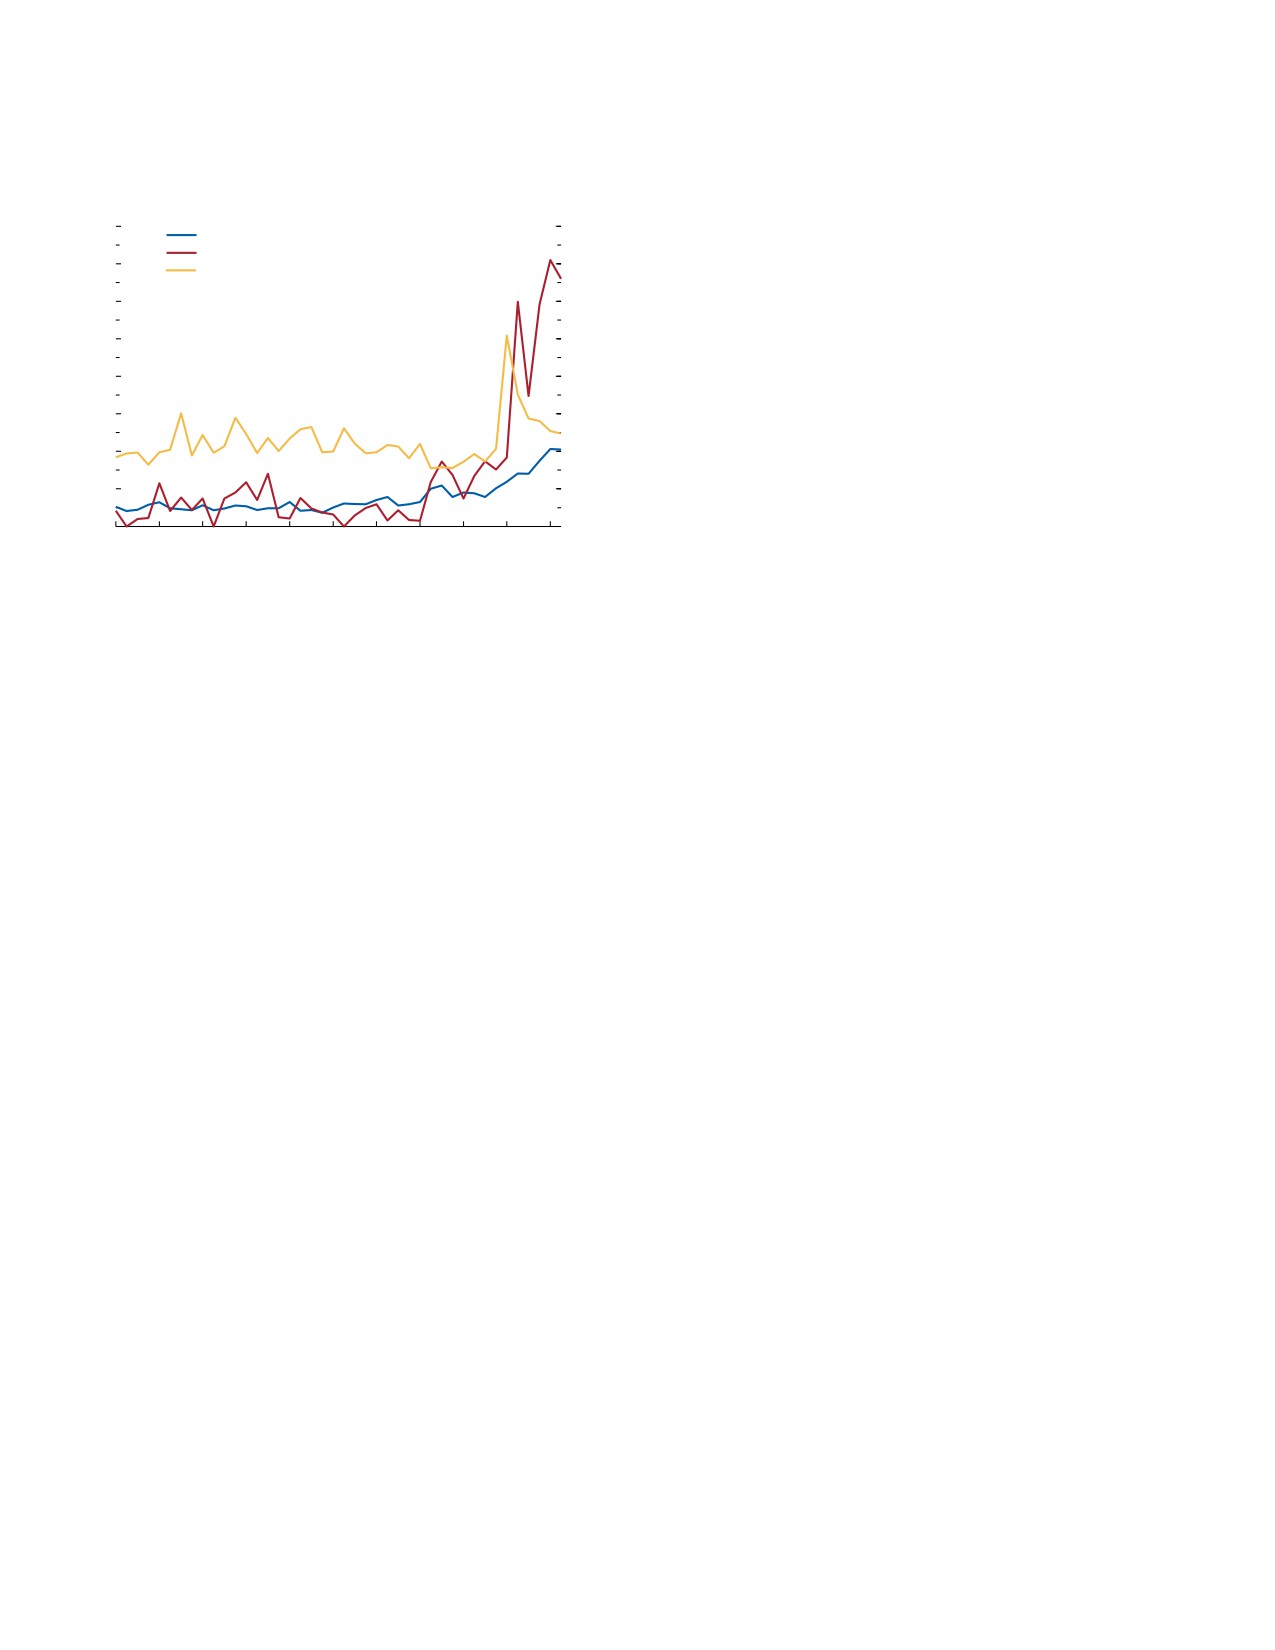
in the commodity sector (Figure 3.1). Text mining
goals of averting climate change and food insecurity.
analysis of earnings calls reveals that prior to the
COVID-19 pandemic, firms barely mentioned key-
words related to fragmentation, but usage surged after
Introduction
Russia’s invasion of Ukraine.
Since the end of the Cold War, primary commod-
ity markets have become more integrated as a result
of trade liberalization, technological innovation,
1Economic theory suggests that the consumption gains and the
more efficient use of resources generated by trade should boost GDP.
Te authors of this chapter are Jorge Alvarez (co-team lead), Mehdi
See Feyrer (2019, 2021) for recent analysis and Irwin (2019) for a
Benatiya Andaloussi, Christopher Evans, Chiara Maggi, Marika
review of the literature on trade and growth.
Santoro, Alexandre Sollaci, and Martin Stuermer (co-team lead), with
2Building on Aiyar and others (2023), the chapter defines geo-
contributions by Marijn Bolhuis, Jiaqian Chen, Benjamin Kett, Seung
economic fragmentation (referred to as “fragmentation” for brevity
Mo Choi, Peter Nagle, and Alessandra Sozzi, and under the guidance of
in the rest of the chapter) as any policy-driven reversal of integra-
Petia Topalova. Yarou Xu, Carlos Morales, and Canran Zheng provided
tion, including reversals guided by strategic considerations such as
outstanding research assistance. Andrei Levchenko was the external
national security. It encompasses trade, fiscal and financial measures
consultant. Te chapter also benefited from discussions with Tibault
such as tariffs, export restrictions, subsidies, and restrictions on
Fally, Julien Martin, James Sayre, David Shin, and John Sturm as well as
payments. Te trade literature of the early 2000s used “fragmenta-
from comments by internal seminar participants and reviewers. We are
tion” to describe the geographic dispersion of production processes
grateful to Naomi Idoine and her colleagues from the British Geological
in globally integrated supply chains (Arndt and Kierzkowski 2000;
Survey for guidance on data.
Deardorff 2001).
International Monetary Fund | October 2023
71
WORLD ECONOMIC OUTLOOK: Navigating Global Divergences
Figure 3.1. Fragmentation Keywords in Earnings Calls
of markets for energy, agricultural, and mineral
(Indices, 2013-15 = 100)
commodities could affect economies and global public
goods—namely, the energy transition. It focuses on the
1,600
400
Fragmentation keyword index, all sectors
following questions:
Fragmentation keyword index, commodity sector
1,400
350
Geopolitical risk index (right scale)
••
What makes commodity markets vulnerable in the
event of fragmentation?
1,200
300
••
Is there fragmentation in commodity markets, and if
1,000
250
so, what form does it take?
800
200
••
Which commodities are most vulnerable to disrup-
tions in international trade?
600
150
••
What would be the economic impact of commodity
400
100
market fragmentation across blocs and countries, as
200
50
well as on the global economy?
••
What might be the implications of such fragmenta-
0
0
2013
15
17
19
21
23:Q2
tion for the clean energy transition?
Sources: Caldara and Iacoviello (2022); Hassan and others (2019); NL Analytics,
Te chapter covers nearly all countries and focuses
Inc.; and IMF staff calculations.
Note: Fragmentation indices measure the average number of sentences, per
on 48 commodities, including agricultural goods,
thousand earnings calls, that mention at least one of the following keywords:
energy commodities—namely, coal, crude oil, and
deglobalization, reshoring, onshoring, nearshoring, friend-shoring, localization,
regionalization.
natural gas—and other mineral commodities. It
builds a unique database of commodity output, use,
and bilateral trade, and employs a combination of
Tere is little consensus on the economic costs of
descriptive statistics, empirical analysis, and model
fragmentation in the fast-growing literature. Esti-
simulations.
mates of long-term output losses from restricting
Te chapter simulates a highly stylized risk scenario,
the international flow of goods and services, finance,
in which commodity trade between two geopolitical
and technology range from 0.2 percent to 12 per-
blocs is persistently disrupted, to illustrate the chan-
cent of global GDP, depending on the scenario and
nels through which commodity market fragmentation
assumptions.3 Commodity markets could be another
could affect prices and output. Te main scenario
important channel through which further disruptions
defines the two theoretical blocs by using the 2022
in trade affect activity. Commodity production is hard
United Nations (UN) vote on the war in Ukraine as a
to relocate, as it is linked to natural endowments such
transparent starting point. However, the chapter exam-
as geological deposits or soil quality. Consumption of
ines alternative scenarios, including the role of neutral
commodities is often difficult to substitute in the short
countries and the impact of countries’ switching blocs,
term. Moreover, many commodities are crucial inputs
given the sensitivity of the analysis to bloc configura-
for manufacturing and technologies, including those
tions and the difficulty of assessing bloc configurations’
related to the clean energy transition.
plausibility.4
Against this backdrop, the chapter studies the
main channels through which further fragmentation
4Countries’ geopolitical alignment could be partly driven by trade
linkages and risk management strategies to reduce the fallout from
3See Aiyar and others (2023) for an overview of potential channels
spikes in geopolitical tensions. However, the endogenous formation
of impact. Recent studies that quantify aggregate losses from restricting
of blocs remains beyond the scope of the chapter. Te two-bloc
trade include Albrizio and others (2023); Attinasi, Boeckelmann, and
scenario presented here is meant to provide a clearly defined baseline
Meunier (2023); Bolhuis, Chen, and Kett (2023); Fally and Sayre
and to make the exercise comparable to those in the recent literature.
(2018); Felbermayr, Mahlkow, and Sandkamp (2022); Hakobyan,
Introducing neutral countries reduces the impact of fragmentation,
Meleshchuk, and Zymek (2023); and Javorcik and others (2022).
as discussed later in the chapter.
Chapter 4 of the April 2023 World Economic Outlook examines the
Online Annex 3.1 provides details on the commodities and coun-
consequences of restrictions on investment, and Chapter 3 of the April
tries and their allocation across blocs as well as data sources. Online
2023 Global Financial Stability Report does the same for portfolio flows,
Annex 3.5.2 discusses the robustness of some of the key findings to
whereas Cerdeiro and others (2021) and Góes and Bekkers (2022)
different bloc configurations. All online annexes are available at
quantify the losses once technological decoupling is also considered.
72
International Monetary Fund | October 2023
CHAPTER 3 Fragmentation and Commodity Markets: Vulnerabilities and Risks
Te main findings are as follows:
Due to vastly different and often offsetting
••
Commodities are vulnerable in the event of fragmen-
impacts across net commodity-producing and net
tation. The importance of natural endowments for
commodity-consuming countries, however, economic
production can lead to high geographic concen-
losses appear relatively modest at the global level.
tration of output. For example, the three biggest
This should not lead to complacency: the chapter
suppliers of minerals account for about 70 percent
quantifies only the restriction of commodity trade
of global production, on average. Coupled with low
between blocs. Should the world fragment into
demand elasticities and their upstream use in many
isolated blocs, the flows of other goods and services,
manufacturing processes and key technologies, this
finance, technology, and know-how would most
means that commodities are highly traded. However,
likely also be disrupted, amplifying global economic
many importers rely on just a few suppliers. These
costs (Aiyar and others 2023). The higher volatility
features raise the cost of trade disruptions.
and uncertainty brought on by commodity market
••
There is rising fragmentation in commodity markets.
fragmentation would complicate policymaking and
Measures restricting commodity trade surged in
add to costs, a channel that is also not captured.
2022, much more than those restricting trade
Moreover, within countries, offsetting effects on
in other goods. For selected commodities, price
commodity consumers and producers imply strong
differentials across geographic markets have
distributional impacts even absent large aggre-
widened. And commodity sector foreign direct
gate output effects. Fragmentation in agricultural
investment (FDI) and cross-border mergers and
commodity markets could raise food insecurity in
acquisitions were on the decline even prior to the
low-income countries, with high social and human-
war in Ukraine.
itarian costs that are not included in the chapter’s
••
Fragmentation could cause large price changes.
model simulations. In sum, commodity market
The scale of the price effects depends on the
fragmentation could deliver a sizable economic blow
supply-and-demand imbalances caused by frag-
in an already challenging environment of slow global
mentation and the price elasticities of supply and
growth, tight financial conditions, and high debt in
demand. Illustrative partial equilibrium model
many vulnerable countries.
simulations suggest that price effects could be
••
Fragmentation in mineral markets could make the
particularly strong for some minerals critical for the
clean energy transition more costly. Demand for
green transition and some highly traded agricultural
critical minerals is projected to rise severalfold in
goods. Spikes in agricultural commodity prices
a net-zero-carbon-emissions scenario. These min-
could be concerning for many low-income countries
erals are highly concentrated geographically, and
reliant on imports to feed their population.
their elasticities of demand and supply are low, so
••
Fragmented commodity markets would also lead
trade disruptions could add to upward pressure on
to higher price volatility. Smaller markets in a
mineral prices in the bloc where demand exceeds
fragmented world would provide fewer buffers
supply after fragmentation. But the mineral-rich
against commodity supply and demand shocks,
bloc cannot reap the benefits from oversupply, as
leading to larger price responses than under free
refining capacity cannot be scaled up quickly. In
trade. Moreover, commodity producers would
the illustrative simulation, fragmentation results in
have powerful incentives to switch allegiances
up to 30 percent lower-than-needed investment in
given potentially significant differences in com-
renewables and electric vehicles (EVs) at the global
modity prices among blocs. This would induce
level by 2030.
more supply shocks, volatility, and uncertainty in
commodity markets, challenging fiscal, monetary,
What Makes Commodities Vulnerable in the
and financial stability.
Event of Fragmentation?
••
For many commodity-dependent economies, fragmenta-
tion would lead to sizable macroeconomic impacts. For
Tis section documents several features of commod-
some low-income countries and emerging market
ity markets that would raise the economic costs of
economies, illustrative trade model simulations point
disrupting their trade, despite commodities’ homoge-
to long-term output losses exceeding 2 percent.
neity and fungibility.
International Monetary Fund | October 2023
73
WORLD ECONOMIC OUTLOOK: Navigating Global Divergences
Production Concentration
Setting up processing capacity comes with its own
challenges, such as regulations; access to know-how,
Te first production stage of commodities depends
technology, and skilled labor; infrastructure require-
on natural endowments, which can be heavily concen-
ments; and labor costs (IEA 2023). Tese help explain
trated geographically. For instance, the extraction of
the geographic concentration at the refining and pro-
minerals and energy commodities requires cost-effective
cessing stages.
geological deposits. Availability of fertile soil, water, and
On the demand side, many commodities are inputs
an adequate climate can constrain agricultural produc-
for key technologies and products or are essential to
tion and yields. As a result, the three largest-producing
household consumption (food, heating, cooking, and
countries account for about 65 percent of the global
transportation are examples). Disruptions to their
output of agriculture, about 50 percent of that of
supply can cause ripple effects across sectors and value
energy, and about 70 percent of that of mineral
chains. As upstream inputs for the production of a
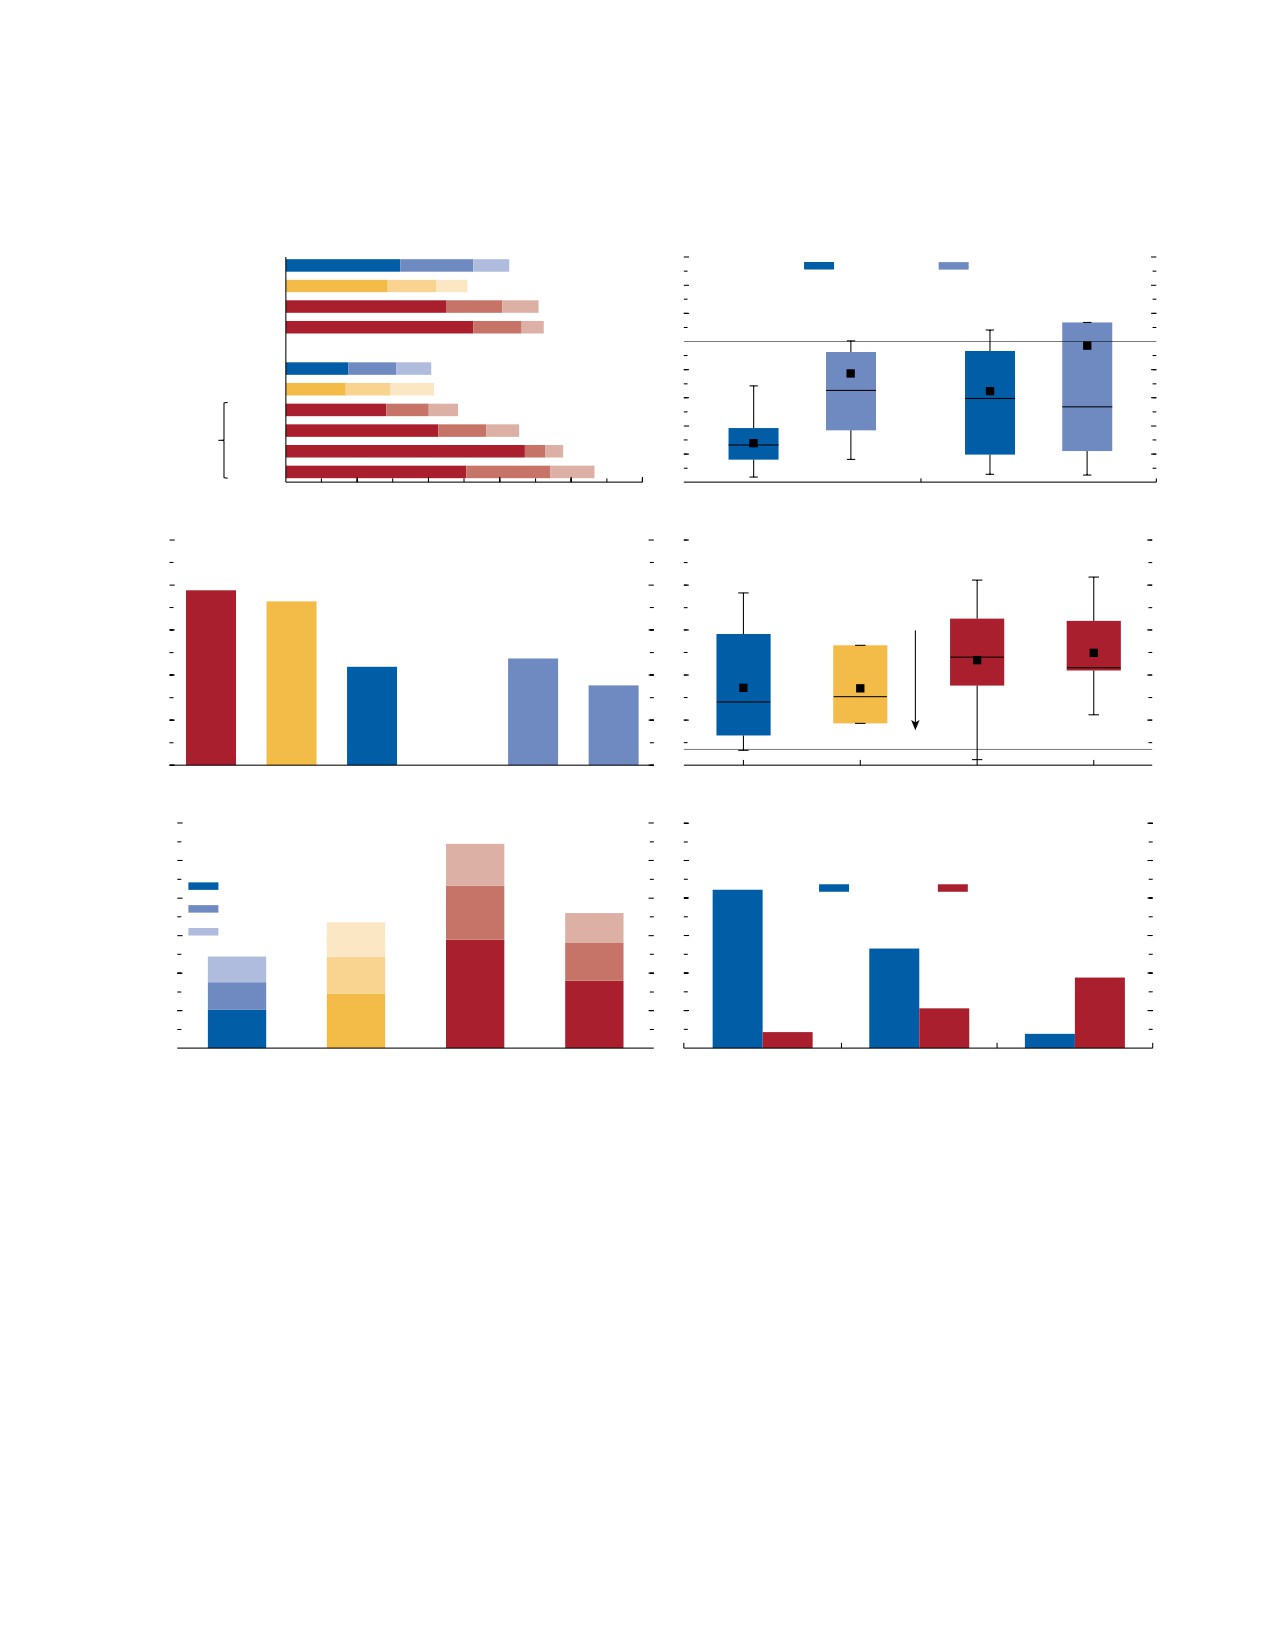
commodities on average (Figure 3.2, panel 1).5
vast array of goods and services (Figure 3.2, panel 3),
Minerals represent a special case: production is
they are often hard to substitute, and demand
concentrated both at the first stage (mining) because
responds little to swings in prices. Tis is reflected in
of the geographic concentration of deposits, and also
their low price elasticity of demand, particularly in
at the second (processing) stage. Relocating production
the short term.
at the mining stage may be impossible over the short
and medium term, given the importance of natural
endowments.
Importance of Trade
With production highly concentrated and demand
Elasticities of Supply and Demand
often broadly spread across countries, commodities are
heavily traded. Teir homogeneity and fungibility—
Te price elasticity of supply, which measures how
despite low demand and supply elasticities, com-
output responds to price changes, is relatively low for
modities have a high elasticity of substitution across
commodities in the short term (Figure 3.2, panel 2).
suppliers—also contribute to market integration. Te
Scaling up production requires large investments,
share of production traded internationally is higher
environmental permitting, and community consulta-
for most commodities than the ratio of world trade to
tions that can delay a supply response to price changes.
gross output (Figure 3.2, panel 4). On average across
For example, it takes on average 16 years from explo-
agricultural and energy commodities, about 30 percent
ration to the opening of copper mines (IEA 2021).
of output is dedicated to trade and about 45 percent
Discovering new deposits is also costly and takes time.6
for minerals, with the shares substantially higher for
many commodities.7
5Te chapter focuses on countries and not firms. Commodity
As a result, imports satisfy a large part of the demand
extraction is often undertaken by multinationals or firms owned by
foreign investors (Leruth and others 2022). Firm-level concentra-
for commodities. However, many countries depend on
tion could be different from country-level concentration. However,
only a handful of suppliers (Figure 3.2, panel 5). For
governments are typically the ultimate owners of land or reserves and
example, roughly half of the world’s countries rely on
lease them to firms for a limited time. Renegotiations of lease terms
as well as expropriations are common (Jaakkola, Spiro, and Van
three or fewer exporting countries for their imports of
Benthem 2019). Te chapter also focuses on production rather than
minerals, and a quarter on only one. Tis leaves them
reserves owing to lack of data availability. Reserves and production
vulnerable to supply disruptions in the near term.8
are highly correlated (USGS 2023).
Online Annex 3.2 provides the production and import con-
centration and the share of trade in output for the commodities.
Concentration of production is also apparent at the firm level, with a
7Even though commodities are heavily traded, their share in
few countries taking stakes in key firms (Leruth and others 2022).
global trade has declined as trade liberalization, lower transportation
6Elasticities below 1 are generally considered low. See Fally and Sayre
costs, and cross-border production chains have supported the rapid
(2018) and Dahl (2020) for a literature review on supply and demand
rise in intermediate-goods trade. Te share of primary goods in total
elasticities across commodities. Arezki, van der Ploeg, and Toscani
goods trade declined from roughly 45 percent in the first half of
(2019) analyze the responsiveness of resource discoveries to market
the 20th century to about 13 percent in 2019-21 (Online Annex
incentives. It is worth noting that the sizable investments needed to
Figure 3.2.4).
expand the supply of commodities may be hindered by the disruptions
8Historically, countries were often able to adapt to trade disrup-
in external capital flows and higher uncertainty that geoeconomic frag-
tions over the medium to long term by finding alternative suppliers,
mentation might trigger, as discussed in the April 2023 World Economic
because of commodities’ homogeneity, or by developing substitutes
Outlook and April 2023 Global Financial Stability Report.
(see Box 3.2).
74
International Monetary Fund | October 2023
CHAPTER 3 Fragmentation and Commodity Markets: Vulnerabilities and Risks
Figure 3.2. Commodities: Key Characteristics
1. Average Share of Top Three Countries in World Production across
2. Distribution of Price Elasticities of Commodities’ Supply and
Commodities
Demand
(Percent of global production)
(Percent)
1.6
Agriculture
Short term
Long term
Energy
1.4
Minerals (mined)
1.2
Minerals (refined)
1.0
Wheat
0.8
Crude oil
0.6
Copper
Green
0.4
Nickel
transition
Cobalt
0.2
metals
Lithium
0.0
0
20
40
60
80
100
Demand
Supply
5
3. Upstreamness in Value Chains
4. Share of Traded World Production
100
(Index)
(Percent of global production)
4
80
World trade/
gross output
3
60
2
40
1
20
0
0
Minerals
Energy
Agriculture
Manufacturing Services
Agriculture
Energy
Minerals (mined) Minerals (refined)
60
5. Share of Countries that Import from Only One, Two, or Three
6. Vulnerability to Food Insecurity: Wheat
120
Suppliers
(Percent of annual consumption)
50
(Percent)
100
One supplier
Net imports
Domestic storage
40
80
Two suppliers
30
Three suppliers
60
20
40
10
20
0
0
Agriculture
Energy
Minerals (mined) Minerals (refined)
LICs
EMs
AEs
Sources: Antràs and others (2012); British Geological Survey; Dahl (2020); Fally and Sayre (2018); Food and Agriculture Organization of the United Nations; Gaulier
and Zignago (2010); International Energy Agency; US Department of Agriculture; US Geological Survey; and IMF staff calculations.
Note: “Energy” refers to coal, natural gas, and crude oil. This figure uses 2019 data due to data availability and to avoid biases caused by the pandemic. Panel 1
provides the share of global production that the top three producing countries account for (see Online Annex Figure 3.2.2) and gives averages across commodity
types. In panels 2 and 4, the horizontal lines in the bars represent the median, the squares the average, the bars the interquartile range, and the whiskers the
minimum and maximum values across commodities in the group. In panel 3, sectoral upstreamness is based on Antràs and others (2012) and is computed as the
weighted average position of an industry’s output in the value chain. The upstreamness index captures how far a specific sector is from the final end usage, with a
lower index value (minimum value of 1) implying that the sector is closer to final demand. Panel 4 does not include palladium and platinum due to data quality.
Panel 5 depicts the simple average across commodities of each group. Panel 6 depicts the simple average across countries within each income group, for 2019.
AEs = advanced economies; EMs = emerging markets; LICs = low-income countries.
Import dependence in agricultural commodities
populations to large swings in prices or food short-
can lead to food insecurity in case of trade disrup-
ages (Figure 3.2, panel 6). Te ramifications of food
tions, particularly in low-income countries. For
commodity shocks, which have been linked to social
instance, the average low-income country imports
unrest, conflict, and migration (Kelley and others
more than 80 percent of the wheat it consumes.
2015; Missirian and Schlenker 2017; Burke and
Given low storage capacity, consumption smooth-
McGuirk 2020), go beyond the economic analysis
ing can be difficult in these countries, exposing
that follows.
International Monetary Fund | October 2023
75
WORLD ECONOMIC OUTLOOK: Navigating Global Divergences
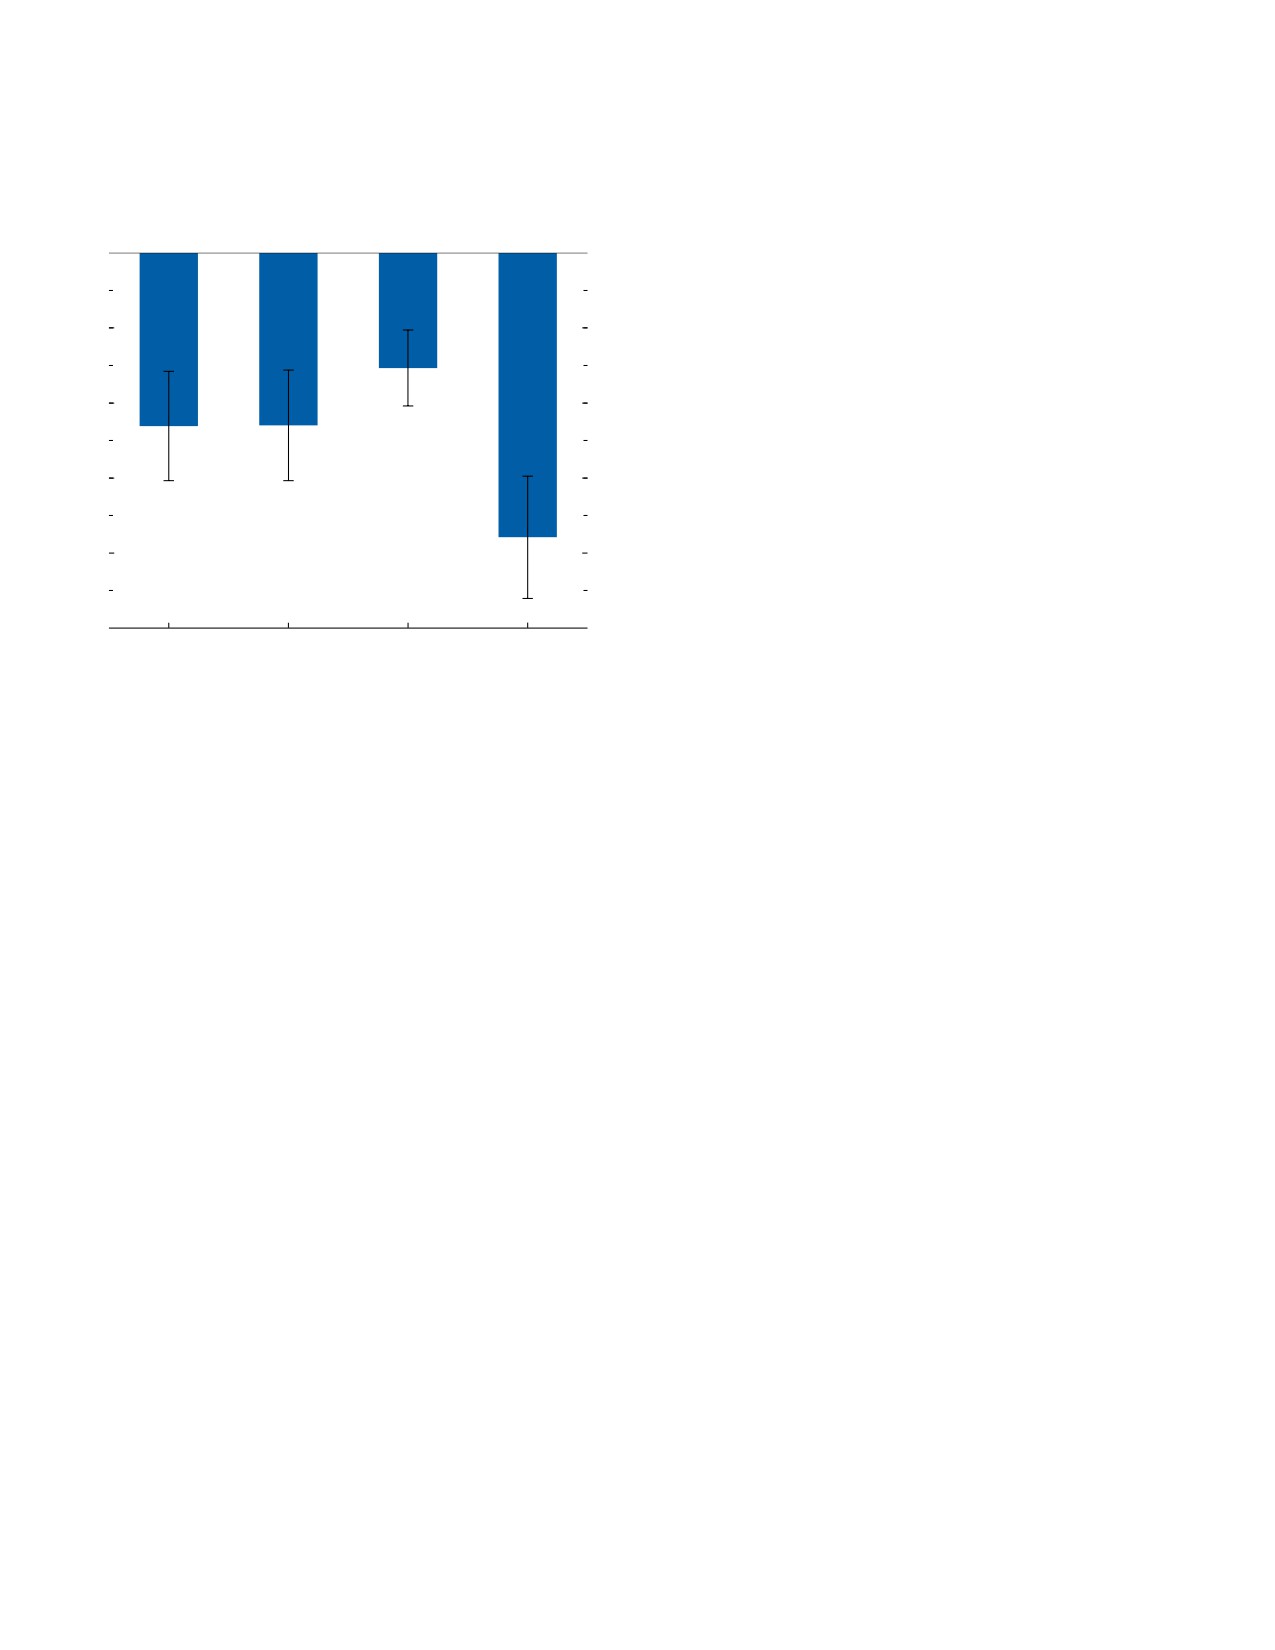
Figure 3.3. Commodity Trade and Distance of Military
associated with a decrease in trade in energy commodities
Alliances
by about 15 percent but it is associated with a more than
(Coefficients)
35 percent decline in minerals trade. Te exercise suggests
that changes in military alliances because of rising geopo-
0.0
litical tensions could go hand in hand with disruptions of
trade flows and fuel fragmentation of commodity trade.
-0.1
Fragmentation in Commodity Markets
-0.2
Tis section takes stock of various measures of
fragmentation. Te number of new interventions in
commodity trade has risen every year since 2018, with
-0.3
the increase initially fueled by tensions between China
and the United States and the COVID-19 pandemic.
In 2022, Russia’s war in Ukraine caused a major spike
-0.4
in new trade restrictions for commodities: there were
more than six times more new restrictions affecting
trade in commodities in 2022 than the 2016-19 aver-
-0.5
All commodities
Agriculture
Energy
Minerals
age. In contrast, trade-restricting measures on overall
trade increased 3.5 times (Figure 3.4, panel 1).10
Sources: Food and Agriculture Organization of the United Nations; Gaulier and
Zignago (2010); Leeds and others (2002); Signorino and Ritter (1999); and IMF
Price dispersion across locations can also be a symp-
staff calculations.
tom of fragmentation: as commodities are homoge-
Note: “Energy” refers to coal, natural gas, and crude oil. The bars in the figure
neous goods, they should trade under one price after
denote the point estimates, and the vertical lines represent 95 percent confidence
intervals. Standard errors are clustered at the importer country level. Estimates
transportation costs are accounted for. However, price
are based on an inverse hyperbolic sine specification to account for zeros.
dispersion increased in major commodity markets in
Distance of military alliances is measured using the similarity between countries’
portfolios of military alliances and standardized so its standard deviation is 1 in
2022, especially in those for some minerals, such as
each year. A standardized military distance of 1 is approximately the distance
lithium, and energy commodities (Figure 3.4, panel 2).
between India and Morocco in 2018.
For example, Russian coal traded at a price almost
three times lower than Australian coal in September
Sensitivity to Geopolitics
2022. Price dispersion for crude oil and natural gas
Analysis of trade patterns suggests that commodity
also rose as the war in Ukraine and associated sanc-
trade is historically associated with countries’ geopolitical
tions disrupted trade. Box 3.1 documents shifts in
alignment. Gravity equations, estimated for the commodi-
trade flows using real-time vessel-tracking data.
ties in the sample and augmented to include the similarity
Other proxies for fragmentation are changes in the
between countries’ portfolios of military alliances, show
number of FDI projects and cross-border mergers and
that bilateral commodity trade flows are negatively associ-
acquisitions, which are also indicators of future trade.
ated with military distance (Figure 3.3).9 However, notable
Tey were declining in the energy and mineral sectors
differences are apparent in the strength of the relationship
even before the war in Ukraine, which could presage a
across types of commodities: a one-standard-deviation
slowdown in commodity trade (Figure 3.4, panel 3).11
increase in the distance of military alliances (approximately
Shifts have also occurred in the origin and destination
the distance between India and Morocco in 2018) is
10Trade interventions in the Global Trade Alert database, the
9Te gravity model is widely used to explain bilateral trade flows
source for the data in Figure 3.4, panel 1, include both measures
based on country and country pair characteristics that capture
that increase fragmentation, such as import tariffs and export restric-
trading costs, such as geographic distance or a common border, lan-
tions, and measures that aim to limit the economic fallout from
guage, or currency. Online Annex 3.3 provides details and robustness
fragmentation by encouraging diversification, such as subsidies for
checks. Distance in military alliances is associated with lower trade in
local producers, local-content requirements, and the like—although
minerals across specifications. Te results are more sensitive for other
a strict distinction between the two is difficult.
measures of geopolitical alignments, namely, the ideal point distance
11Following Chapter 4 of the April 2023 World Economic Outlook,
based on UN votes, used in Chapter 4 of the April 2023 World
the analysis focuses on the number rather than the value for FDI
Economic Outlook in a similar analysis for FDI flows (see also Jaku-
and cross-border mergers and acquisitions. Data on values are
bik and Ruta 2023). Hakobyan, Meleshchuk, and Zymek (2023)
limited and often estimated. However, FDI values suggest a similar
examine distance in military alliances and sectoral trade flows.
decline in the commodity sector.
76
International Monetary Fund | October 2023
CHAPTER 3
Fragmentation and Commodity Markets: Vulnerabilities and Risks
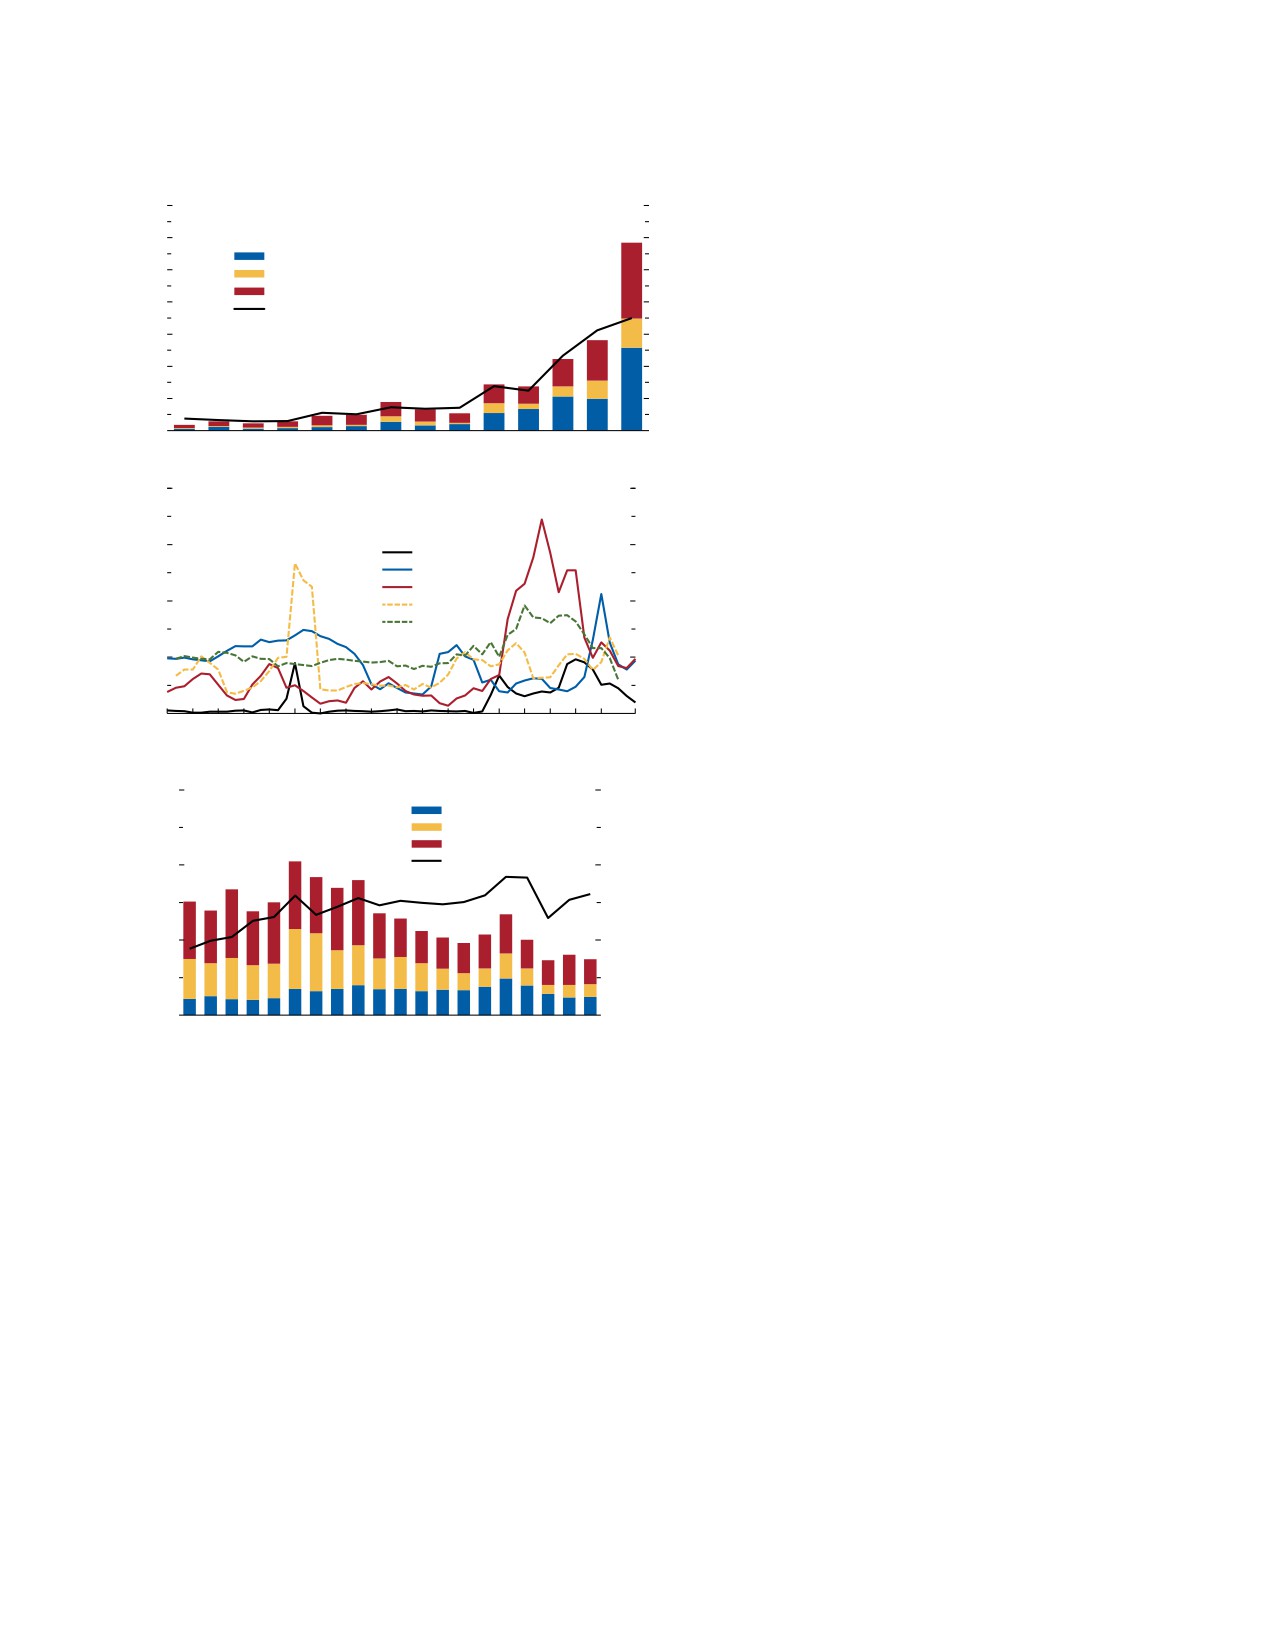
Figure 3.4. Signs of Fragmentation
No measure of fragmentation is perfect. It is still
too early to assess how long-lasting price dispersion
700
1. Number of Trade Interventions by Sector
will be. Te decline in FDI could reflect moder-
(Indices, 2016-19 = 100)
600
ation in commodity prices since 2015, following
Agriculture
500
Energy
the decade-long commodity boom, and it is not
Minerals
clear, on account of lagging data, to what extent
400
All goods
trade-restricting measures have affected trade flows
300
(Goldberg and Reed 2023). However, taken together,
200
these measures suggest rising commodity market
100
fragmentation.
0
2009
10
11
12
13
14
15
16
17
18
19
20
21
22
Which Commodities Are Most Vulnerable?
400
2. Price Dispersion
(Difference between maximum and minimum as percentage of
To assess individual commodities’ vulnerability
minimum price across regions)
300
in the event of fragmentation, this section presents
Crude oil
Lithium
results from a single-commodity, multicountry partial
Coal
equilibrium model based on Alvarez and others (2023)
200
Wheat
Phosphate
(see also Online Annex 3.4 for details). It computes
price changes that would occur if trade for each of the
100
48 commodities included in the analysis were banned
across two blocs.
0
Jan.
Jul.
Jan.
Jul.
Jan.
Jul.
Jan.
Jul.
Jan.
Aug.
For illustrative purposes, the main scenario
2019
19
20
20
21
21
22
22
23
23
assumes that the two theoretical blocs are constructed
based on the 2022 UN vote on Russia’s war in
1,500
3. Foreign Direct Investment and Cross-Border Mergers
36,000
and Acquisitions
Agriculture
Ukraine. Te bloc comprising countries that voted
(Number of projects a year)
Energy
for Russia to withdraw from Ukraine is labeled the
Minerals
1,000
All sectors (right scale)
24,000
“US-Europe+ bloc”; the remaining countries are in
the “China-Russia+ bloc.”13 Te exercise assumes,
in a highly stylized and extreme way, that there is
500
12,000
no trade in a particular commodity between blocs,
whereas intrabloc trade of the commodity is unaf-
fected. Box 3.2 discusses more fluid experiences of
0
0
2003
05
07
09
11
13
15
17
19
21 22
fragmentation; investigating the impacts of those
intermediate scenarios is beyond the scope of the
Sources: Argus Media, Inc.; Bloomberg Finance L.P.; FDI Markets; Global Trade
chapter. Rather, the chapter’s goal is to identify rela-
Alert database; Refinitiv Eikon; UN Comtrade; and IMF staff calculations.
Note: Policy interventions are adjusted for reporting lags, and trade-liberalizing
tive vulnerabilities across commodity markets and to
interventions are excluded from calculations. Prices for crude oil, coal, and lithium
illustrate transmission channels, with the recognition
are market prices in different regional markets as retrieved from Bloomberg
Finance L.P. Wheat and phosphate price dispersion is estimated based on export
that partial interactions between blocs and arbi-
prices for countries that account for more than 5 percent of global exports, based
trage opportunities could mute the economic effects
on export data from UN Comtrade. Panel 3 presents the total number of foreign
implied by the model simulations.
direct investment and cross-border mergers and acquisitions projects at the global
level. The bars provide a breakdown by commodity group.
For each commodity, the model’s initial calibra-
tion is based on observed 2019 trade flows. Tey are
of commodity FDI and cross-border mergers and
assumed to reflect an integrated world, where goods
acquisitions. US and EU investors are increasingly tar-
are traded at one global price.14 Te trade ban across
geting projects in advanced economies, whereas China
and Russia have increased their investments in Africa
13See also Chapter 3 of the October 2022 Regional Economic
(see Online Annex Figure 3.2.5).12
Outlook: Asia and Pacific. More details on the countries in each bloc
and sensitivity checks for other bloc configurations are in Alvarez
and others (2023) and Online Annexes 3.1.2 and 3.5.2.
12Chapter 4 of the April 2023 World Economic Outlook documents
14Te assumption of perfect trade integration in the baseline over-
FDI flows are increasingly concentrated among geopolitically aligned
simplifies reality, as markets for some commodities were not perfectly
countries, particularly in strategic sectors.
integrated globally even before the war in Ukraine.
International Monetary Fund | October 2023
77
WORLD ECONOMIC OUTLOOK: Navigating Global Divergences
blocs yields bloc-specific prices that clear bloc-level
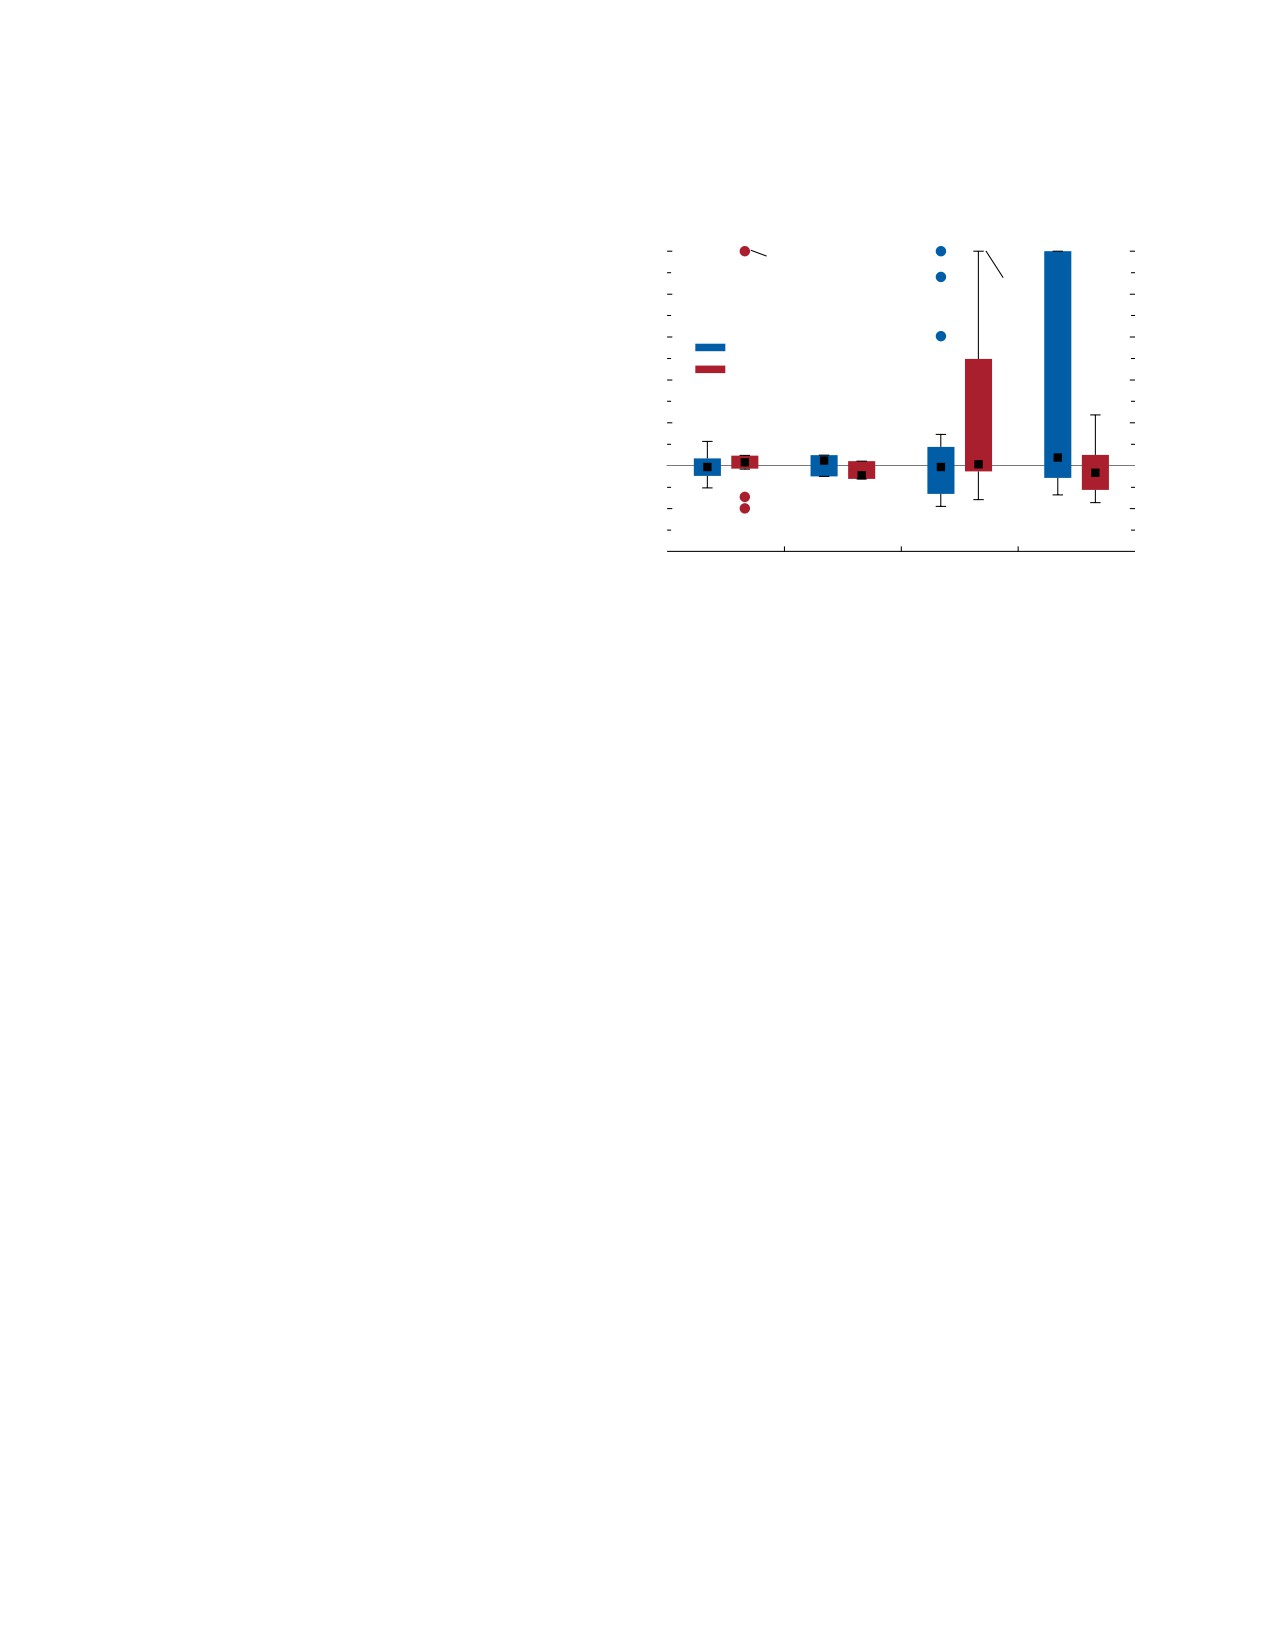
Figure 3.5. Price Changes Due to Fragmentation in Individual
supply and demand.
Commodity Markets
(Percent)
Fragmentation would induce opposite price effects
across blocs. Te price of a commodity falls in the bloc
Above
Palm oil,
that used to be a net exporter of that commodity and
500
soybean
increases in the net importing bloc. Te size of price
400
Cobalt,
copper,
changes depends on (1) bloc-level supply-and-demand
lithium,
300
imbalances prior to fragmentation—that is, the extent
US-Europe+
nickel
China-Russia+
to which a bloc relies on imports to satisfy its demand
200
at the integrated world price—and (2) the capacity of
100
demand and supply to respond to changing prices (the
price elasticities of demand and supply). Commodities
0
with inelastic demand and supply and with high imbal-
ances across blocs are more vulnerable to price changes.15
-100
Model simulations suggest that the potential price
-200
impact of fragmentation would vary significantly across
Agriculture
Energy
Minerals (mined) Minerals (refined)
commodities, with some potentially experiencing very
Sources: British Geological Survey; Food and Agriculture Organization of the United
large price increases (Figure 3.5; see Online Annex
Nations; Gaulier and Zignago (2010); International Energy Agency; United States
Figure 3.5.1 for the underlying commodity-specific
Geological Survey; and IMF staff calculations.
Note: Price effects are capped at 500 percent for readability. “Energy” refers to
results).16 In the China-Russia+ bloc, the price of
coal, natural gas, and crude oil. The black squares in the bars represent the
mined minerals, including cobalt, lithium, copper,
median; the bars, the interquartile range; and the whiskers, the data points within
1.5 times the interquartile range from the 25th or 75th percentile across
and nickel, which are critical for the green transition,
commodities in the group. The dots indicate outliers. Selected commodities which
would rise substantially. Production of these miner-
experience price increases higher than 500 percent are labeled. For the underlying
complete information on commodity-specific price changes, see Online Annex
als would be concentrated in a handful of countries
Figure 3.5.1. The bloc including the countries that voted for Russia’s withdrawal
in the US-Europe+ bloc, but they are largely used as
from Ukraine in the 2022 UN vote is labeled the “US-Europe+ bloc,” and the
inputs in the China-Russia+ bloc (see Online Annex
remaining countries are included in the “China-Russia+ bloc.”
Figure 3.2.6). At the same time, the US-Europe+ bloc
could experience similar increases in the prices of
country compositions of the two hypothetical blocs,
refined minerals, which are processed mostly in China,
described in Online Annex 3.5.2, suggest that, in a way
Russia, and South Africa.
similar to what occurs in the main simulation, fragmenta-
In contrast, the potential price changes for energy
tion would lead to significant price increases for minerals
and most agricultural commodities are more subdued
at the mining stage and for key agricultural staples (such
in the main simulation. Since the production of these
as soybeans) in the China-Russia+ bloc. In an alternative
commodities is less geographically concentrated,
bloc scenario, in which all emerging market and devel-
supply and demand are more balanced across the two
oping economies, excluding India, Indonesia, and Latin
blocs. However, palm oil and soybean represent two
American countries, are assigned to the China-Russia+
important outliers: more than 80 percent of produc-
bloc, the US-Europe+ bloc could experience large price
tion would occur in the US-Europe+ bloc, whereas
increases for some minerals. Tis is because key producers
most of the consumption would take place in the
are allocated to the other bloc. It could also become more
China-Russia+ bloc.
vulnerable in case of trade restrictions on some agricul-
Because of high geographic concentration, the
tural commodities (such as cocoa) and crude oil.
vulnerability of commodities in the event of fragmenta-
tion depends on the distribution of key exporters (and
importers) across blocs. Simulations based on different
Higher Commodity Price Volatility
Fragmented commodity markets would lead to
15Te exercise does not explicitly model storage, which is an
higher price volatility (see Jacks, O’Rourke, and
important feature of volatility smoothing. See among others, Williams
Williamson 2011, for historical evidence). Tis would
(1936), Gustafson (1958), and Wright and Williams (1982). Carter,
challenge public finances and fiscal and monetary
Rausser, and Smith (2011) provide a literature review.
frameworks, giving rise to potential procyclicality of
16Te following partial equilibrium results are based on Alvarez
and others (2023).
fiscal and monetary policies and hurting economic
78
International Monetary Fund | October 2023
CHAPTER 3 Fragmentation and Commodity Markets: Vulnerabilities and Risks
stability (Cavalcanti, Mohaddes, and Raissi 2015;
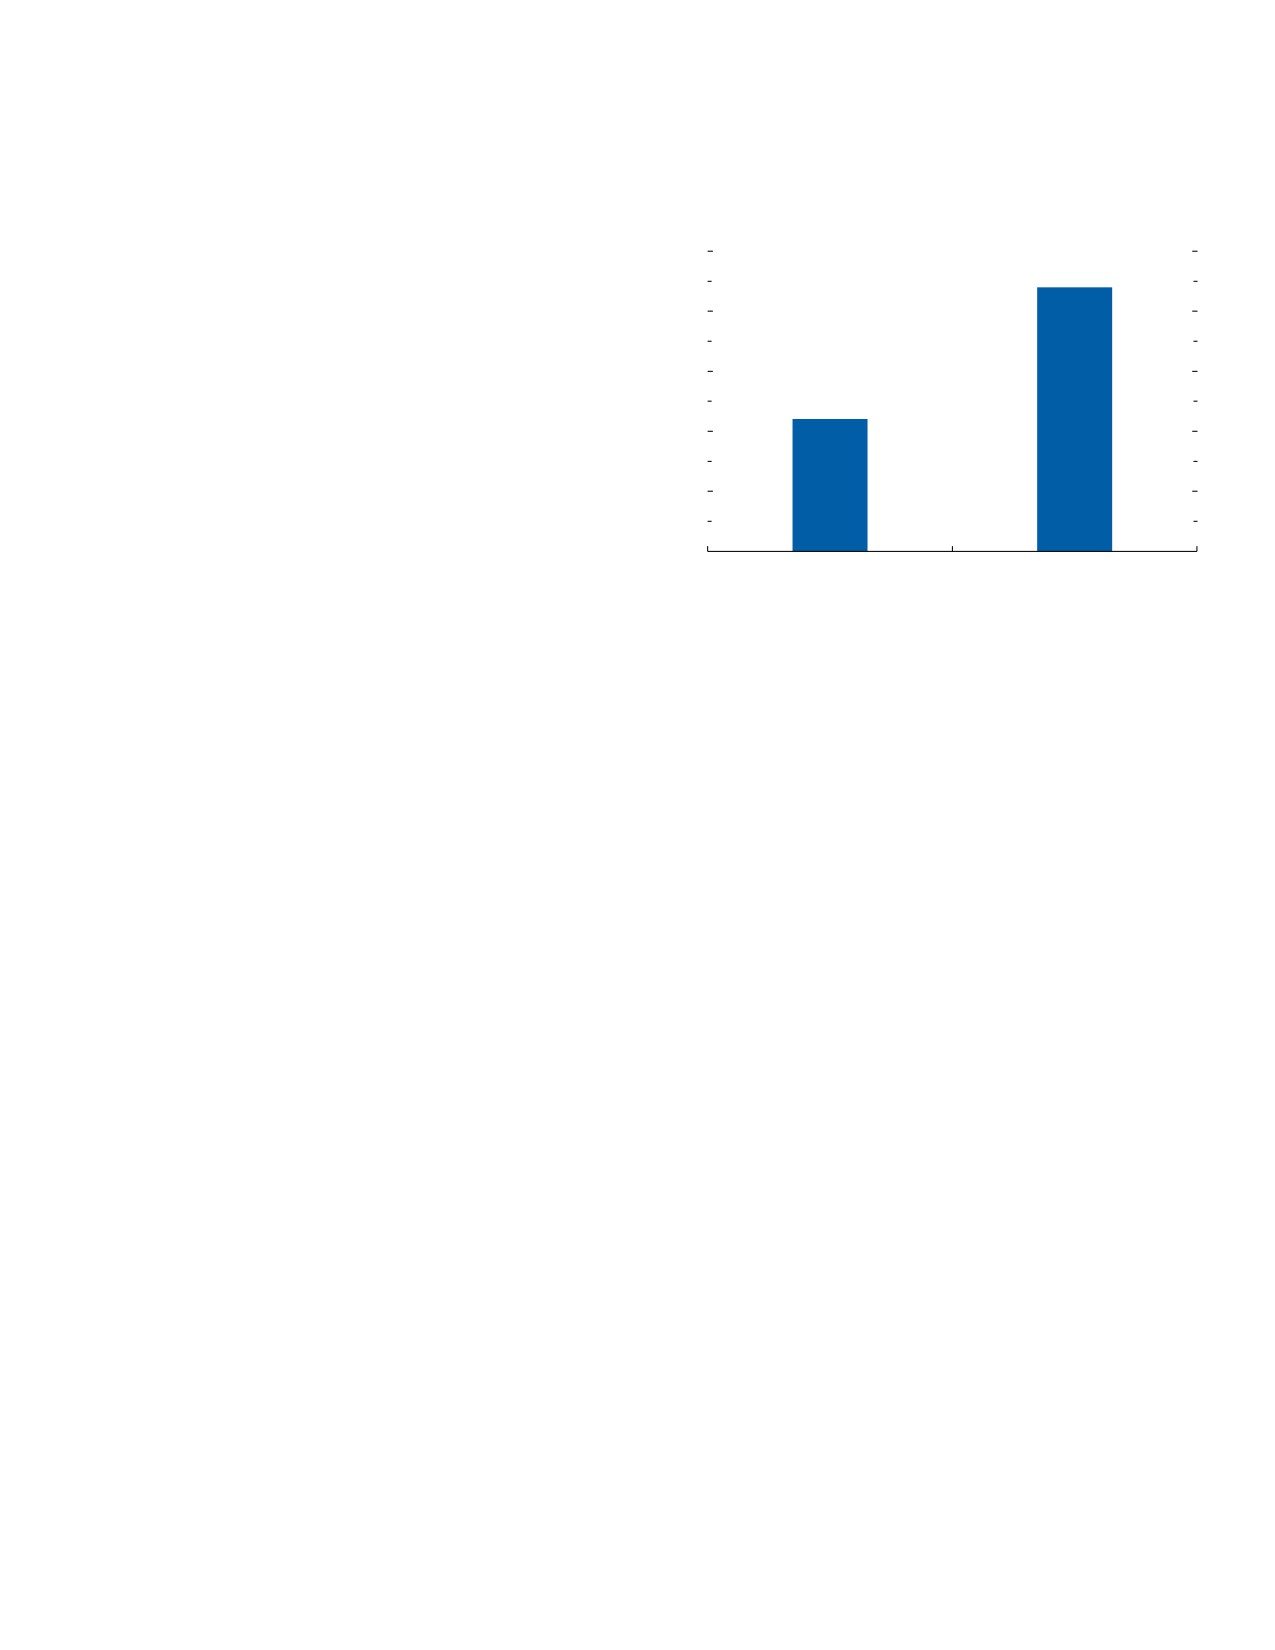
Figure 3.6. Wheat Price Increase in the US-Europe+ Bloc due
IMF 2023). Fragmentation can affect price volatility
to a Harvest Shock
(Percent)
through at least two channels: smaller market sizes and
countries switching blocs.17
10
Smaller Market Sizes
8
In a fragmented world, markets would become
smaller and bloc-level prices more responsive to
6
country-level shocks (see also Albrizio and others
2023). In the partial equilibrium model, the price
response is proportional to the supply shock’s size rela-
4
tive to the overall market. Tus, by restricting the set of
countries with which they trade, countries would face
2
larger price increases in response to the same negative
supply shocks.18 In an illustrative example, Figure 3.6
0
compares the price impact of a three-standard-deviation
Integrated world
Fragmented world
shock to the US wheat harvest in an integrated market
Sources: Food and Agriculture Organization of the United Nations; and IMF staff
with that in a fragmented market.19 Te same supply
calculations.
shock doubles the impact on wheat prices when trade
Note: The bars in the figure depict the change in the price of wheat in the
US-Europe+ bloc (those countries that voted for Russia to withdraw from Ukraine
is fragmented into two smaller blocs. Tis is important,
in the 2022 UN vote on the Ukraine war) from a three-standard-deviation negative
as climate change is expected to raise the variability of
shock to US wheat production. The figure compares the price increases in the bloc
in a free-trade world to those in a fragmented world.
agricultural output. A fragmented world, in which the
price response to supply shocks is amplified, would be
less able to cope with this challenge.
To illustrate price sensitivity to countries switching
blocs, Figure 3.7 shows the distribution of the great-
Countries Switching Blocs
est price increases each commodity can experience in
In a fragmented world, major commodity producers
a bloc when a single exporting country switches its
would face powerful incentives to switch geopolit-
alliance.20 Minerals at the mining stage tend to be
ical allegiances, with such switching representing a
the most sensitive, given their highly concentrated
new source of supply shocks and price volatility. For
production. For example, South Africa produces
highly concentrated commodity markets, a single
one-third of the world’s manganese, a metal used in
exporting country switching to the other bloc could
steelmaking and batteries. If South Africa switched to
lead to a large supply gap and trigger hefty price
the US-Europe+ bloc, the price of manganese in the
changes. Uncertainty about a country’s geopoliti-
China-Russia+ bloc could rise more than 800 percent.
cal alignment could itself lead to price volatility as
traders update their priors regarding potentially large
Economic Impacts of Commodity Market
fragmentation-induced price swings.
Fragmentation
Tis section sheds light on the macroeconomic
17Other channels could include the impact on the financial
impacts of fragmenting commodity markets on
ecosystem linked to commodities, such as derivatives and insur-
individual economies, blocs, and the global economy.
ance (FSB 2023).
18In the single-commodity model, the price change in response to
Tree complementary analytical approaches are used.21
_
,
with Elasticity of Demand < 0 (Alvarez and others 2023).
20Tese results are based on Alvarez and others (2023). Online
19Te United States accounts for about 7 percent of global and
Annex Figure 3.5.2 zooms into the results in Figure 3.7 by showing
15 percent of US-Europe+ bloc wheat production. A three-standard-
the 15 commodities whose prices are most vulnerable to a single
deviation US harvest shock corresponds to about 60 percent of US
exporter switching blocs and the implied price changes.
wheat production, or 4 percent of global output, with wheat prices held
21Online Annexes 3.4-3.6; Alvarez and others (2023); and Bolhuis,
constant. Te exercise uses a price elasticity of supply of 0.2 and a price
Chen, and Kett (2023) discuss the assumptions, calibration, and
elasticity of demand of -0.85 (see Alvarez and others 2023). Lower
additional results of each model. None of the approaches consider the
elasticities would lead to higher price impacts, and fragmentation would
impact of fragmentation on productivity and innovation. Te role of
still double the price impact in this example.
the financial sector is also outside of the scope of the chapter.
International Monetary Fund | October 2023
79
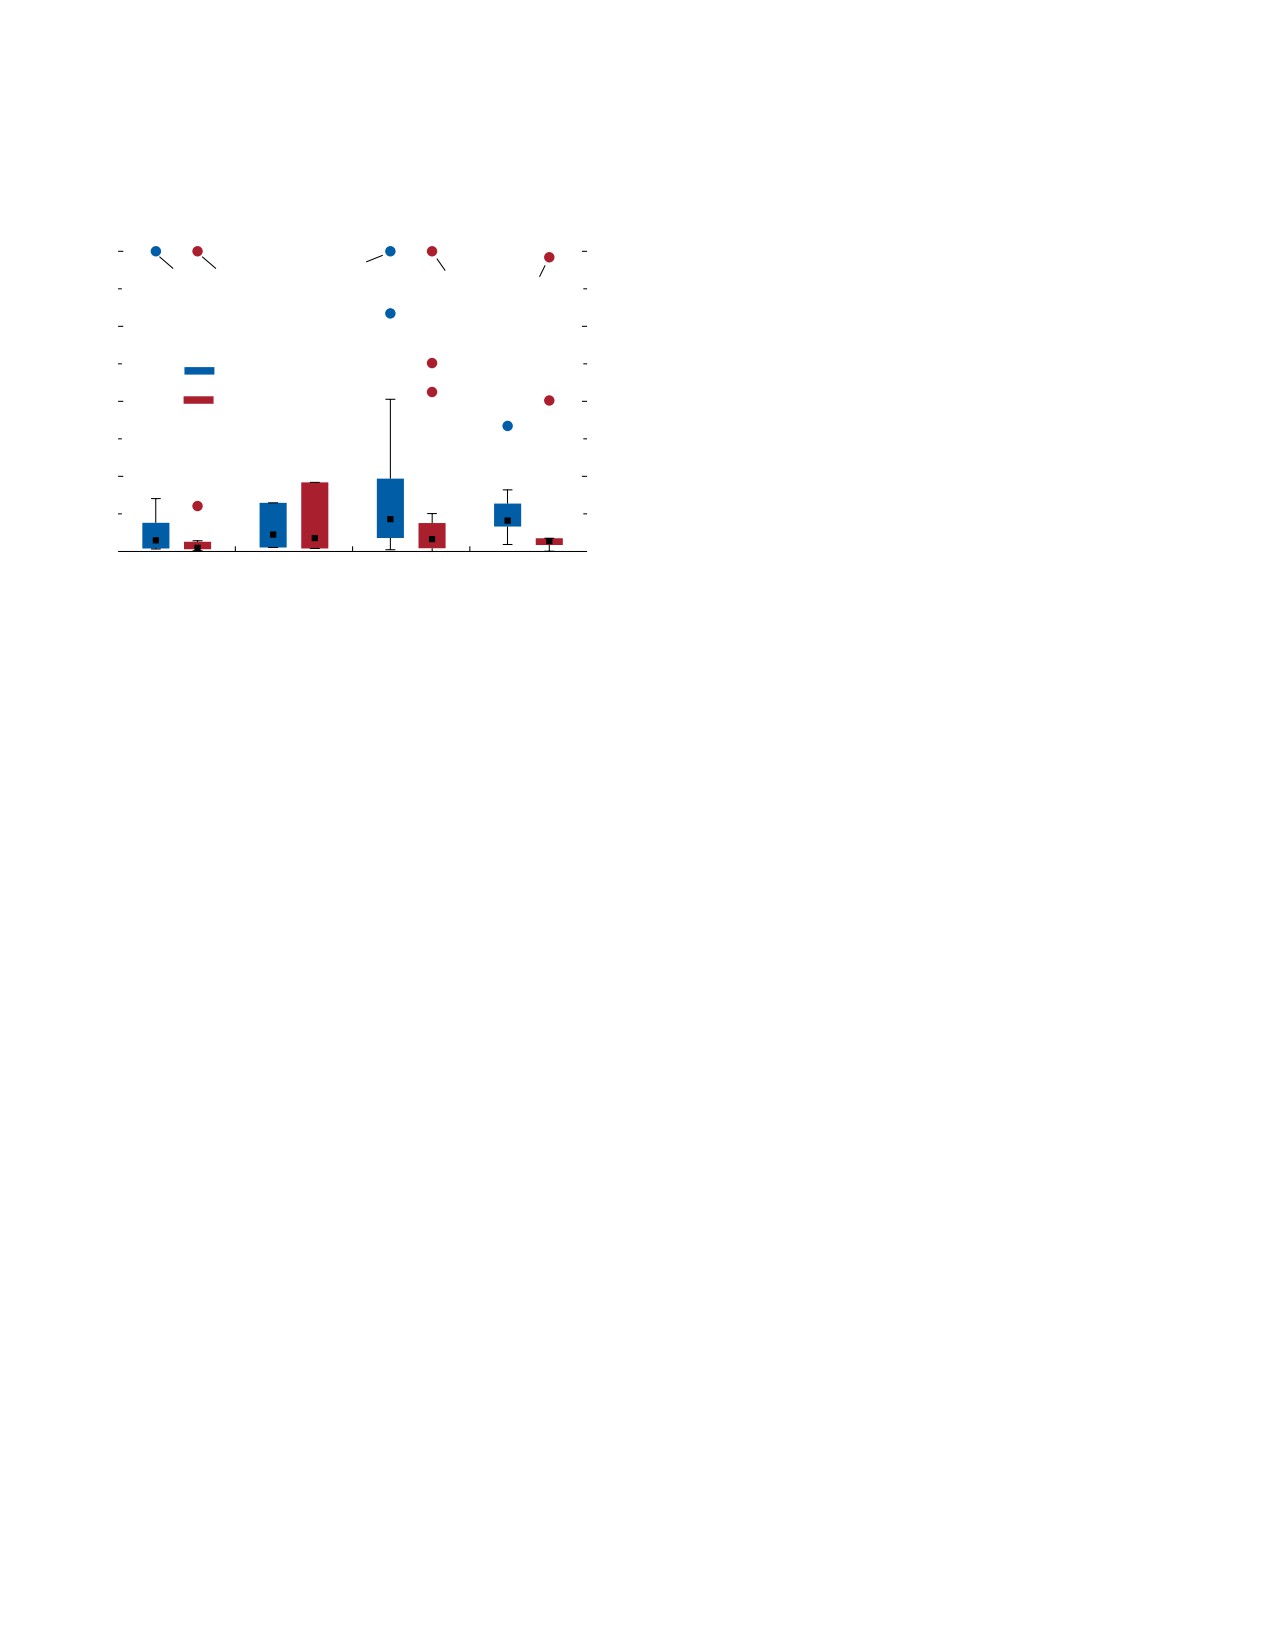
WORLD ECONOMIC OUTLOOK: Navigating Global Divergences
Figure 3.7. Largest Price Increases Induced by a Single
fragmenting all commodity trade and to examine
Exporter Switching Blocs
the role of neutral blocs (see Box 3.3). Finally, the
(Percent)
dynamic effects on GDP and inflation are exam-
ined in a multiregion dynamic stochastic general
Above
Cobalt,
800
iron ore,
equilibrium model that includes energy and criti-
Cocoa Cocoa
Manganese
fluorspar
Platinum
cal minerals.
600
US-Europe+
Evidence from the Partial Equilibrium Model
400
China-Russia+
Several findings emerge from the partial equilibrium
approach. First, inefficiencies associated with restrict-
ing trade result in losses in bloc-level total surplus: the
200
global economy is worse off from the fragmentation
of trade in individual commodities (see Figure 3.8,
panel 1).22
0
Agriculture
Energy
Minerals (mined) Minerals (refined)
Second, bloc-level changes in total surplus are gen-
erally small (with some notable exceptions23), masking
Sources: British Geological Survey; Food and Agriculture Organization of the United
important heterogeneities across countries. Within
Nations; Gaulier and Zignago (2010); International Energy Agency; United States
Geological Survey; and IMF staff calculations.
each bloc, some countries would experience an increase
Note: Price effects are capped at 800 percent in the figure for readability.
in surplus (net-exporting countries in a net-importing
“Energy” refers to coal, natural gas, and crude oil. Each observation in the box
plots represents the largest price increase that a commodity can experience in
bloc and net-importing countries in a net-exporting
each bloc from a single exporting country’s switching to the other bloc. Note also
bloc), and some experience a decline. Such changes
that the US (China) is not allowed to switch away from the US-Europe+
(China-Russia+) bloc. The black squares in the bars represent the median; the
would be small for most countries as a share of gross
bars, the interquartile range; and the whiskers, the data points within 1.5 times
national expenditure but could be very sizable for a
the interquartile range from the 25th or 75th percentile across commodities in the
group. The dots indicate outliers; the commodities representing the largest outliers
few commodity importers and exporters, as shown in
are labeled. For the underlying complete information on commodity-specific price
Online Annex Figure 3.5.4. For instance, fragmenta-
changes, see Online Annex Figure 3.5.2. The bloc including the countries that
tion of copper at the mining stage would reduce sur-
voted for Russia’s withdrawal from Ukraine in the 2022 UN vote is labeled the
“US-Europe+ bloc,” and the remaining countries are included in the
plus by as much as 2.5 to 5 percent of gross national
“China-Russia+ bloc.”
expenditure in Chile and Peru, both exporters of
copper to the US-Europe+ bloc, in which prices would
fall. At the same time, it would lead to large surplus
First, the partial equilibrium model discussed earlier
gains in Kazakhstan and Mongolia, which would
is leveraged to compute changes in producer and
scale up exports at higher prices to the copper-scarce
consumer surplus due to fragmentation in individual
China-Russia+ bloc (Figure 3.8, panel 2).
commodity markets. Te resulting change in total sur-
Tird, restricting trade in commodities that are
plus is used as an indicator of economic impact. Tis
less price-vulnerable could still generate sizable
approach identifies the most macro-relevant commodi-
ties. It accounts for the changes in price and quantities
22Tis result and the following are based Alvarez and others
consumed or produced of each commodity because of
(2023). Tey also provide the analytical proof. In an integrated
fragmentation. However, due to its partial equilibrium
world, trade patterns reflect the efficient allocation of resources glob-
ally, with countries specializing in commodities for which they have
nature, the approach does not account for sectoral
comparative advantage (cost-effective deposits or suitable climate
spillover effects, nor does it allow for the simultane-
conditions). After fragmentation, trade patterns no longer reflect
ous disruption of trade in many commodities, which
these comparative advantages.
could have opposing or reinforcing effects within the
23Online Annex Figure 3.5.3 shows the five largest surplus losses
at the bloc level from the fragmentation of a single commodity.
same country.
Such data points are marked as outliers in Figure 3.8, panel 1,
Two general equilibrium models in the chapter
capped at -0.05 percent of gross national expenditure. In the
overcome these shortcomings. A static multicoun-
main simulation, trade fragmentation of palm oil or copper at the
mining stage could lead to surplus losses in the China-Russia+ bloc
try, multisector trade model, which accounts for
of more than 1 percent of gross national expenditure, and trade
all input-output linkages across sectors, is used to
fragmentation of iron ore or soybeans to surplus losses of more
simulate the long-term GDP losses associated with
than 0.5 percent.
80
International Monetary Fund | October 2023
CHAPTER 3 Fragmentation and Commodity Markets: Vulnerabilities and Risks
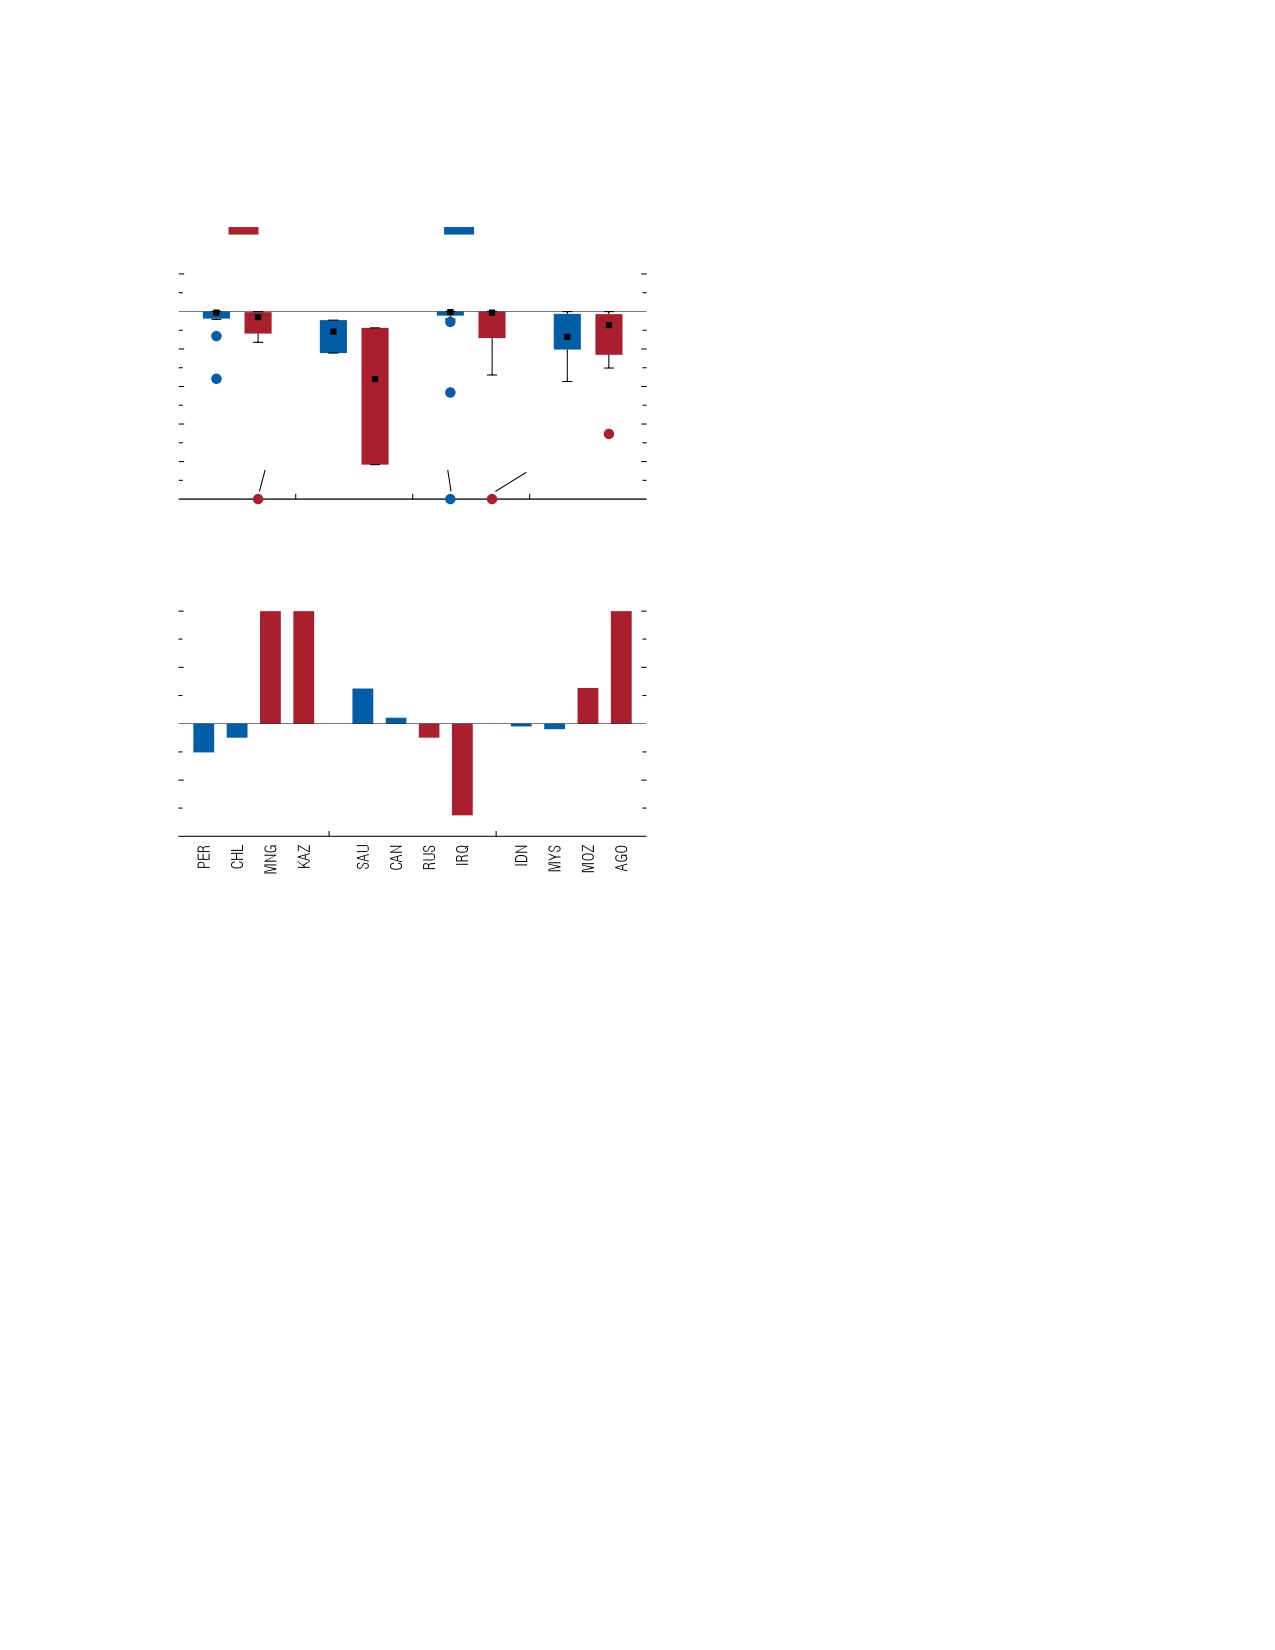
Figure 3.8. Surplus Changes due to Fragmentation in
Finally, surplus declines would generally be larger
Individual Commodity Markets
in the hypothetical China-Russia+ bloc. Commodities
that are most vulnerable are more broadly consumed in
China-Russia+
US-Europe+
this bloc (Online Annex Figure 3.5.3).24
0.01
1. Surplus Changes by Bloc and Commodity Group
(Percent of bloc-level GNE)
0.00
Evidence from the Trade Model
-0.01
Te general equilibrium multicountry, multisector
trade model presented in Box 3.3 simulates long-term
-0.02
GDP effects from the disruption of all commodity
-0.03
Copper,
trade. Broad differences are seen in the impact across
Palm oil,
iron ore,
–0.04
soybean
Iron ore
cobalt
countries, with some experiencing sizable losses.
Low-income countries could suffer deeper losses, on
Below
-0.05
Agriculture
Energy
Minerals (mined) Minerals (refined)
average estimated at 1.2 percent, given their high
dependence on agricultural trade. For some of these
2. Surplus Changes for Top Two Net Exporters in Each Bloc for
countries losses could amount to more than 2 per-
Selected Commodities
(Percent of GNE)
cent of GDP. Consistent with the single-commodity
Above
exercise, the hypothetical China-Russia+ bloc is more
20
affected by fragmentation, yet the global GDP loss, at
10
roughly 0.3 percent, is modest as a result of offsetting
effects across countries.25
0
Te economic impact can be greatly reduced if
commodity trade is only partially restricted. Illustrative
-10
simulations, in which countries that abstained from the
UN vote on Ukraine are assumed to trade commodi-
-20
ties freely, point to much smaller effects of trade bar-
riers between the US-Europe+ and the China-Russia+
Copper
Crude oil
Palm oil
blocs. Long-term changes in global GDP from this
scenario would be negligible, with meaningful losses
Sources: British Geological Survey; Food and Agriculture Organization of the United
Nations; Gaulier and Zignago (2010); International Energy Agency; United States
only in Russia. Tis is in line with historical evidence
Geological Survey; and IMF staff calculations.
on the ability of demand and supply of commodities
Note: “Energy” refers to coal, natural gas, and crude oil. In panel 1, each data
to adjust in response to trade restrictions (Box 3.2).
point in the box plots represents the total bloc-level surplus change from
fragmenting trade in a single commodity. The black squares in the bars represent
the median, the bars are the interquartile range, and the whiskers reflect the data
points within 1.5 times the interquartile range from the 25th or 75th percentile
Evidence from the Dynamic Macroeconomic Model
across commodities in the group. Dots indicate outliers; the commodities
associated with the largest surplus declines are labeled. The bloc including the
Tis subsection uses a dynamic stochastic general
countries that voted for Russia’s withdrawal from Ukraine in the 2022 UN vote is
labeled the “US-Europe+ bloc,” and the remaining countries are included in the
equilibrium framework to assess the dynamic GDP
“China-Russia+ bloc.” Data labels in the figure use International Organization for
and inflation effects of commodity fragmentation.
Standardization (ISO) country codes. GNE = gross national expenditure.
Te model is based on an augmented version of the
24Sensitivity checks in Online Annex 3.5.2 show that this holds
for a bloc configuration based on existing trade relationships. Alter-
surplus declines. For example, energy commodities
natively, if all emerging market and developing economies, excluding
are not particularly vulnerable under the baseline bloc
India, Indonesia, and Latin American countries, are assigned to the
configuration, but the associated declines in surplus
China-Russia+ bloc, the US-Europe+ bloc could experience larger
surplus losses, mainly on account of oil market disruptions.
would be more significant, because energy commod-
25Global GDP losses from restricting commodity flows between
ities are widely consumed and produced. In contrast,
blocs constitute about 15 percent of the loss from restricting all
minerals could experience strong price changes, but
trade. In comparison, commodities represent only 10 percent of total
trade. Te larger losses from fragmenting energy and agricultural
the surplus impact would be more subdued, given
markets in Bolhuis, Chen, and Kett (2023) stem from the assump-
their (so far) more limited relevance in most countries’
tion of full autarky compared with the no-trade-between-blocs
production and consumption.
scenario in the chapter.
International Monetary Fund | October 2023
81
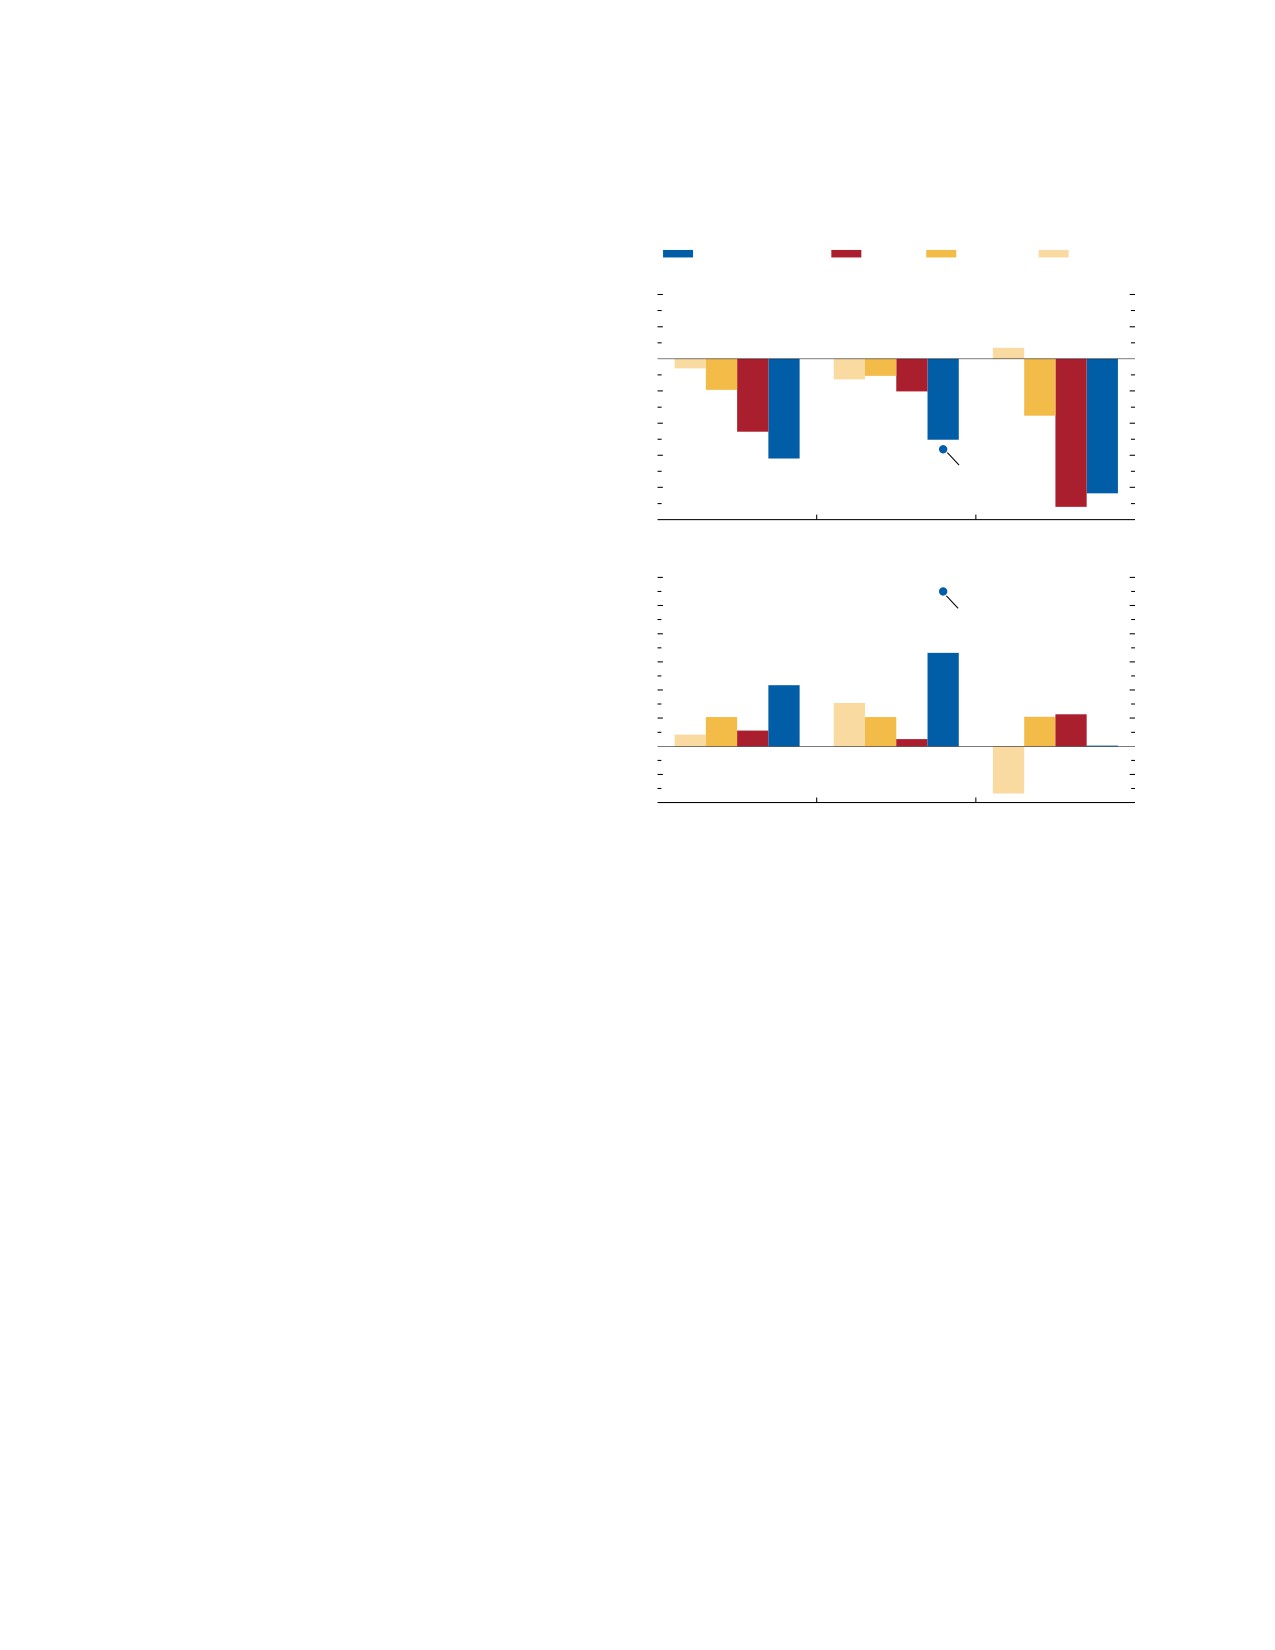
WORLD ECONOMIC OUTLOOK: Navigating Global Divergences
IMF’s Global Macroeconomic Model for the Energy
Figure 3.9. Impact of Fragmentation on Real GDP and
Transition.26 It includes the production, consumption,
Inflation
(Percent deviation from baseline)
and trade of energy from fossil and renewable sources
as well as four minerals critical to the energy transi-
Energy and minerals
Minerals
Natural gas
Crude oil
tion. Commodities include crude oil, coal, natural gas,
copper, nickel, cobalt, and lithium, capturing about
0.2
1. Average Deviation of GDP over First Three Years
70 percent of the value of global commodity trade.
0.1
Fragmentation is modeled as a ban on trading these
0.0
commodities between the two hypothetical blocs,
-0.1
which comprise six different regions.
-0.2
In the model, fragmentation affects activity through
several channels. First, the trade ban induces expenditure
-0.3
Europe
switching and trade diversion. Second, temporary imbal-
-0.4
ances between supply and demand within blocs emerge
-0.5
World
US-Europe+
China-Russia+
until prices adjust to clear markets. Such imbalances
generate swings in commodity prices. Finally, rigidities
1.2
2. Deviation of Inflation in Year One
affect the speed of adjustment of output, use, and trade,
1.0
as well as overall macroeconomic effects.
Europe
0.8
Te output and inflation effects could vary sig-
0.6
nificantly across regions, blocs, and commodities
0.4
(Figure 3.9). Comparison of the impact on individual
0.2
commodities highlights the channels at play. Te effects
0.0
of fragmenting trade in oil and gas would be quite dif-
-0.2
ferent, even though the distribution of oil and gas con-
-0.4
sumption and production would be similar across blocs.
World
US-Europe+
China-Russia+
For oil, countries could quickly switch to trading part-
Sources: British Geological Survey; Food and Agriculture Organization of the United
ners within their bloc, with limited impact on GDP. By
Nations; Gaulier and Zignago (2010); Global Macroeconomic Model for the Energy
contrast, rigidities such as the need for pipelines or other
Transition; Organisation for Economic Co-operation and Development,
structures would constrain natural gas trade diversion,
Inter-Country Input-Output Tables; United States Geological Survey; and IMF staff
calculations.
with more pronounced effects on GDP. GDP would
Note: “Energy” refers to coal, natural gas, and crude oil. Region-level results are
decline and inflation would increase in both blocs.
aggregated to the bloc and world levels using weights based on GDP at
purchasing power parity. The bloc including the countries that voted for Russia’s
In the case of minerals, simulations highlight the
withdrawal from Ukraine in the 2022 UN vote is labeled the “US-Europe+ bloc,”
importance of the geographic distribution of mining
and the remaining countries are included in the “China-Russia+ bloc.”
production and rigidities in scaling up refining capacity.
On the one hand, fragmentation could lead to a steep
rise in prices in the China-Russia+ bloc and sizable
up refining capacity. Tat bloc would also experience a
declines in real GDP. Roughly 80 percent of the supply
GDP decline from mineral market fragmentation.
of the four minerals is mined in the US-Europe+ bloc,
Trade fragmentation of all seven commodities would
and minerals are used intensively in the China-Russia+
be associated with a global GDP loss of about 0.3 per-
bloc’s sizable manufacturing and construction sector. On
cent. However, as in the partial equilibrium and trade
the other hand, the US-Europe+ bloc would not be able
models, sizable differences are observed across and
to benefit from the relative oversupply of minerals at the
within blocs. Te simulated losses would be larger in
mining stage because it would take several years to scale
the China-Russia+ bloc. Within the US-Europe+ bloc,
Europe could experience a sizable impact on inflation
26Te model was first used in Chapter 3 of the October 2022
(as much as 100 basis points or more) and GDP, with
World Economic Outlook. It is augmented here by (1) including
that impact driven mainly by the fragmentation of oil
the possibility of segmenting tradable energy markets and (2)
explicitly modeling two types of mineral aggregates composed
and gas markets.
of copper and nickel as well as cobalt and lithium, respectively.
Several caveats are worth highlighting. Whereas
Te augmented model has six regions: the United States, the
the model provides regional granularity, it masks the
European Union, US-EU-leaning countries, China, Russia, and
China-Russia-leaning countries.
heterogeneity of effects across countries, given the
82
International Monetary Fund | October 2023
CHAPTER 3 Fragmentation and Commodity Markets: Vulnerabilities and Risks
highly concentrated nature of commodity produc-
markets relevant for the green transition (such as oil
tion. Second, modeling and data constraints allow
and natural gas markets) is left to future research.
for the inclusion of only a subset of commodities.
Te analysis uses projected increases in demand for
Tird, the model does not capture the cost from a
key critical minerals in a net-zero-emissions scenario
more volatile inflationary regime, which could make
(IEA 2023), with the projections assuming that policy
monetary policy more difficult. Finally, the model,
incentives stimulate investment in renewable-energy
like the two complementary analyses preceding it, uses
technologies and EVs. It first assumes free commodity
prepandemic data on mineral usage and trade flows.
trade. With policies left unchanged, it then compares
Given the sizable projected increase in demand for
the results with those under a counterfactual scenario
these minerals throughout the green transition, the
of complete mineral market fragmentation across the
macroeconomic relevance of disrupting trade in these
two hypothetical blocs.
commodities will probably be greater—as discussed in
In the integrated-world baseline, the model
the next section.
indicates that world prices of the four key miner-
als considered could rise by about 90 percent, on
average, along the net-zero-emissions-scenario path
Implications for the Clean Energy Transition
to 2030. If critical mineral markets are fragmented,
Fragmentation of commodity markets could affect
the inability of the hypothetical China-Russia+ bloc
the cost of decarbonization. Minerals such as cop-
to import copper, nickel, lithium, and cobalt from
per, nickel, cobalt, and lithium are key inputs for the
countries such as Chile, the Democratic Republic of
energy transition. Tey are used in EVs, in batteries
the Congo, and Indonesia would lead to an addi-
and wiring, and in renewable-energy technologies
tional price increase in that bloc of 300 percent, on
such as solar panels and wind turbines. Demand for
average. Acquiring minerals would be more expensive,
these critical minerals could increase substantially
which would lead to lower investment in solar panels
(IEA 2023), and they could become as important to
and wind turbines and fewer EVs (Figure 3.10). In
the world economy in a net-zero-emissions scenario as
this net zero scenario, there would be about 70 per-
crude oil (Boer, Pescatori, and Stuermer 2023).
cent fewer new EVs in the China-Russia+ bloc in a
Under the scenario of net zero emissions by 2050,
fragmented world than in an integrated world.28
the IEA (2023) projects demand for copper to grow
Fragmentation would cause an oversupply of min-
by a factor of 1.5, that for nickel and cobalt to double,
erals in the hypothetical US-Europe+ bloc. However,
and that for lithium to increase six times by 2030. Tis
the time needed to scale up mineral refining capacity is
could raise prices substantially, as mining and refin-
assumed to constrain the use of minerals in that bloc.
ing are hard to scale up and are highly concentrated
Hence, fragmentation generates only small gains in
geographically (Figure 3.2, panel 1; Online Annex
the US-Europe+ bloc, with a slightly higher number
Figure 3.2.2). For example, Chile and Peru mine more
of EVs produced, but no gains in renewable-energy
than a third of the world’s copper, and Indonesia and
capacity, by 2030.
the Philippines about half its nickel.
On balance, global net investment in renewable
Using the augmented Global Macroeconomic Model
technology and production of EVs would be roughly
for the Energy Transition, this section illustrates the
20 percent lower compared with the baseline because
potential effects of mineral market fragmentation on
of mineral market fragmentation.29 Tis shortfall
energy transition dynamics.27 Te analysis focuses on
minerals because they are key inputs for green technol-
28In the fragmentation scenario, China’s fiscal cost of supporting
ogies. Te study of fragmentation of other commodity
investment in reverting to the net-zero-emissions path would be
1½-2 percent of GDP. Quantifying the impact of fragmentation on
emissions reduction is outside the scope of this chapter.
27Modeling the net effects of fragmentation on innovation and
29Tese findings are robust to assuming that technological progress
government policies in green technologies, in the more efficient
would improve the substitutability of minerals with other inputs.
use of commodities, in substitution, and in extraction technologies
Doubling the elasticity of substitution of the four minerals would
is beyond the scope of this chapter. Tere could be competing
reduce the decline in investment in renewable technology from
long-term effects within and across blocs that are not captured by
20 percent to 12 percent, for instance. Te shortfall in global green
the supply and demand elasticities used in the model (see Acemoglu
investment because of fragmentation would be more muted, how-
2002; Acemoglu and others 2012; Schwerhoff and Stuermer 2020;
ever, if key producers of minerals (Chile, the Democratic Republic of
Hassler, Krusell, and Olovsson 2021; Góes and Bekkers 2022; and
the Congo, Peru) were assigned to the China-Russia+ bloc instead.
Lemoine, forthcoming).
See the exercise on countries switching blocs earlier in the chapter.
International Monetary Fund | October 2023
83
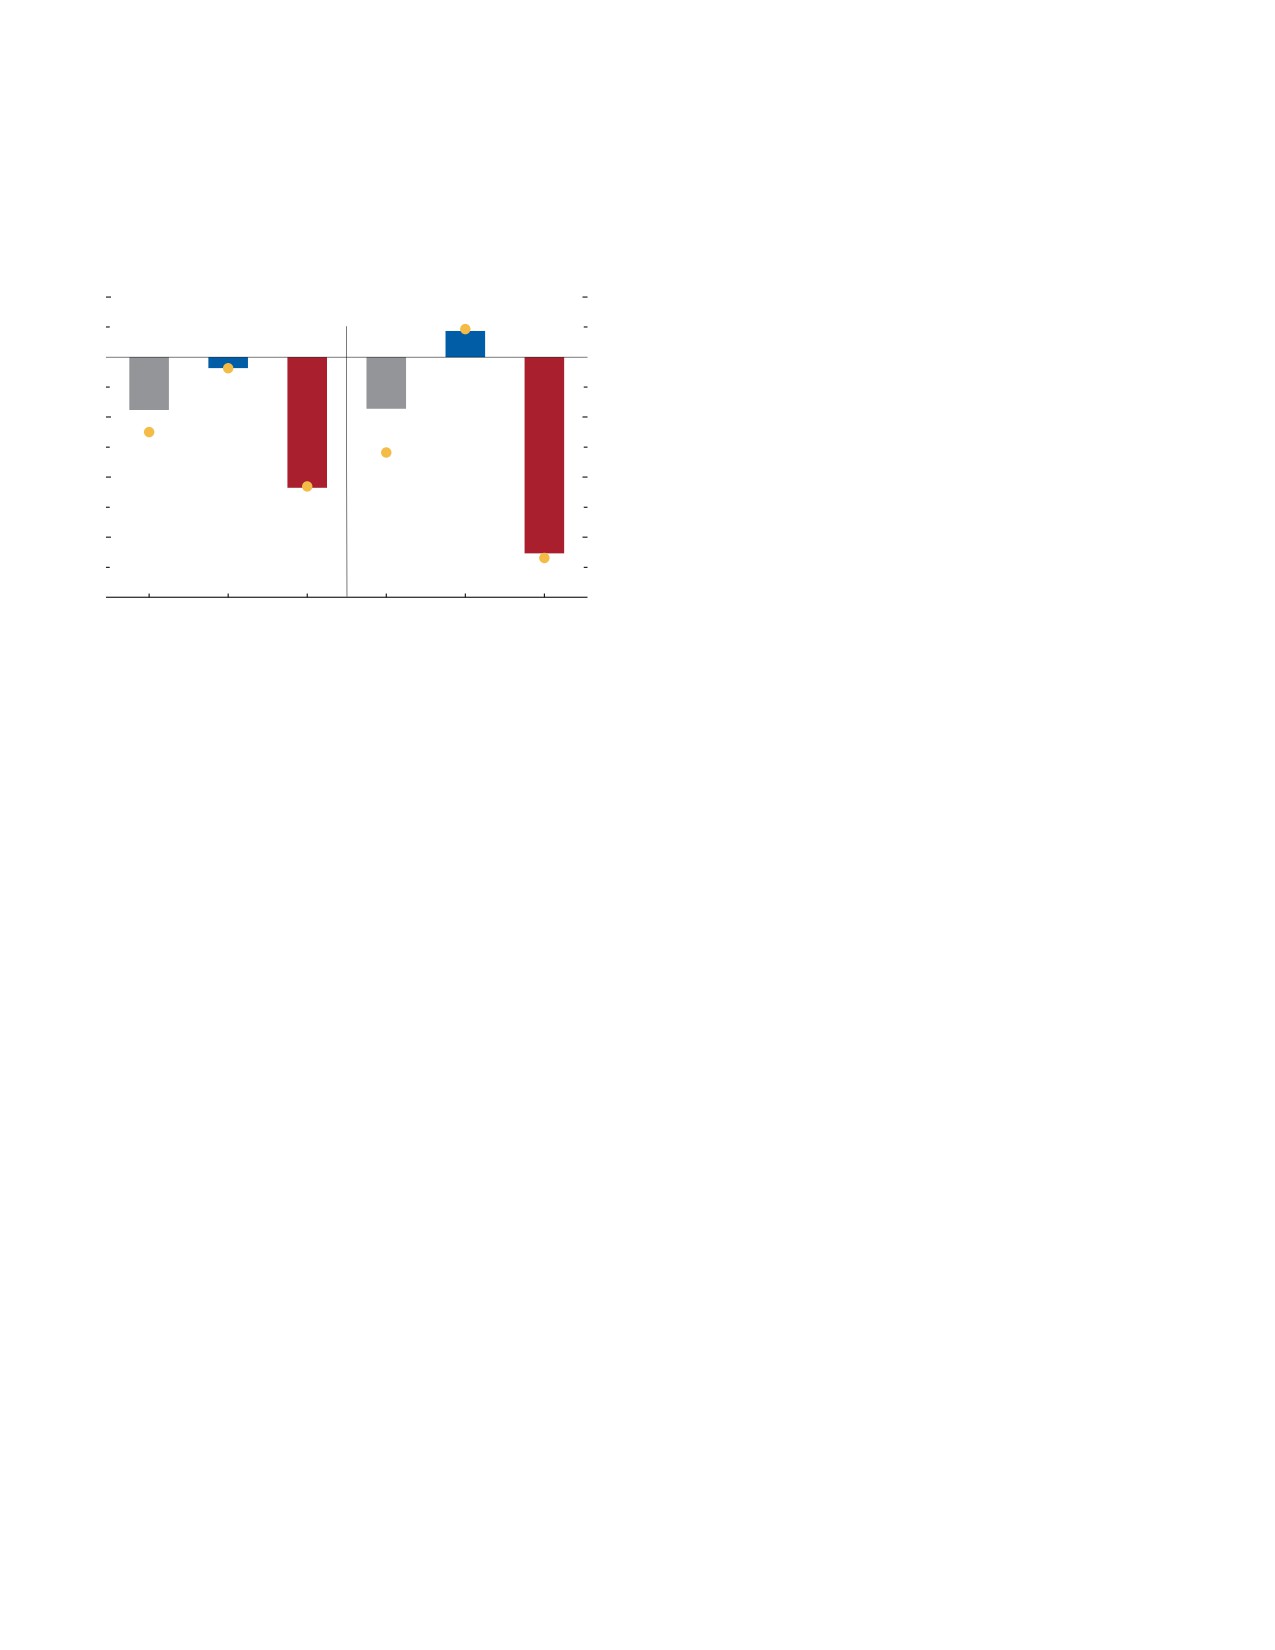
WORLD ECONOMIC OUTLOOK: Navigating Global Divergences
Figure 3.10. Impact of Fragmentation of Critical Mineral
highly concentrated and difficult-to-relocate produc-
Markets on Investment in Renewables and Electric Vehicles,
tion, hard-to-substitute consumption, and critical role
2030
as inputs for manufacturing and key technologies. Frag-
(Percent deviation from net-zero-emissions scenario without
mentation in commodity markets is on the rise. Mea-
fragmentation)
sures restricting commodity trade surged in 2022, price
20
differentials across geographic markets have widened
Investment in renewables
Production of EVs
for selected commodities, and FDI flows in commodity
sectors are in decline—the latter a trend that started
0
before the war in Ukraine.
Illustrative model simulations suggest that more severe
-20
fragmentation could cause large changes in commodity
prices, depending on the resulting supply-and-demand
-40
imbalances and commodities’ elasticities of supply and
demand. Critical minerals for the energy transition and
-60
some highly traded agricultural goods are highly vulner-
able in the event of fragmentation.
-80
A fragmented world would be more volatile. Com-
World
US-
China
World
US-
China-
modity price volatility could intensify as a result of
Europe+
Russia+
Europe+
Russia+
smaller market sizes and the incentives for producers
Sources: British Geological Survey; Gaulier and Zignago (2010); IMF, Global
to switch geopolitical allegiances. Tis could result in
Macroeconomic Model for the Energy Transition; International Energy Agency;
United States Geological Survey; and IMF staff estimates.
volatile inflation dynamics, making monetary policy
Note: The bars and dots in the figure report the change in real investment in
more complex.
renewable energy and the production of EVs in a fragmented world relative to the
Te potential impacts of fragmentation differ vastly
net-zero-emissions path, with demand for cobalt, copper, lithium, and nickel
increasing as projected by the International Energy Agency’s net-zero-emissions
across countries, with offsetting effects across con-
scenario (in an integrated world). Country-level variables are aggregated to the
sumer and producer countries resulting in modest
bloc and world levels using weights based on GDP at purchasing power parity in
the bars and on greenhouse gas emissions in the dots. The bloc including the
output losses at the global level. Low-income coun-
countries that voted for Russia’s withdrawal from Ukraine in the 2022 UN vote is
tries, on average, would experience significantly deeper
labeled the “US-Europe+ bloc,” and the remaining countries are included in the
“China-Russia+ bloc.” EVs = electric vehicles.
long-term output declines. Given the heavy reliance
on agricultural imports among many low-income
countries, fragmentation of agricultural commodities
would increase to about 30 percent if one uses green-
would raise important food security concerns. Illus-
house gas emissions to weigh the regional response
trative model simulations suggest that a hypothetical
of investment in renewables and EVs. Te measure
China-Russia+ bloc could be more affected economi-
accounts for the greater emissions intensity of activity
cally than a US-Europe+ bloc, although the economic
in the China-Russia+ bloc and hence the greater effort
impact would be reduced if commodity trade was only
needed to achieve global emissions mitigation goals.30
partially restricted or there was a nonaligned bloc.
Decarbonizing the world economy would be more
Overall, further fragmentation of commodity markets
difficult if the market for minerals is fragmented.
could deliver an additional blow in an already challeng-
ing environment of slow global growth, tight financial
Summary and Policy Implications
conditions, and high debt, a blow that would be partic-
ularly harsh for some of the most vulnerable economies.
Commodity markets are an important channel
Fragmentation in critical mineral markets could
through which geopolitical fragmentation can affect
make the clean energy transition more costly, raising
the economy. Many features of commodities underpin
the risks of delaying necessary climate change mitiga-
their vulnerability in the event of fragmentation: their
tion. It could add to the upward price pressure in the
mineral-scarce bloc in the chapter’s illustrative model
30Te China-Russia+ bloc accounted for more than half of
greenhouse gas emissions in 2020, but only a third of global
simulation. Te mineral-rich bloc in the simulation
GDP. Hence, global investment losses are significantly larger when
could not reap the benefits from oversupply in the near
bloc-level changes are aggregated using emissions (the yellow dots
term because it would be unable to scale up refining
in Figure 3.10) rather than purchasing-power-parity-weighted GDP
(the bars in Figure 3.10).
and processing capacity quickly. In the simulation,
84
International Monetary Fund | October 2023
CHAPTER 3 Fragmentation and Commodity Markets: Vulnerabilities and Risks
fragmentation results in lower-than-needed global
Second-best solutions can also be considered. Given
investment in renewables and EVs by 2030 by as much
the potentially adverse effects of fragmentation on
as 30 percent.
the energy transition, a minimum “green corridor”
Given these findings, should advanced economies
agreement should be established to preserve integrated
try to keep commodity trade open? Should emerging
markets for minerals that are critical for decarbon-
market and developing economies be concerned about
ization. Safeguarding the flow of these minerals can
the potentially higher cost of the green transition? For
be part of a foundational minimum agreement across
both questions, the answer is yes.
countries. Without underestimation of the political
Even if the simulations suggest that commodity
difficulties, such a corridor agreement could be easier
fragmentation would not result in very deep aggre-
to agree on, because it would focus on a smaller set
gate output losses in a US-Europe+ bloc, the threat
of commodities and countries. Similar “food corri-
of derailing the global green energy transition should
dor” agreements could provide guardrails in essential
give advanced economies pause. With more than half
agricultural commodity markets, ensure equal access to
of worldwide emissions generated by the hypothetical
food across countries of all income levels, and reduce
China-Russia+ bloc, averting climate disaster globally
the likelihood of humanitarian disasters in a world of
hinges on the ability of the economies in that bloc to
more frequent supply shocks.
make a successful and timely clean energy transition.
While many minerals used in clean energy tech-
On the other hand, many low- and medium-income
nologies are bound to become critical for the global
countries, whose main objective is raising living stan-
economy, the paucity of data on their consumption,
dards, may want to think twice, considering the threat
production, and inventories raises uncertainty for
of lower output and higher inflation from commodity
producers and consumers and could hide potential
market fragmentation.
risks for financial markets. In this respect, the interna-
All countries would suffer from the greater volatility
tional community could facilitate the green transition
and uncertainty that fragmented commodity markets
and support energy security by setting up a platform
would bring. A protracted process of fragmentation,
or organization to improve sharing and standardization
driven by complex and hard-to-predict policy measures
of international data on mineral production, consump-
and fluid implementation, would also heighten uncer-
tion, and inventories. Te initiative could be similar to
tainty, depressing private investment and potentially
the Joint Organisations Data Initiative for fossil fuels
diverting scarce public resources toward a suboptimal
and the Agricultural Market Information System for
reshoring of commodity supply.
food commodities.
Preventing fragmentation of commodity markets
Even as policymakers strive to mitigate the risk of
is the first-best response. Multilateral cooperation
fragmentation, countries can take steps to minimize
can provide guardrails and prevent a vicious spiral of
the potential economic fallout. Te geographic con-
countries imposing restrictions as a risk management
centration of production and lack of diversification of
effort to mitigate the economic fallout from frag-
commodity suppliers call for (1) fostering investment
mentation. First-best multilateral solutions include
in domestic mining, exploration, and recycling of
enhanced rules within the World Trade Organization
critical minerals; (2) diversification of supply sources;
on quantitative restrictions, export tariffs, discrimina-
and (3) investing in infrastructure to reduce trade costs
tory subsidies, local-content requirements, and other
and improve market integration. Support for inno-
commodity-related trade measures (see Bown 2023).
vation to speed technological progress—and develop
Tis is crucial for food commodities, as food insecurity
substitutes—would enhance efficiency in the use and
affects a large swath of the population in low-income
buildup of strategic reserves. Multilateral coopera-
countries.31
tion would enhance efficiency and prevent negative
cross-country spillovers.
Broader policies that strengthen countries’ resil-
ience to shocks can help mitigate the effects of
31Giordani, Rocha, and Ruta (2016) show that on top of the
usual distortionary effects, trade-restricting measures for food can
commodity shocks. Tese include strengthening mac-
have multiplier effects. High food prices can trigger export restric-
roeconomic, structural, and fiscal policy frameworks;
tions while importers reduce import tariffs. Tese policies exacerbate
building fiscal and financial buffers; and developing
tensions in world food markets and could generate another round of
trade restrictions.
preparedness plans in case of sudden disruptions in
International Monetary Fund | October 2023
85
WORLD ECONOMIC OUTLOOK: Navigating Global Divergences
commodity supply. Countries should also reinforce
political economy outcomes. “Friend-shoring” policies
social safety nets to protect vulnerable households
can also be market distorting and costly. Both sets of
from higher commodity prices and volatility. Since
policies should be used only under particular condi-
fragmentation in physical commodity markets could
tions, such as in the presence of clear market failures or
exacerbate financial market volatility and result in
narrowly defined national security concerns. Domestic
sharp exchange rate adjustments, policy measures that
and global costs are more limited—and economies
prevent disruptions in commodity-derivatives markets
more resilient to shocks—if restriction-free trade applies
and financial instability may be warranted (April
to larger economic zones. Country-based restrictions
2023 Global Financial Stability Report).
on domestic content are suboptimal, because they can
Industrial policies are only the third-best approach
interfere with price signals, reduce competition, and
and must be designed carefully to ensure equal treat-
therefore lower productivity. Developing a framework
ment of firms across competitive markets to avert
for international consultations on friend-shoring prac-
adverse cross-country spillovers, minimize distortions
tices could help identify negative cross-border spillovers
and inefficiencies, and mitigate fiscal risks and harmful
and mitigate adverse consequences.
86
International Monetary Fund | October 2023
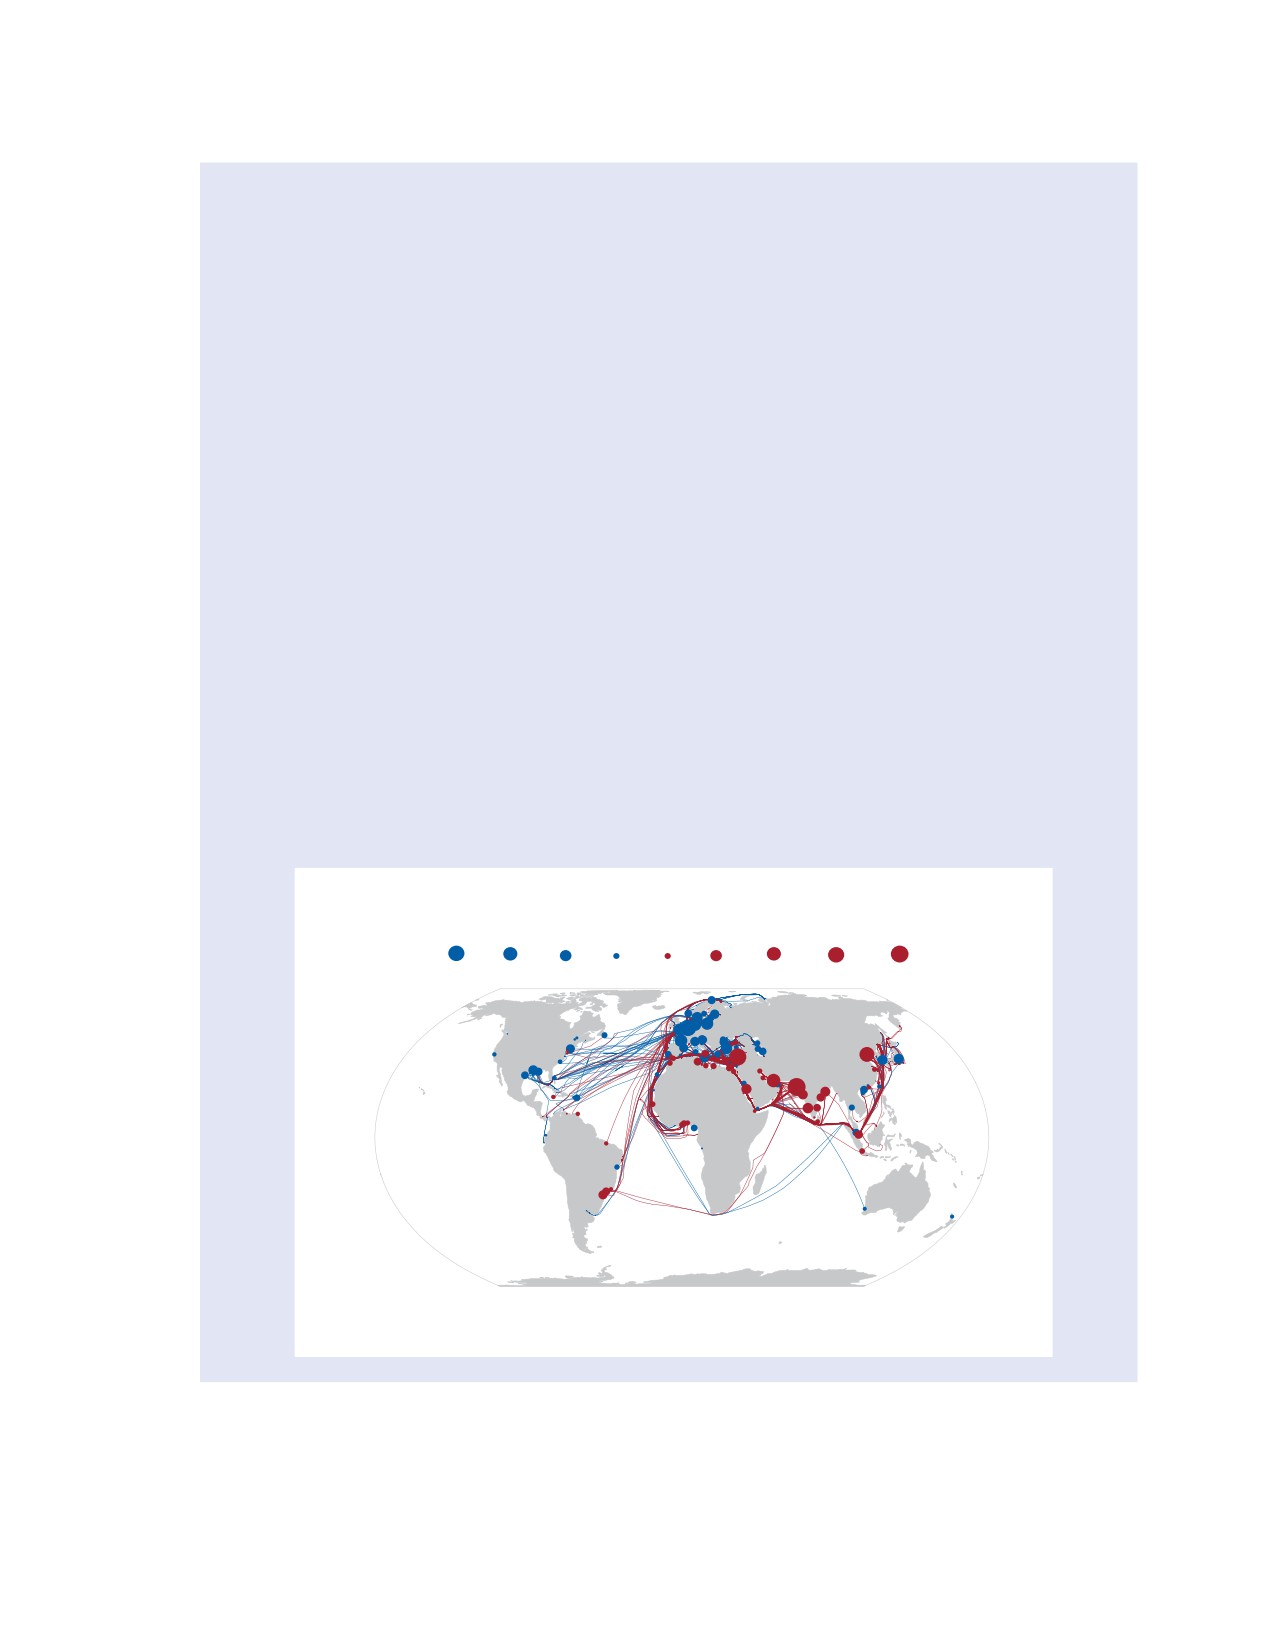
CHAPTER 3 Fragmentation and Commodity Markets: Vulnerabilities and Risks
Box 3.1. Commodity Trade Tensions: Evidence from Tanker Traffic Data
Since its invasion of Ukraine, Russia’s oil exports have
and insurance services to tankers carrying Russian
been subject to sanctions and have been voluntarily
commodities above certain price thresholds.
shunned by firms. What has been the impact on oil
Automatic Identification System data reveal that the
trade flows? Granular real-time data on tanker ship-
traffic patterns of Russia’s tankers have since changed
ping patterns from the Automatic Identification System1
substantially (Figure 3.1.1). Tanker shipments from Rus-
uncover significant shifts in routes, resulting in economic
sian ports to Japan, the United States, and the European
inefficiencies.
Union declined between April-June 2019 and the same
period in 2023. Other countries are also now providing
Te European Union, United Kingdom, and United
oil supplies. For example, the European Union receives
States banned most imports of crude oil and petro-
more shipments from countries such as Norway, the
leum products from Russia after Russia’s invasion of
United Arab Emirates, and the United States, but this
Ukraine. Western restrictions on dollar payments have
extends the length of tanker routes by 20 percent.2
been reported to be a barrier to shipments. Group of
On the flip side, Russian oil shipments rose after the
Seven (G7) members also prohibited transportation
invasion to countries such as China, India, Türkiye,
and the United Arab Emirates. About 35 to 40 per-
cent of India’s crude oil imports came from Russia
Te authors of this box are Seung Mo Choi and Alessandra Sozzi.
during April-June 2023, a stark rise from less than
1Te Automatic Identification System is a mandatory
5 percent before the war in Ukraine. While India’s oil
self-reporting system for all ships above 300 gross tons. It has
exports (mostly petroleum products) are small relative
been used to construct real-time trade indicators (examples are
to its oil imports (mostly crude oil), India increased its
included in Arslanalp, Marini, and Tumbarello 2019; Cer-
oil exports to the European Union substantially.
deiro and others 2020; and Arslanalp, Koepke, and Verschuur
2021). PortWatch (https://www.imf.org/portwatch) is an online
platform that monitors trade disruptions and assesses spillovers
2UNCTAD (2022) documents a rise in tanker freight rates
through port-to-port links.
following the Russian invasion of Ukraine.
Figure 3.1.1. Changes in Tanker Shipments from Russia’s Ports from 2019:Q2 to 2023:Q2
(Metric tons, decreases in blue and increases in red)
-2.5M
-1.5M
-750K -100K
100K
750K
1.5M
2.5M
3.5M
Sources: Natural Earth; UN Global Platform; and IMF staff calculations.
Note: The bubble size indicates the magnitude of the change for the destination port. Lines indicate travel routes.
International Monetary Fund | October 2023
87
WORLD ECONOMIC OUTLOOK: Navigating Global Divergences
Box 3.2. Commodity Market Fragmentation in History: Many Shades of Gray
History points to a fluid range of experiences of fragmen-
facilitate this exchange (Farchy and Blas 2021). Politi-
tation in commodity markets: from full trade disruption
cal considerations also dominated trade. For example,
during World War II, to limited and controlled trade
after the Soviet invasion of Afghanistan, US President
during the Cold War, to trade embargoes and other export
Jimmy Carter imposed a partial embargo on US grain
restrictions. Fragmentation has rarely lasted, given com-
exports to the Soviet Union.3 Te embargo, however,
modities’ fungibility and arbitrage opportunities.
was ineffective due to the global nature of grain mar-
kets. While Soviet imports of US wheat fell sharply,
During World War II, trade among the
they were replaced by imports from other countries,
three major blocs—German-controlled Europe,
especially Argentina (Oki 2008).
Japanese-controlled Asia, and the rest of the world
Commodity market embargoes have often been
(the Allies)—stopped (Findlay and O’Rourke 2007).1
used to apply political pressure. Te Arab members of
Some blocs faced commodity shortages: for example,
the Organization of the Petroleum Exporting Coun-
shortages of crude oil (produced mostly by the Allies)
tries (OPEC) initiated an export embargo against the
in Germany and Japan and of natural rubber (pro-
United States and other countries in 1973 during the
duced mostly by Japan) in the Allies (Tuttle 1981). In
Arab-Israeli war and announced a 25 percent cut in
both cases, governments worked with firms to alleviate
output. Oil prices more than quadrupled between Sep-
shortages. Germany developed a coal-based synthetic
tember 1973 and January 1974. Te oil market was
fuel industry. By 1940, the fuel it produced accounted
significantly disrupted; however, the disruption was
for nearly half of Germany’s oil supply and 95 percent
short-lived, as traders diverted oil to embargoed coun-
of its aviation fuel (Painter 2012). Te US government
tries and production from non-OPEC countries rose
stockpiled natural rubber and worked with industry to
(McNally 2017). Importers also took steps to reduce
develop synthetic rubber (ACS 1998).
vulnerability, for example, by mandating efficiency
During the Cold War, trade between the US-led
improvements and creating strategic oil inventories
and the Soviet Union-led blocs was limited as a result
(Baffes and Nagle 2022).
of the Soviet strategy of self-sufficiency.2 Te Soviet
Another embargo example is that of South Africa
Union traded crude oil, natural gas, and some metals
during apartheid. Several governments implemented
for manufactured and agricultural goods, especially
wide-ranging bans on exports to South Africa, partic-
wheat. Traders often skirted government policies to
ularly crude oil. However, sanctions were blunted by
traders who were willing to risk violating sanctions
Te author of this box is Peter Nagle.
to supply oil at high prices (Farchy and Blas 2021).
1Trade between blocs and neutral countries was affected by
Overall, the historical examples showcase the ability of
the war. For example, the United Kingdom and United States
fungible commodities to find their way from produc-
bought much of the Spanish tungsten output to raise its price
ers to consumers, absent near-absolute trade barriers.
and limit availability for Germany. Between 1941 and 1943, the
price of tungsten rose 13-fold (Caruana and Rockoff 2001).
2East-West trade was sharply reduced by the Cold War, from
3In 1980, the Soviet Union planned to import 35 million
three-quarters of trade by the East in 1938 to 14 percent in
metric tons of grain—25 million of that from the United States.
1953. In contrast, within-bloc trade and interdependence rose
It ended up importing only 8 million tons, committed to under
(Spulber and Gehrels 1958; Foreman-Peck 1995).
a previous treaty (JEC 1980).
88
International Monetary Fund | October 2023
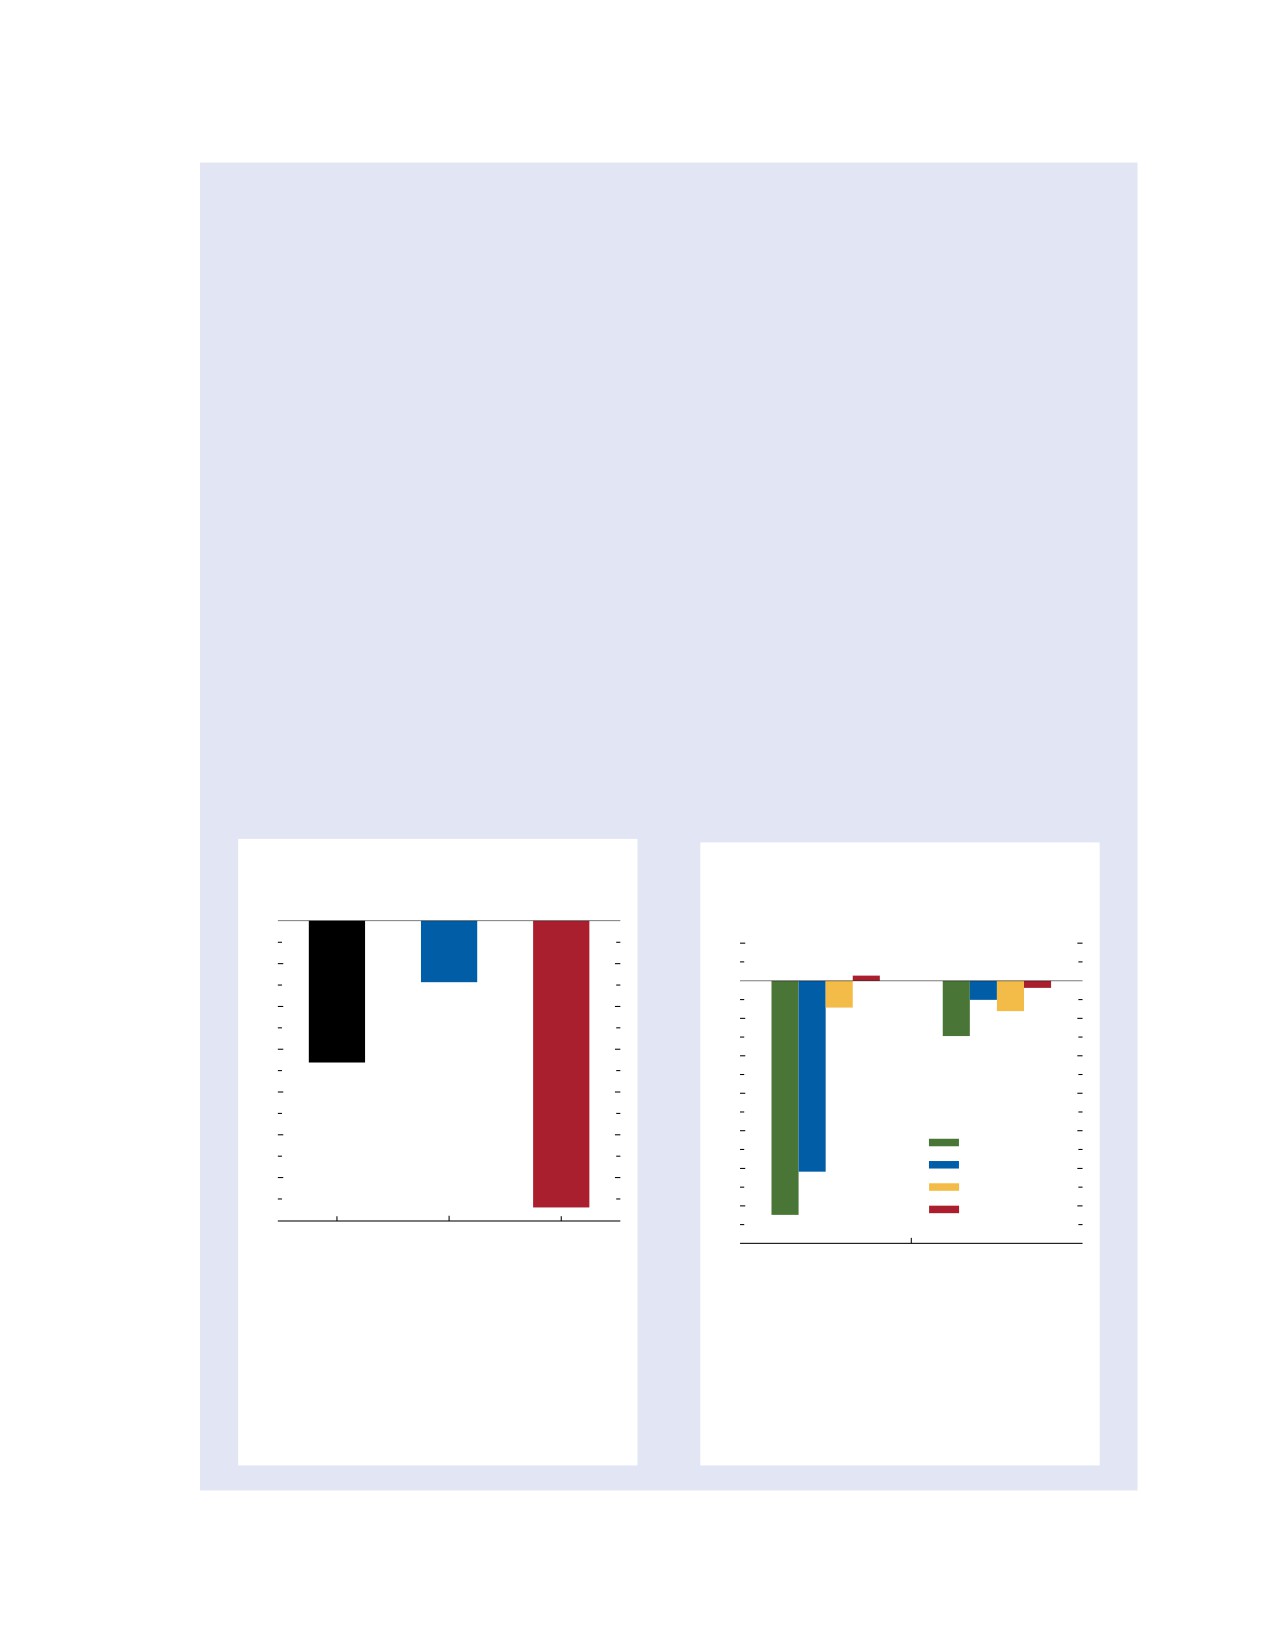
CHAPTER 3 Fragmentation and Commodity Markets: Vulnerabilities and Risks
Box 3.3. The Uneven Economic Effects of Commodity Market Fragmentation
Fragmentation of commodity markets affects countries
elasticity of substitution between commodities and
and households differently. This box demonstrates that
other inputs in the production of manufactured goods.
low-income countries are more vulnerable in the event
Trade costs are set such that there is no commodity
of fragmentation, especially of agricultural commodities,
trade between blocs.
owing to their greater reliance on food imports. The find-
Results show that the aggregate impact of commod-
ing raises important food security concerns should further
ity fragmentation would be moderate, with a global
fragmentation materialize.
GDP loss of 0.3 percent (Figure 3.3.1). However,
there would be large differences within and across
To quantify the impact on long-term GDP of
blocs. Some economies might benefit from trade diver-
fragmentating trade in multiple commodities simul-
sion as competitors lose access to export markets. Most
taneously, a multicountry, multisector trade model is
would experience permanent output declines. Losses
used in this box, following Caliendo and Parro (2015).
would be larger in countries where commodity trade
Bolhuis, Chen, and Kett (2023) augment the model
with the other bloc was significant. Te China-Russia+
to account for trade and production of 133 commod-
bloc and low-income countries—whose economies are
ities across 145 countries. Labor is the only factor of
more commodity-intensive—would lose more.
production, and productivity is exogenous. Commod-
Low-income countries’ high dependence on imports
ities are used as intermediate inputs, with a long-term
of agricultural goods would make them particularly
supply elasticity of 1. Te model accounts for the
vulnerable (Figure 3.3.2). Disrupting trade in food
input-output structure of global trade and assumes low
commodities alone would lead to losses of 1 percent of
GDP. Commodity fragmentation could also have high
social and humanitarian costs and would be partic-
Te authors of this box are Marijn Bolhuis, Jiaqian Chen,
ularly harmful for lower-income households, which
and Benjamin Kett. See Bolhuis, Chen, and Kett (2023) for
further details.
spend a large share of their incomes on food and fuel.
Figure 3.3.1. Estimated Output Losses
Figure 3.3.2. Estimated GDP Losses in
(Percent deviation from baseline)
Low-Income Countries and Others
(Percent deviation from baseline)
0.0
0.2
-0.1
0.0
-0.2
-0.2
-0.3
-0.4
-0.4
-0.6
-0.5
-0.8
All commodities
-1.0
Agriculture
-0.6
Energy
-1.2
Minerals
–0.7
Global
US-Europe+
China-Russia+
-1.4
All commodities
Low-income countries
Others
Sources: British Geological Survey; Eora Global Supply Chain
Sources: British Geological Survey; Eora Global Supply Chain
database; Food and Agriculture Organization of the United
database; Food and Agriculture Organization of the United
Nations; Gaulier and Zignago (2010); US Geological Survey;
Nations; Gaulier and Zignago (2010); US Geological Survey;
and IMF staff calculations.
and IMF staff calculations.
Note: The bars represent the losses in GDP relative to
Note: The bars represent the losses in GDP relative to
baseline from eliminating trade in commodities across
baseline from eliminating trade in groups of commodities
hypothetical blocs. Country-level losses are aggregated
across hypothetical blocs. Country-level losses are
using weights based on GDP at purchasing power parity. For
aggregated using weights based on GDP at purchasing
details, see Bolhuis, Chen, and Kett (2023).
power parity. For details, see Bolhuis, Chen, and Kett (2023).
International Monetary Fund | October 2023
89
WORLD ECONOMIC OUTLOOK: Navigating Global Divergences
References
.oup.com/jeea/advance-article-abstract/doi/10.1093/jeea/
Acemoglu, Daron. 2002. “Directed Technological Change.”
jvad039/7198110.
Review of Economic Studies 69: 781-809.
Bolhuis, Marijn, Jack Chen, and Ben Kett. 2023. “Fragmen-
Acemoglu, Daron, Philippe Aghion, Leonardo Bursztyn, and
tation in Global Trade: Accounting for Commodities.”
David Hemous. 2012. “Te Environment and Directed Tech-
IMF Working Paper 23/73, International Monetary Fund,
nical Change.” American Economic Review 102 (1): 131-66.
Washington, DC.
Aiyar, Shekhar, Jiaqian Chen, Christian Ebeke, Roberto
Bown, Chad. 2023. “Te Challenge of Export Controls.”
Garcia-Saltos, Tryggvi Gudmundsson, Anna Ilyina, Alvar
Finance & Development (June): 18-21.
Kangur, and others. 2023. “Geoeconomic Fragmentation and
Burke, Marshall, and Eoin McGuirk. 2020. “Te Economic
the Future of Multilateralism.” IMF Staff Discussion Note
Origins of Conflict in Africa.” Journal of Political Economy
23/001, International Monetary Fund, Washington, DC.
128 (10): 3940-97.
Albrizio, Silvia, John Bluedorn, Christoffer Koch, Andrea
Caldara, Dario, and Matteo Iacoviello. 2022. “Measur-
Pescatori, and Martin Stuermer. 2023. “Sectoral Shocks and
ing Geopolitical Risk.” American Economic Review 112
the Role of Market Integration: Te Role of Natural Gas.”
(4): 1194-225.
American Economic Review Papers and Proceedings 113: 43-46.
Caliendo, Lorenzo, and Fernando Parro. 2015. “Estimates of the
Alvarez, Jorge, Alexandre Balduino Sollaci, Mehdi Benatiya
Trade and Welfare Effects of NAFTA.” Review of Economic
Andaloussi, Chiara Maggi, Martin Stuermer, and Petia
Studies 82 (1): 1-44.
Topalova. 2023. “Geoeconomic Fragmentation and Com-
Carter, Colin, Gordon Rausser, and Aaron Smith. 2011.
modity Markets.” IMF Working Paper 23/201, International
“Commodity Booms and Busts.” Annual Review of Resource
Monetary Fund, Washington, DC.
Economics 3: 87-118.
American Chemical Society (ACS). 1998. “United States Syn-
Caruana, Leonard, and Hugh Rockoff. 2001. “A Wolfram
thetic Rubber Program, 1939-1945.” American Chemical
in Sheep’s Clothing: U.S. Economic Warfare in Spain,
Society Division of the History of Chemistry and the Office
1940-1944.” NBER Historical Paper 132, National Bureau
of Communications, Washington, DC.
of Economic Research, Cambridge, MA.
Antràs, Pol, Davin Chor, Tibault Fally, and Russell Hillberry.
Cavalcanti, Tiago V. de V., Kamiar Mohaddes, and Mehdi
2012. “Measuring the Upstreamness of Production and Trade
Raissi. 2015. “Commodity Price Volatility and the Sources of
Flows.” American Economic Review Papers and Proceedings 102
Growth.” Journal of Applied Econometrics 30: 857-73.
(3): 412-16.
Cerdeiro, Diego A., Johannes Eugster, Rui C. Mano, Dirk Muir,
Arezki, Rabah, Frederick van der Ploeg, and Frederik Toscani.
and Shanaka J. Peiris. 2021. “Sizing Up the Effects of Tech-
2019. “Te Shifting Natural Wealth of Nations: Te Role
nological Decoupling.” IMF Working Paper 21/69, Interna-
of Market Orientation,” Journal of Development Economics
tional Monetary Fund, Washington, DC.
138: 228-45.
Cerdeiro, Diego, Andras Komaromi, Yang Liu, and Mamoon
Arndt, Sven, and Henryk Kierzkowski, eds. 2000. Fragmentation:
Saeed. 2020. “World Seaborne Trade in Real Time: A Proof
New Production Patterns in the Global Economy. New York, NY:
of Concept for Building AIS-Based Nowcasts from Scratch.”
Oxford University Press.
IMF Working Paper 20/57, International Monetary Fund,
Arslanalp, Serkan, Robin Koepke, and Jasper Verschuur. 2021.
Washington, DC.
“Tracking Trade from Space: An Application to Pacific Island
Dahl, Carol. 2020. “Mineral Elasticity of Demand and Supply
Countries.” IMF Working Paper 21/225, International Mone-
Database.” Working Paper 2020-2, Colorado School of
tary Fund, Washington, DC.
Mines, Golden, CO.
Arslanalp, Serkan, Marco Marini, and Patrizia Tumbarello. 2019.
Deardorff, Alan V. 2001. “Fragmentation in Simple Trade
“Big Data on Vessel Traffic: Nowcasting Trade Flows in Real
Models.” North American Journal of Economics and Finance 12
Time.” IMF Working Paper 19/275, International Monetary
(2): 121-37.
Fund, Washington, DC.
Fally, Tibault, and James Sayre. 2018. “Commodity Trade
Attinasi, Maria Grazia, Lukas Boeckelmann, and Baptiste
Matters.” NBER Working Paper 24965, National Bureau of
Meunier. 2023. “Friend-Shoring Global Value Chains: A
Economic Research, Cambridge, MA.
Model-Based Assessment.” European Central Bank Economic
Farchy, Jack, and Javier Blas. 2021. Te World for Sale: Money,
Bulletin 2, European Central Bank, Frankfurt.
Power, and the Traders Who Barter the Earth’s Resources.
Baffes, John, and Peter Nagle. 2022. Commodity Markets: Evolu-
New York, NY: Oxford University Press.
tion, Challenges, and Policies. Washington, DC: World Bank.
Felbermayr, Gabriel, Hendrik Mahlkow, and Alexander
Boer, Lukas, Andrea Pescatori, and Martin Stuermer. 2023.
Sandkamp. 2022. “Cutting through the Value Chain: Te
“Energy Transition Metals: Bottleneck for Net-Zero
Long-Run Effects of Decoupling the East from the West.”
Emissions?” Journal of the European Economic Association.
Kiel Working Paper 2210, Kiel Institute for the World Econ-
Published ahead of print, June 14, 2023. https://academic
omy, Kiel, Germany.
90
International Monetary Fund | October 2023
CHAPTER 3 Fragmentation and Commodity Markets: Vulnerabilities and Risks
Feyrer, James. 2019. “Trade and Income—Exploiting Time
Irwin, Douglas. 2019. “Does Trade Reform Promote Economic
Series in Geography.” American Economic Journal: Applied
Growth: A Review of Recent Evidence.” NBER Working
Economics 11(4): 1-35.
Paper 25927, National Bureau of Economic Research,
Feyrer, James. 2021. “Distance, Trade, and Income—Te 1967
Cambridge, MA.
to 1975 Closing of the Suez Canal as a Natural Experiment.”
Jaakkola, Niko, Daniel Spiro, and Arthur A. Van Benthem.
Journal of Development Economics 153: 102708.
2019. “Finders, Keepers?” Journal of Public Econom-
Financial Stability Board (FSB). 2023. “Te Financial Stability
ics 169: 17-33.
Aspects of Commodities Markets.” Report to the G20, Finan-
Jacks, David, Kevin O’Rourke, and Jeffrey Williamson. 2011.
cial Stability Board, Basel.
“Commodity Price Volatility and World Market Integration.”
Findlay, Ronald, and Kevin O’Rourke. 2007. Power and Plenty:
Review of Economics and Statistics 93 (3): 800-13.
Trade, War, and the World Economy in the Second Millennium.
Jakubik, Adam, and Michele Ruta. 2023. “Trading with Friends
Princeton, NJ: Princeton University Press.
in Uncertain Times.” IMF Working Paper 23/124, Interna-
Foreman-Peck, James. 1995. A History of the World Economy:
tional Monetary Fund, Washington, DC.
International Economic Relations since 1850. New York, NY:
Javorcik, Beata, Lucas Kitzmueller, Helena Schweiger, and Ali
Harvester Wheatsheaf.
Yildirim. 2022. “Economic Costs of Friend-Shoring.” EBRD
Gaulier, Guillaume, and Soledad Zignago. 2010. “BACI:
Working Paper 274, European Bank for Reconstruction and
International Trade Database at the Product-Level; Te
Development, London.
1994-2007 Version.” CEPII Working Paper 2010-23,
Joint Economic Committee (JEC). 1980. “Te Impact of the
Centre d’Études Prospectives et d’Informations
Soviet Grain Embargo on Rail and Barge Transportation.”
Internationales, Paris.
Hearing before the Subcommittee on Economic Growth and
Giordani, Paolo, Nadia Rocha, and Michele Ruta. 2016. “Food
Stabilization of the Joint Economic Committee, Congress of
Prices and the Multiplier Effect of Trade Policy.” Journal of
the United States, Washington, DC.
International Economics 101: 102-22.
Kelley, Colin P., Shahrzad Mohtadi, Mark A. Cane, and
Góes, Carlos, and Eddy Bekkers. 2022. “Te Impact of Geo-
Yochanan Kushnir. 2015. “Climate Change in the Fertile
political Conflicts on Trade, Growth, and Innovation.” Staff
Crescent and Implications of the Recent Syrian Drought.”
Working Paper ERSD-2022-09, Economic Research and
Proceedings of the National Academy of Sciences of the United
Statistics Division, World Trade Organization, Geneva.
States of America 112: 3241-46.
Goldberg, Pinelopi, and Tristan Reed. 2023. “Is the Global
Leeds, Brett Ashley, Jeffrey M. Ritter, Sara McLaughlin Mitchell,
Economy Deglobalizing? And If So, Why? And What Is
and Andrew G. Long. 2002. “Alliance Treaty Obliga-
Next?” Paper presented at the Brookings Papers on Economic
tions and Provisions, 1815-1944.” International Interac-
Activity conference, Brookings Institution, Washington,
tions 28: 237-60.
DC, March 31.
Lemoine, Derek. Forthcoming. “Innovation-Led Transitions in
Gustafson, Robert. 1958. “Implications of Recent Research
Energy Supply.” American Economic Journal: Macroeconomics.
on Optimal Storage Rules.” Journal of Farm Economics
Leruth, Luc, Adnan Mazarei, Pierre Régibeau, and Luc Renne-
40: 290-300.
boog. 2022. “Green Energy Depends on Critical Minerals:
Hakobyan, Shushanik, Sergii Meleshchuk, and Robert Zymek.
Who Controls the Supply Chains?” PIIE Working Paper
2023. “Divided We Fall: Differential Exposure to Geopolit-
22-12, Peterson Institute for International Economics,
ical Fragmentation and Trade.” Unpublished, International
Washington, DC.
Monetary Fund, Washington, DC.
McNally, Robert. 2017. Crude Volatility: Te History and the
Hassan, Tarek, Stephan Hollander, Laurence van Lent, and
Future of Boom-Bust Oil Prices. New York, NY: Center on
Ahmed Tahoun. 2019. “Firm-Level Political Risk: Mea-
Global Energy Policy.
surement and Effects.” Quarterly Journal of Economics 134
Missirian, Anouch, and Wolfram Schlenker. 2017. “Asy-
(4): 2135-202.
lum Applications Respond to Temperature Fluctuations.”
Hassler, John, Per Krusell, and Conny Olovsson.
Science 358 (6370): 1610-14.
2021. “Directed Technical Change as a Response to
Oki, Kazuhisa. 2008. “U.S. Food Export Controls Policy:
Natural-Resource Scarcity.” Journal of Political Economy 129
Tree Cases from 1973 to 1981.” USJP Occasional Paper
(11): 3039-72.
08-13, Program on US-Japan Relations, Harvard University,
International Energy Agency (IEA). 2021. Te Role of Minerals
Cambridge, MA.
in the Clean Energy Transition. Paris: IEA.
Painter, David. 2012. “Oil and the American Century.” Journal
International Energy Agency (IEA). 2023. Critical Minerals
of American History 99 (1): 24-39.
Market Review 2023. Paris: IEA.
Schwerhoff, Gregor, and Martin Stuermer. 2020.
International Monetary Fund (IMF). 2023. “G20 Background
“Non-renewable Resources, Extraction Technology and
Note on the Macroeconomic Impact of Food and Energy
Endogenous Growth.” Dallas Federal Reserve Working Paper
Insecurity.” International Monetary Fund, Washington, DC.
1506, Dallas Federal Reserve, Dallas, TX.
International Monetary Fund | October 2023
91
WORLD ECONOMIC OUTLOOK: Navigating Global Divergences
Signorino, Curtis S., and Jeffrey M. Ritter. 1999. “Tau-b or Not
United Nations Conference on Trade and Development (UNC-
Tau-b: Measuring the Similarity of Foreign Policy Posi-
TAD). 2022. Review of Marine Transport: Navigating Stormy
tions.” International Studies Quarterly 43 (1): 115-44.
Waters. Geneva: UNCTAD.
Spulber, Nicolas, and Franz Gehrels. 1958. “Te Operation of
United States Geological Survey (USGS). 2023. Mineral Com-
Trade within the Soviet Bloc.” Review of Economics and Statis-
modities Summaries 2023. Reston, VA: USGS.
tics 40 (2): 140-48.
Williams, John. 1936. “Speculation and Carryover.” Quarterly
Tuttle, William. 1981. “Te Birth of an Industry: Te Synthetic
Journal of Economics 50 (3): 436-55.
Rubber ‘Mess’ in World War II.” Technology and Culture
Wright, Brian, and Jeffrey Williams. 1982. “Te Economic Role of
22 (1): 35-67.
Commodity Storage.” Economic Journal 92 (367): 596-614.
92
International Monetary Fund | October 2023
STATISTICAL APPENDIX
he Statistical Appendix presents historical
conversion rates1 of 1.088 and 1.094, and yen-
data as well as projections. It comprises
US dollar conversion rates of 139.1 and 143.1,
eight sections: Assumptions, What’s
respectively.
It is assumed that the price of oil will average $80.49
T
New, Data and Conventions, Country
a barrel in 2023 and $79.92 a barrel in 2024.
Notes, Classification of Countries, General Features
National authorities’ established policies are assumed
and Composition of Groups in the World Economic
to be maintained. Box A1 describes the more specific
Outlook Classification, Key Data Documentation, and
policy assumptions underlying the projections for
Statistical Tables.
selected economies.
Te first section summarizes the assump-
With regard to interest rates, it is assumed that the
tions underlying the estimates and projections for
three-month government bond yield for the United States
2023-24. Te second section briefly describes the
will average 5.3 percent in 2023 and 5.4 percent in
changes to the database and statistical tables since
2024, that for the euro area will average 3.0 percent
the April 2023 World Economic Outlook (WEO). Te
in 2023 and 3.2 percent in 2024, and that for Japan
third section offers a general description of the data
will average -0.2 percent in 2023 and -0.1 percent in
and the conventions used for calculating coun-
2024. Further it is assumed that the 10-year govern-
ment bond yield for the United States will average
try group composites. Te fourth section presents
3.8 percent in 2023 and 4.0 percent in 2024, that for
selected key information for each country. Te fifth
the euro area will average 2.4 percent in 2023 and
section summarizes the classification of countries in
2.6 percent in 2024, and that for Japan will average
the various groups presented in the WEO, and the
0.5 percent in 2023 and 0.6 percent in 2024.
sixth section explains that classification in further
detail. Te seventh section provides information on
methods and reporting standards for the member
What’s New
countries’ national account and government finance
• Ecuador’s fiscal sector projections, which were previ-
indicators included in the report.
ously omitted due to ongoing program discussions,
Te last, and main, section comprises the sta-
are now included.
tistical tables. Statistical Appendix A is included
• Eritrea’s data and projections for 2020-28 are excluded
here; Statistical Appendix B is available online at
from the database due to constraints in data reporting.
• Sri Lanka’s projections for 2023-28 are excluded
Data in these tables have been compiled on the
from publication owing to ongoing discussions on
basis of information available through September 25,
sovereign debt restructuring.
2023. Te figures for 2023-24 are shown with the
• Ukraine’s projections for 2024-28, in line with the
same degree of precision as the historical figures solely
program’s baseline scenario, are now included.
for convenience; because they are projections, the same
• For West Bank and Gaza, certain projections for
degree of accuracy is not to be inferred.
2022-28 are excluded from publication pending
methodological adjustments to statistical series.
Assumptions
1 In regard to the introduction of the euro, on December 31,
Real effective exchange rates for the advanced
1998, the Council of the European Union decided that, effective
economies are assumed to remain constant at their
January 1, 1999, the irrevocably fixed conversion rates between the
euro and currencies of the member countries adopting the euro are
average levels measured during July 25, 2023-
as described in Box 5.4 of the October 1998 WEO. See that box
August 22, 2023. For 2023 and 2024 these assump-
as well for details on how the conversion rates were established. For
tions imply average US dollar-special drawing right
the most recent table of fixed conversion rates, see the Statistical
conversion rates of 1.340 and 1.340, US dollar-euro
Appendix of the April 2023 WEO.
International Monetary Fund | October 2023
93
WORLD ECONOMIC OUTLOOK: NAVIGATING GLOBAL DIVERGENCES
Data and Conventions
2014, as a result of data limitations or specific country
circumstances, these data can sometimes deviate from
Data and projections for 196 economies form the
the formal definitions. Although every effort is made to
statistical basis of the WEO database. Te data are
ensure the WEO data are relevant and internationally
maintained jointly by the IMF’s Research Department
comparable, differences in both sectoral and instru-
and regional departments, with the latter regularly
ment coverage mean that the data are not universally
updating country projections based on consistent
comparable. As more information becomes available,
global assumptions.
changes in either data sources or instrument coverage
Although national statistical agencies are the
can give rise to data revisions that are sometimes sub-
ultimate providers of historical data and definitions,
stantial. For clarification on the deviations in sectoral
international organizations are also involved in statisti-
or instrument coverage, please refer to the metadata for
cal issues, with the objective of harmonizing meth-
the online WEO database.
odologies for the compilation of national statistics,
Composite data for country groups in the WEO are
including analytical frameworks, concepts, definitions,
either sums or weighted averages of data for individual
classifications, and valuation procedures used in the
countries. Unless noted otherwise, multiyear averages
production of economic statistics. Te WEO database
of growth rates are expressed as compound annual rates
reflects information from both national source agencies
of change.3 Arithmetically weighted averages are used
and international organizations.
for all data for the emerging market and developing
Most countries’ macroeconomic data as presented
economies group—except data on inflation and money
in the WEO conform broadly to the 2008 version
growth, for which geometric averages are used. Te
of the System of National Accounts (SNA 2008). Te
following conventions apply:
IMF’s sector statistical standards—the sixth edition of
Country group composites for exchange rates, inter-
the Balance of Payments and International Investment
est rates, and growth rates of monetary aggregates are
Position Manual (BPM6), the Monetary and Finan-
weighted by GDP converted to US dollars at market
cial Statistics Manual and Compilation Guide, and the
exchange rates (averaged over the preceding three
Government Finance Statistics Manual 2014 (GFSM
years) as a share of group GDP.
2014)—have been aligned with the SNA 2008. Tese
Composites for other data relating to the domestic
standards reflect the IMF’s special interest in countries’
economy, whether growth rates or ratios, are weighted
external positions, monetary developments, financial
by GDP valued at purchasing power parity as a share
sector stability, and public sector fiscal positions. Te
of total world or group GDP.4 For the aggregation of
process of adapting country data to the new standards
world and advanced economies (and subgroups) infla-
begins in earnest when the manuals are released. How-
tion, annual rates are simple percentage changes from
ever, full concordance with the manuals is ultimately
the previous years; for the aggregation of emerging
dependent on the provision by national statistical
market and developing economies (and subgroups)
compilers of revised country data; hence, the WEO
inflation, annual rates are based on logarithmic
estimates are only partly adapted to these manuals.
differences.
Nonetheless, for many countries, conversion to the
Composites for real GDP per capita in purchasing-
updated standards will have only a small impact on
power-parity terms are sums of individual country data
major balances and aggregates. Many other countries
have partially adopted the latest standards and will
3 Averages for real GDP, inflation, GDP per capita, and com-
continue implementation over a number of years.2
modity prices are calculated based on the compound annual rate of
Te fiscal gross and net debt data reported in the
change, except in the case of the unemployment rate, which is based
WEO are drawn from official data sources and IMF
on the simple arithmetic average.
4 See Box 1.1 of the October 2020 WEO for a summary of the
staff estimates. While attempts are made to align gross
revised purchasing-power-parity-based weights as well as “Revised
and net debt data with the definitions in the GFSM
Purchasing Power Parity Weights” in the July 2014 WEO Update,
Appendix 1.1 of the April 2008 WEO, Box A2 of the April 2004
2 Many countries are implementing the SNA 2008 or European
WEO, Box A1 of the May 2000 WEO, and Annex IV of the May
System of National and Regional Accounts 2010, and a few coun-
1993 WEO. See also Anne-Marie Gulde and Marianne Schulze-
tries use versions of the SNA older than that from 1993. A similar
Ghattas, “Purchasing Power Parity Based Weights for the World
adoption pattern is expected for the BPM6 and GFSM 2014. Please
Economic Outlook,” in Staff Studies for the World Economic Outlook
refer to Table G, which lists the statistical standards to which each
(Washington, DC: International Monetary Fund, December 1993),
country adheres.
106-23.
94
International Monetary Fund | October 2023
STATISTICAL APPENDIX
after conversion to international dollars in the years
Algeria: Total government expenditure and net lend-
indicated.
ing/borrowing include net lending by the government,
Unless noted otherwise, composites for all sectors
which mostly reflects support to the pension system
for the euro area are corrected for reporting discrepan-
and other public sector entities.
cies in transactions within the area. Unadjusted annual
Argentina: Te official national consumer price
GDP data are used for the euro area and for the major-
index (CPI) starts in December 2016. For earlier
ity of individual countries, except for Cyprus, Ireland,
periods, CPI data for Argentina reflect the Greater
Portugal, and Spain, which report calendar-adjusted
Buenos Aires Area CPI (prior to December 2013); the
data. For data prior to 1999, data aggregations apply
national CPI (IPCNu, December 2013 to October
1995 European currency unit exchange rates.
2015); the City of Buenos Aires CPI (November
Composites for fiscal data are sums of individual
2015 to April 2016); and the Greater Buenos Aires
country data after conversion to US dollars at the aver-
Area CPI (May 2016 to December 2016). Given
age market exchange rates in the years indicated.
limited comparability of these series because of dif-
Composite unemployment rates and employment
ferences in geographical coverage, weights, sampling,
growth are weighted by labor force as a share of group
and methodology, the WEO does not report average
labor force.
CPI inflation for 2014-16 and end-of-period infla-
Composites relating to external sector statistics are
tion for 2015-16. Also, Argentina discontinued the
sums of individual country data after conversion to
publication of labor market data starting in the fourth
US dollars at the average market exchange rates in the
quarter of 2015, and new series became available
years indicated for balance of payments data and at
starting in the second quarter of 2016.
end-of-year market exchange rates for debt denomi-
Bangladesh: Data and forecasts are presented on a
nated in currencies other than US dollars.
fiscal year basis. However, country group aggregates
Composites of changes in foreign trade volumes and
that include Bangladesh use calendar year estimates of
prices, however, are arithmetic averages of percent changes
real GDP and purchasing-power-parity GDP.
for individual countries weighted by the US dollar value
Costa Rica: Te central government definition has
of exports or imports as a share of total world or group
been expanded as of January 1, 2021, to include 51
exports or imports (in the preceding year).
public entities as per Law 9524. Data back to 2019 are
Unless noted otherwise, group composites are
adjusted for comparability.
computed if 90 percent or more of the share of group
Dominican Republic: Te fiscal series have the
weights is represented.
following coverage: public debt, debt service, and
Data refer to calendar years, except in the case of
the cyclically adjusted/structural balances are for the
a few countries that use fiscal years; Table F lists the
consolidated public sector (which includes the central
economies with exceptional reporting periods for
government, the rest of the nonfinancial public sector,
national accounts and government finance data.
and the central bank); the remaining fiscal series are
For some countries, the figures for 2022 and earlier
for the central government.
are based on estimates rather than actual outturns;
Eritrea: Data and projections for 2020-28 are
Table G lists the latest actual outturns for the indi-
excluded from the database due to constraints in data
cators in the national accounts, prices, government
reporting.
finance, and balance of payments for each country.
India: Real GDP growth rates are calculated
as per national accounts: for 1998 to 2011 with
base year 2004/05 and, thereafter, with base year
Country Notes
2011/12.
Afghanistan: Data for 2021 and 2022 are estimates
Iran: Historical figures of nominal GDP in US dol-
and reported for selected indicators only, and projec-
lars are computed using the official exchange rate up to
tions for 2023-28 are omitted because of an unusu-
2017. From 2018 onward, the NIMA exchange rate,
ally high degree of uncertainty given that the IMF
rather than the official exchange rate, is now used to
has paused its engagement with the country owing
convert nominal rial GDP figures into US dollars. Te
to a lack of clarity within the international com-
IMF staff assesses that the NIMA rate better reflects
munity regarding the recognition of a government in
the transaction-value-weighted exchange rate in the
Afghanistan.
economy over that period of time.
International Monetary Fund | October 2023
95
WORLD ECONOMIC OUTLOOK: NAVIGATING GLOBAL DIVERGENCES
Italy: Data and forecasts reflect information available
recorded as revenues, consistent with the IMF’s meth-
through September 21, 2023.
odology. Terefore, data and projections for 2018-22
Lebanon: Data for 2021-22 are IMF staff estimates
are affected by these transfers, which amounted to 1.2
and not provided by the national authorities. Projec-
percent of GDP in 2018, 1.1 percent of GDP in 2019,
tions for 2023-28 are omitted owing to an unusually
0.6 percent of GDP in 2020, 0.3 percent of GDP in
high degree of uncertainty.
2021, 0.1 percent of GDP in 2022, and 0 percent
Libya: Projections do not include the impact of the
thereafter. See IMF Country Report 19/64 for further
floods which occurred in September 2023.
details.5 Te disclaimer about the public pension
Sierra Leone: Although the currency was rede-
system applies only to the revenues and net lending/
nominated on July 1, 2022, local currency data are
borrowing series.
expressed in the old leone for the October 2023 WEO.
Te coverage of the fiscal data for Uruguay was
Sri Lanka: Projections for 2023-28 are excluded
changed from consolidated public sector to nonfinancial
from publication owing to ongoing discussions on
public sector with the October 2019 WEO. In Uruguay,
sovereign debt restructuring.
nonfinancial public sector coverage includes the central
Sudan: Projections reflect staff’s analysis based on the
government, local government, social security funds,
assumption that the conflict will end by the end of 2023.
nonfinancial public corporations, and Banco de Seguros
Syria: Data are excluded from 2011 onward because
del Estado. Historical data were also revised accordingly.
of the uncertain political situation.
Under this narrower fiscal perimeter—which excludes
Türkiye: Te projections are based on information
the central bank—assets and liabilities held by the
available as of September 8, 2023, and do not fully
nonfinancial public sector for which the counterpart
incorporate a policy rate increase and additional quanti-
is the central bank are not netted out in debt figures.
tative tightening made after that date.
In this context, capitalization bonds issued in the past
Turkmenistan: Real GDP data are IMF staff esti-
by the government to the central bank are now part of
mates compiled in line with international methodolo-
the nonfinancial public sector debt. Gross and net debt
gies (SNA), using official estimates and sources as well
estimates for 2008-11 are preliminary.
as United Nations and World Bank databases. Esti-
Venezuela: Projecting the economic outlook, includ-
mates of and projections for the fiscal balance exclude
ing assessing past and current economic developments
receipts from domestic bond issuances as well as priva-
used as the basis for the projections, is rendered dif-
tization operations, in line with the GFSM 2014. Te
ficult by the lack of discussions with the authorities
authorities’ official estimates for fiscal accounts, which
(the most recent Article IV consultation took place
are compiled using domestic statistical methodologies,
in 2004), incomplete metadata of limited reported
include bond issuance and privatization proceeds as
statistics, and difficulties in reconciling reported indica-
part of government revenues.
tors with economic developments. Te fiscal accounts
Ukraine: Revised national accounts data are available
include the budgetary central government; social
beginning in 2000 and exclude Crimea and Sevastopol
security; FOGADE (insurance deposit institution); and
from 2010 onward.
a reduced set of public enterprises, including Petróleos
United Kingdom: Projections do not incorporate
de Venezuela, S.A. (PDVSA). Following some meth-
the significant statistical upward revisions to 2020 and
odological upgrades to achieve a more robust nominal
2021 GDP that were previewed on September 1, 2023
GDP, historical data and indicators expressed as a per-
(with a release date of September 29, 2023).
centage of GDP have been revised from 2012 onward.
Uruguay: In December 2020 the authorities began
For most indicators, data for 2018-22 are IMF staff
reporting the national accounts data according to the
estimates. Te effects of hyperinflation and the paucity
SNA 2008, with the base year 2016. Te new series
of reported data mean that the IMF staff’s projected
begin in 2016. Data prior to 2016 reflect the IMF
macroeconomic indicators should be interpreted with
staff’s best effort to preserve previously reported data
caution. Broad uncertainty surrounds these projec-
and avoid structural breaks.
tions. Venezuela’s consumer prices are excluded from
Since October 2018 Uruguay’s public pension
all WEO group composites.
system has been receiving transfers in the context of
5 Uruguay: Staff Report for the 2018 Article IV Consultation, Coun-
law 19,590 that compensates persons affected by the
try Report 19/64 (Washington, DC: International Monetary Fund,
creation of the mixed pension system. Tese funds are
February 2019).
96
International Monetary Fund | October 2023
STATISTICAL APPENDIX
West Bank and Gaza: Certain projections for
the current members for all years, even though the
2022-28 are excluded from publication pending
membership has increased over time.
methodological adjustments to statistical series.
Table C lists the member countries of the European
Zimbabwe: Authorities have recently finished rede-
Union, not all of which are classified as advanced
nominating their national accounts statistics following the
economies in the WEO.
introduction in 2019 of the Real Time Gross Settlement
dollar, later renamed the Zimbabwe dollar. Te Zimba-
Emerging Market and Developing Economies
bwe dollar previously ceased circulating in 2009, and dur-
ing 2009-19 Zimbabwe operated under a multicurrency
Te group of emerging market and developing
regime with the US dollar as the unit of account.
economies (155) comprises all those that are not classi-
fied as advanced economies.
Te regional breakdowns of emerging market and
Classification of Countries
developing economies are emerging and developing
Summary of the Country Classification
Asia; emerging and developing Europe (sometimes
also referred to as “central and eastern Europe”);
Te country classification in the WEO divides the
Latin America and the Caribbean; Middle East and
world into two major groups: advanced economies
Central Asia (which comprises the regional subgroups
and emerging market and developing economies.6 Tis
Caucasus and Central Asia; and Middle East, North
classification is not based on strict criteria, economic or
Africa, Afghanistan, and Pakistan); and sub-Saharan
otherwise, and has evolved over time. Te objective is
Africa.
to facilitate analysis by providing a reasonably mean-
Emerging market and developing economies are also
ingful method of organizing data. Table A provides
classified according to analytical criteria that reflect
an overview of the country classification, showing
the composition of export earnings and a distinction
the number of countries in each group by region and
between net creditor and net debtor economies. Tables
summarizing some key indicators of their relative size
D and E show the detailed composition of emerging
(GDP valued at purchasing power parity, total exports
market and developing economies in the regional and
of goods and services, and population).
analytical groups.
Some countries remain outside the country classifi-
Te analytical criterion source of export earnings
cation and therefore are not included in the analysis.
distinguishes between the categories fuel (Standard
Cuba and the Democratic People’s Republic of Korea
International Trade Classification [SITC] 3) and
are examples of countries that are not IMF mem-
nonfuel and then focuses on nonfuel primary products
bers, and the IMF therefore does not monitor their
(SITCs 0, 1, 2, 4, and 68). Economies are categorized
economies.
into one of these groups if their main source of export
earnings exceeded 50 percent of total exports on aver-
General Features and Composition of Groups in
age between 2018 and 2022.
the World Economic Outlook Classification
Te financial and income criteria focus on net credi-
tor economies, net debtor economies, heavily indebted
Advanced Economies
poor countries (HIPCs), low-income developing countries
Table B lists the 41 advanced economies. Te seven
(LIDCs), and emerging market and middle-income
largest in terms of GDP based on market exchange
economies (EMMIEs). Economies are categorized as net
rates—the United States, Japan, Germany, France,
debtors when their latest net international investment
Italy, the United Kingdom, and Canada—constitute
position, where available, was less than zero or their
the subgroup of major advanced economies, often
current account balance accumulations from 1972
referred to as the Group of Seven. Te members of the
(or earliest available data) to 2022 were negative. Net
euro area are also distinguished as a subgroup. Com-
debtor economies are further differentiated on the basis
posite data shown in the tables for the euro area cover
of experience with debt servicing.7
6 As used here, the terms “country” and “economy” do not always
refer to a territorial entity that is a state as understood by interna-
7 During 2018-22, 39 economies incurred external payments
tional law and practice. Some territorial entities included here are
arrears or entered into official or commercial bank debt-rescheduling
not states, although their statistical data are maintained on a separate
agreements. Tis group is referred to as economies with arrears and/or
and independent basis.
rescheduling during 2018-22.
International Monetary Fund | October 2023
97
WORLD ECONOMIC OUTLOOK: NAVIGATING GLOBAL DIVERGENCES
Te HIPC group comprises the countries that
benefited from debt relief and have graduated from
are or have been considered by the IMF and the
the initiative.
World Bank for participation in their debt initia-
Te LIDCs are countries that have per capita
tive known as the HIPC Initiative, which aims to
income levels below a certain threshold (set at $2,700
reduce the external debt burdens of all the eligible
in 2016 as measured by the World Bank’s Atlas
HIPCs to a “sustainable” level in a reasonably short
method), structural features consistent with limited
period of time.8 Many of these countries have already
development and structural transformation, and
external financial linkages insufficiently close for them
to be widely seen as emerging market economies.
8 See David Andrews, Anthony R. Boote, Syed S. Rizavi, and
Te EMMIEs group comprises emerging market
Sukwinder Singh, “Debt Relief for Low-Income Countries: Te
and developing economies that are not classified as
Enhanced HIPC Initiative,” IMF Pamphlet Series 51 (Washington,
DC: International Monetary Fund, November 1999).
LIDCs.
98
International Monetary Fund | October 2023