F18. FLIGHT MANUAL (2008) - page 33
A1-F18EA-NFM-200
CHAPTER 3
Takeoff
F414-GE-400
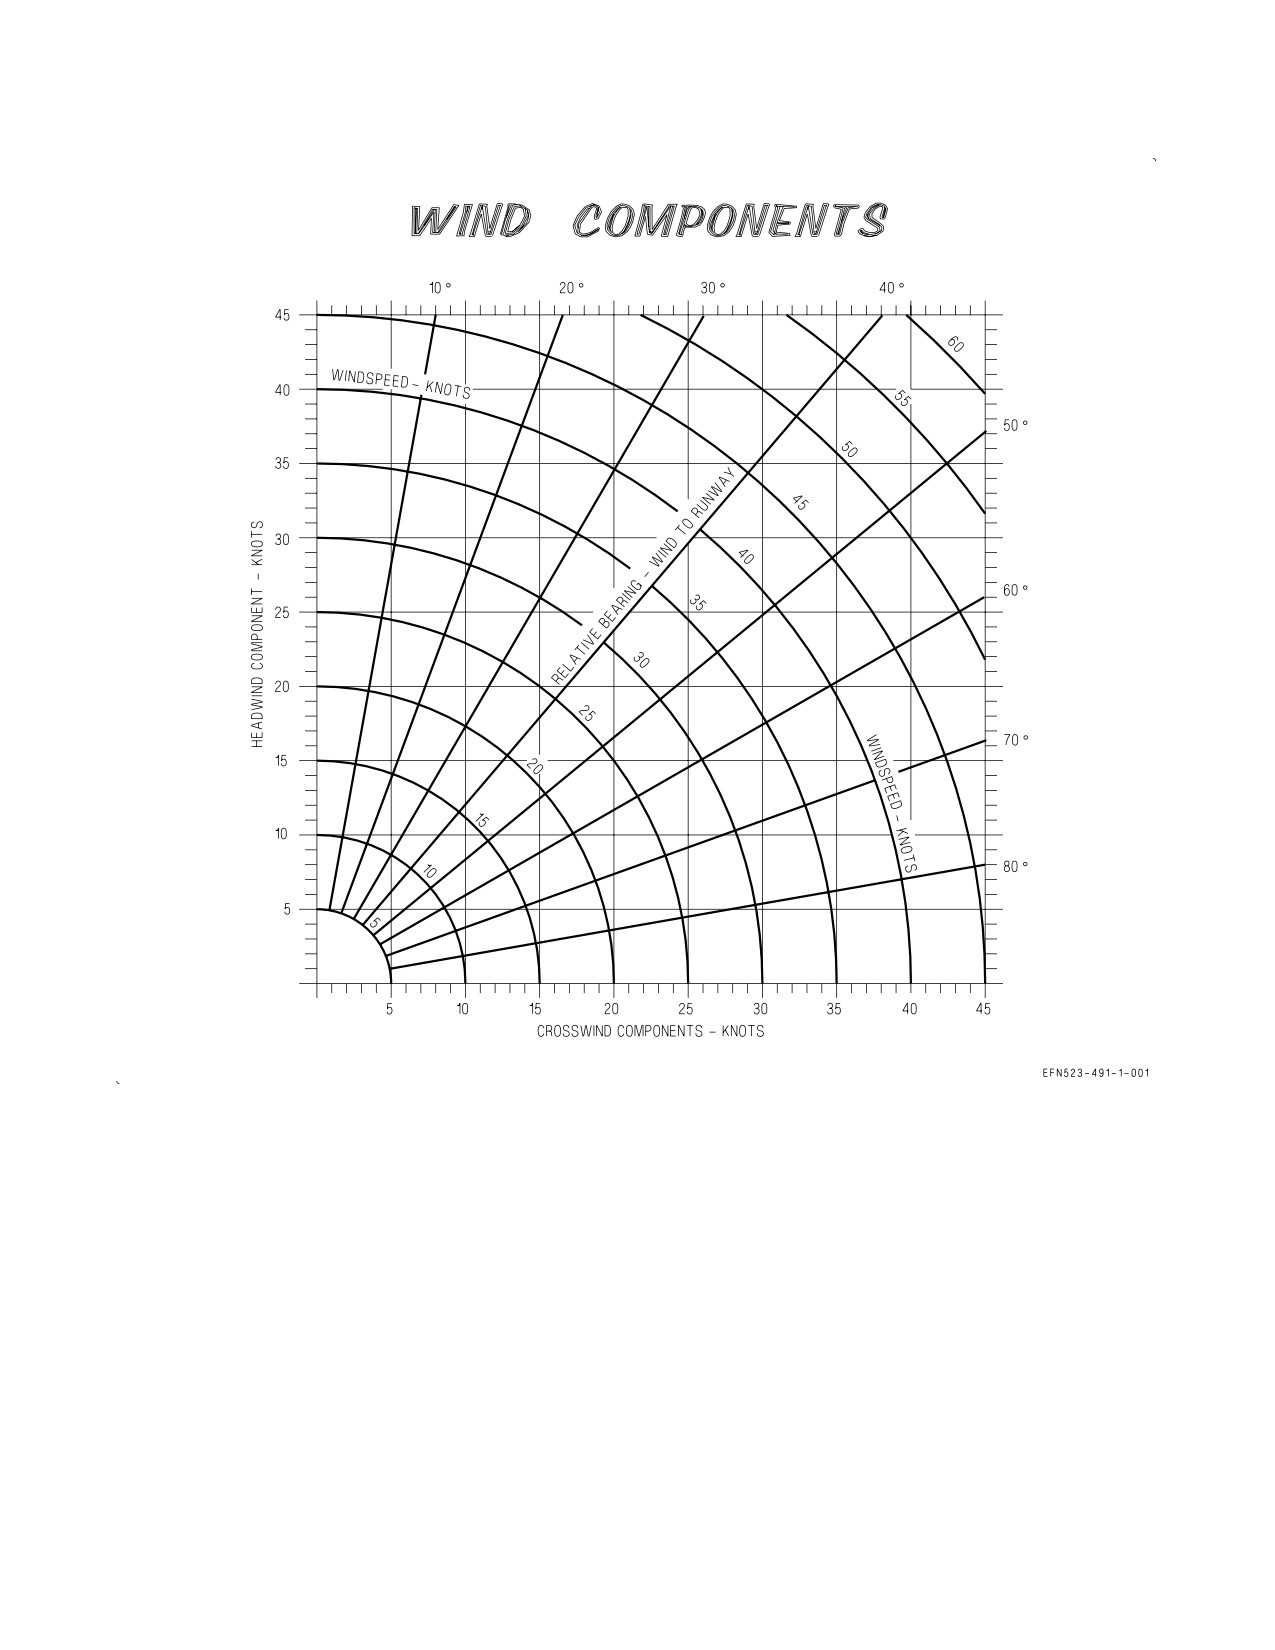
3.1 WIND COMPONENTS CHART
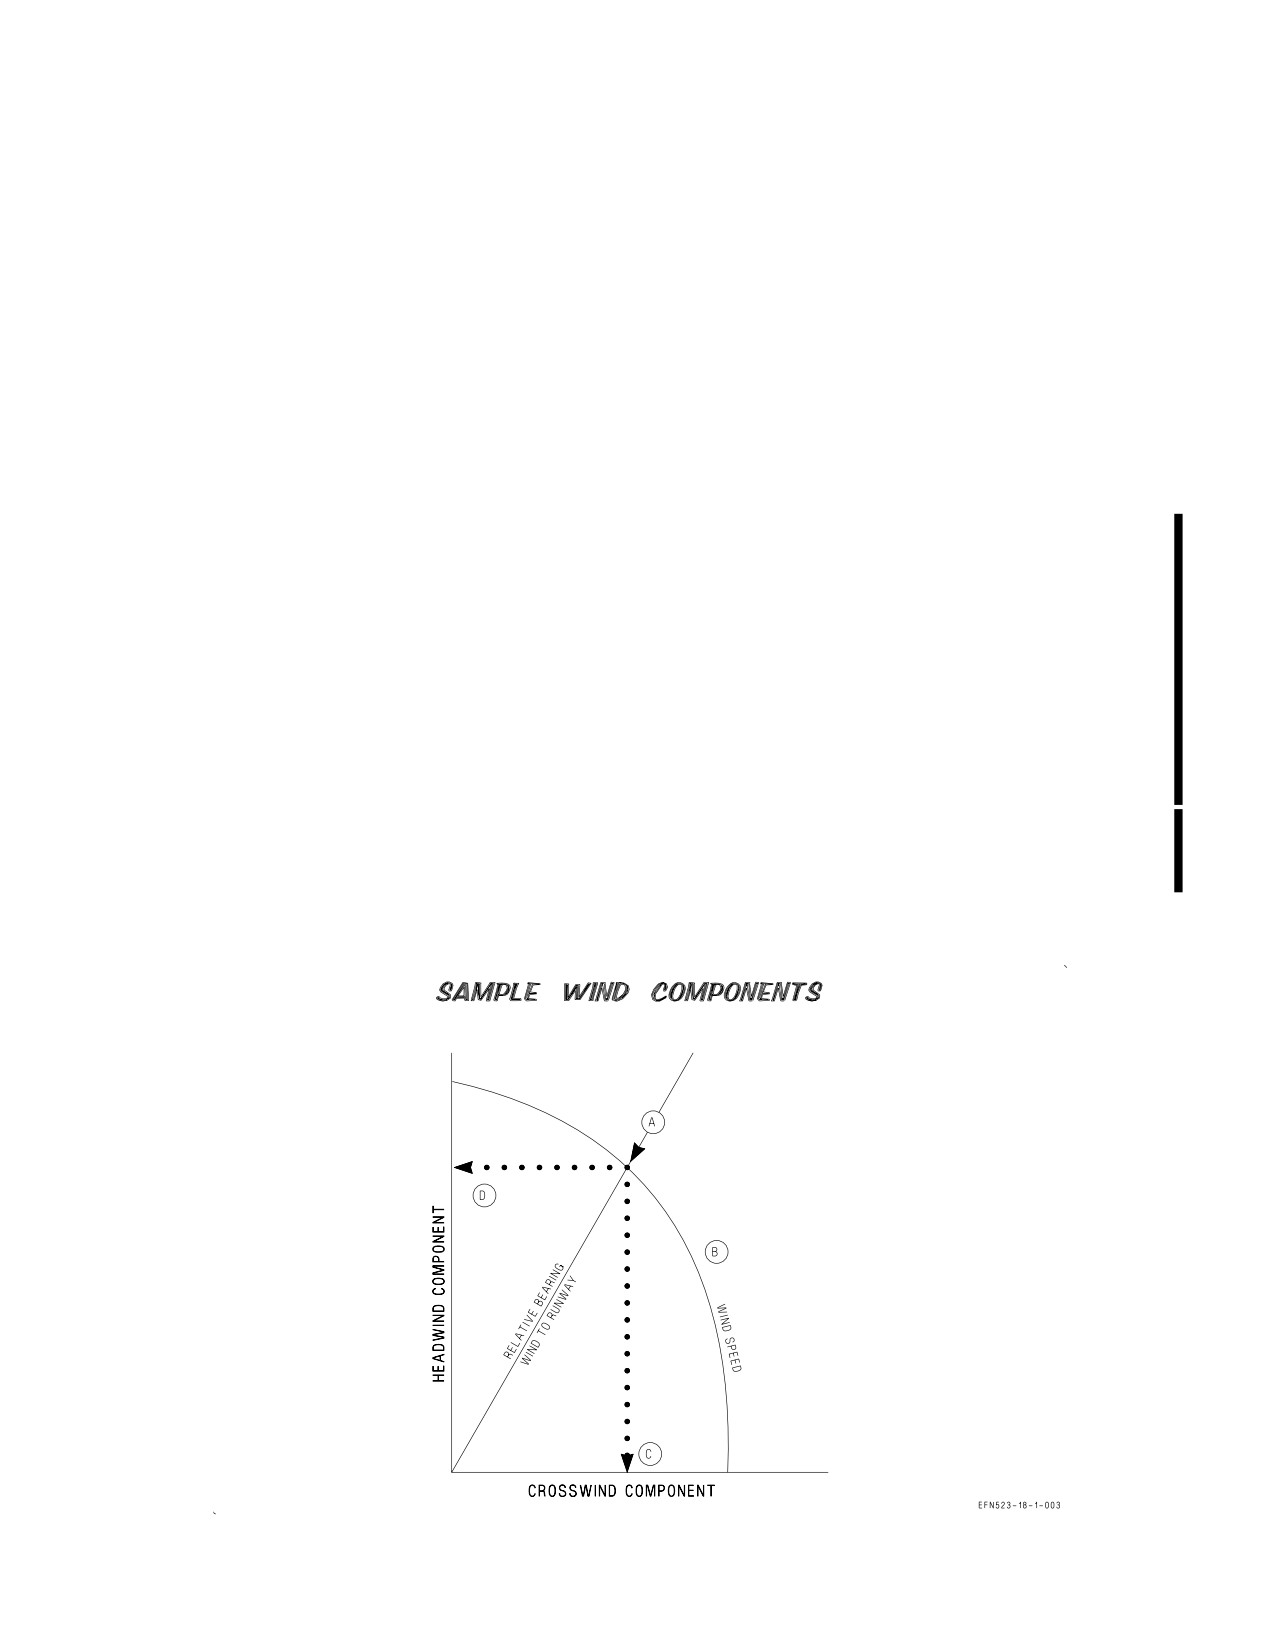
This chart (figure 3-1) is used primarily for breaking a forecast wind down into crosswind and
headwind components for takeoff computations. It is not to be used as a ground controllability chart.
3.1.1 Use. Determine the effective wind velocity. For crosswind component add the full value of any
reported gust velocity (incremental wind factor) to the steady state velocity; e.g., reported wind 050/30
G40, effective wind is 050/40. For headwind component add one-half the gust velocity (incremental
wind factor) to the steady state velocity; e.g., reported wind 050/30 G40, effective wind is 050/35.
Reduce the reported wind direction to a relative bearing by determining the wind direction and runway
heading. Enter the chart with the relative bearing. Move along the relative bearing to intercept the
crosswind effective wind speed arc. From this point, descend vertically to read the crosswind
component. From the intersection of bearing and effective headwind speed, project horizontally to the
left to read headwind component.
3.1.2 Sample Problem. Conditions - Reported wind 050/35 G40, runway heading 030
A. Relative bearing
20°
C. Crosswind component
14 knots
B. Intersect:Crosswind windspeed arc 40 knots
D. Headwind component
33 knots
Headwind windspeed arc 35 knots
XI-3-1
CHANGE 2
A1-F18EA-NFM-200
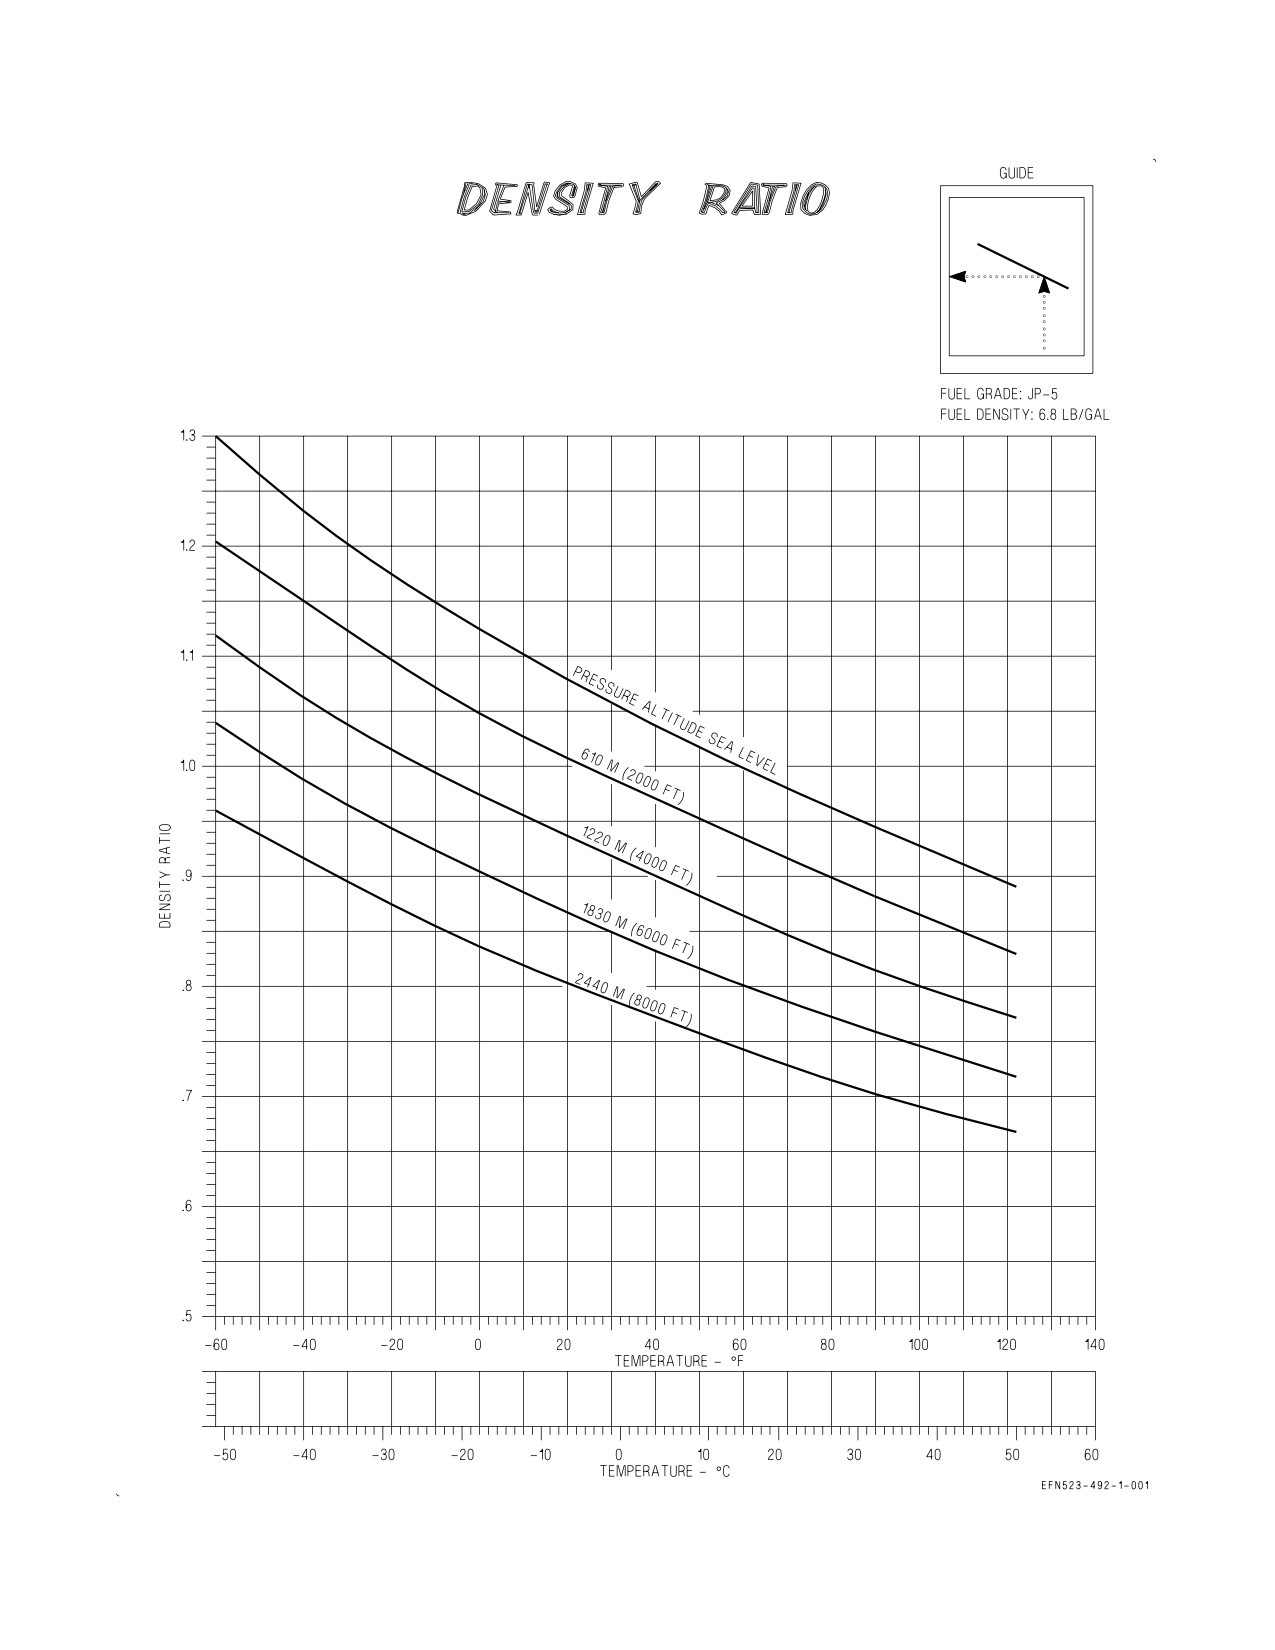
3.2 DENSITY RATIO CHART
This chart (figure 3-2) provides a means of obtaining a single factor (density ratio) that may be used
to represent a combination of temperature and pressure altitude. Density ratio must be determined
before the takeoff data charts can be utilized.
3.2.1 Use. Enter the chart with existing temperature and project vertically to intersect the applicable
pressure altitude curve. From this point, project horizontally to the left scale to read density ratio.
3.2.2 Sample Problem.
A. Temperature
60°F
C. Density ratio
0.93
B. Pressure altitude
2000 feet
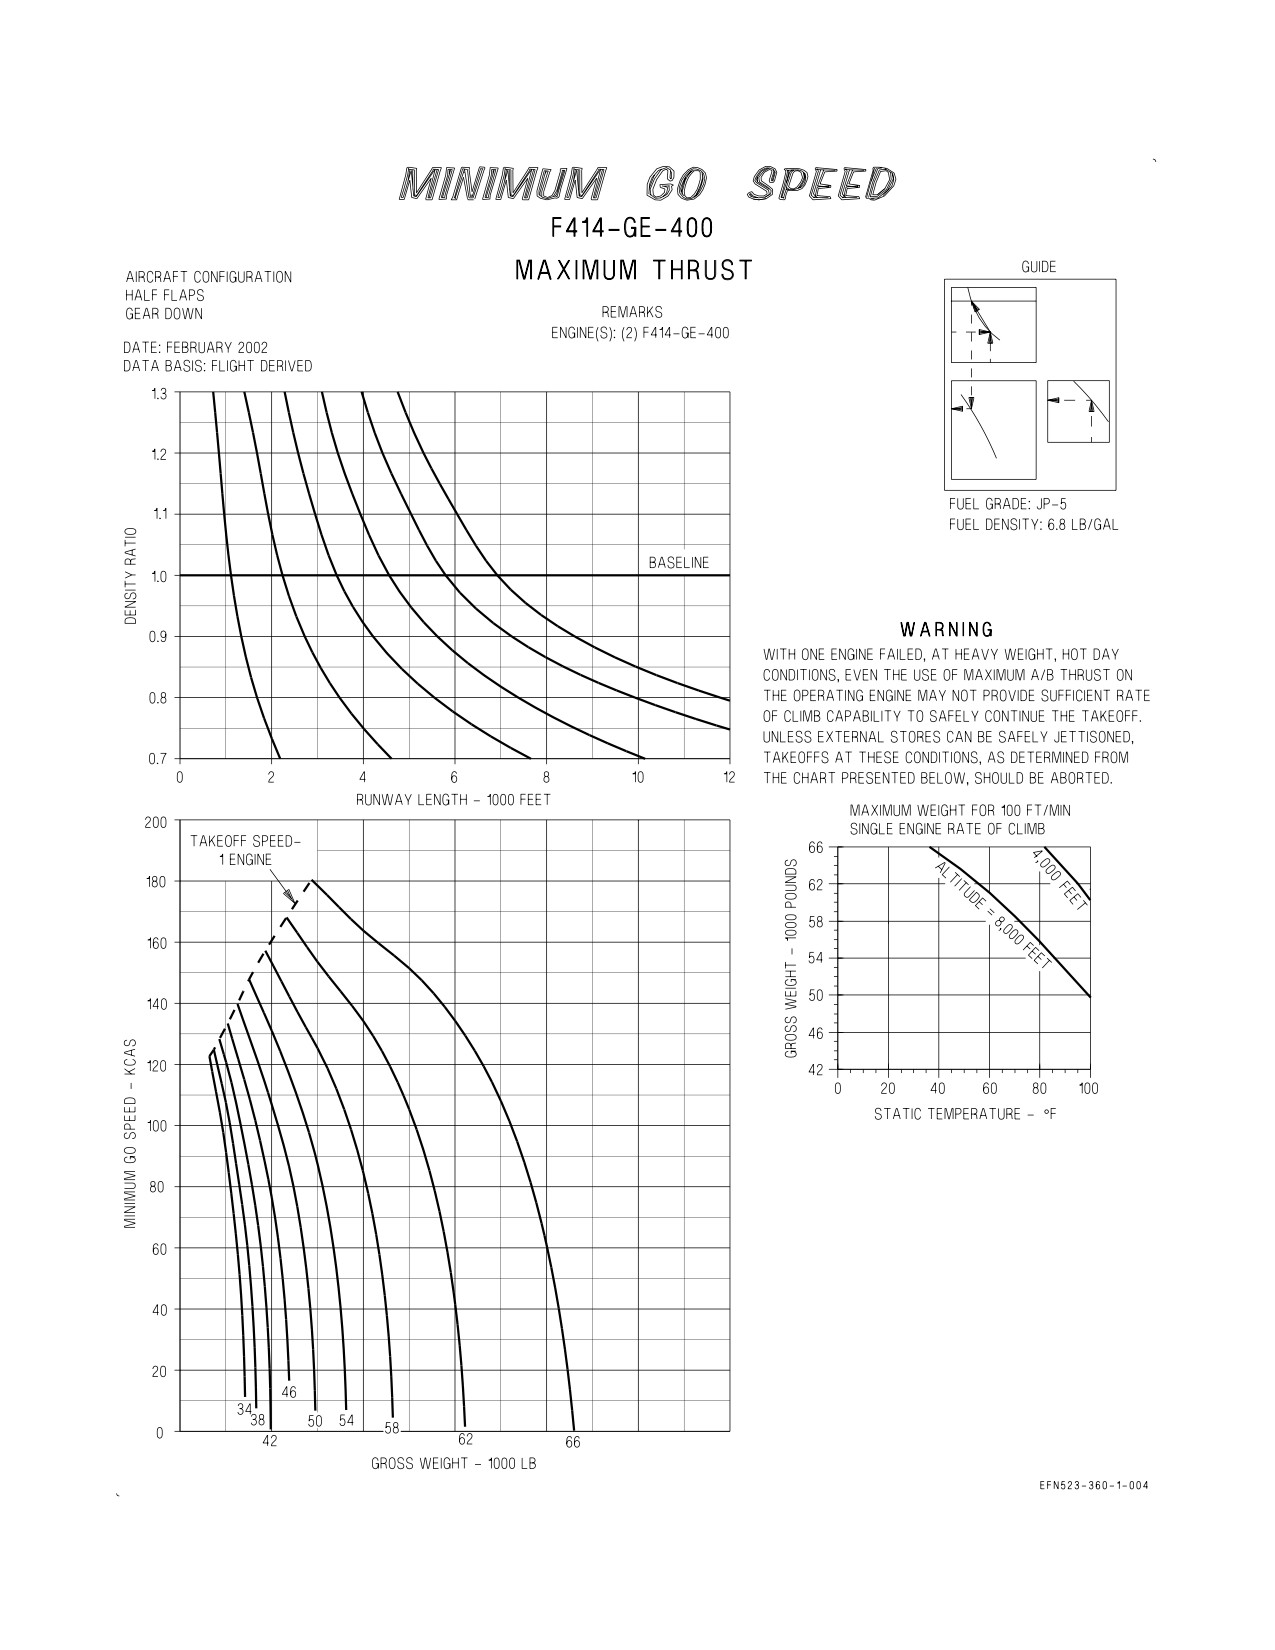
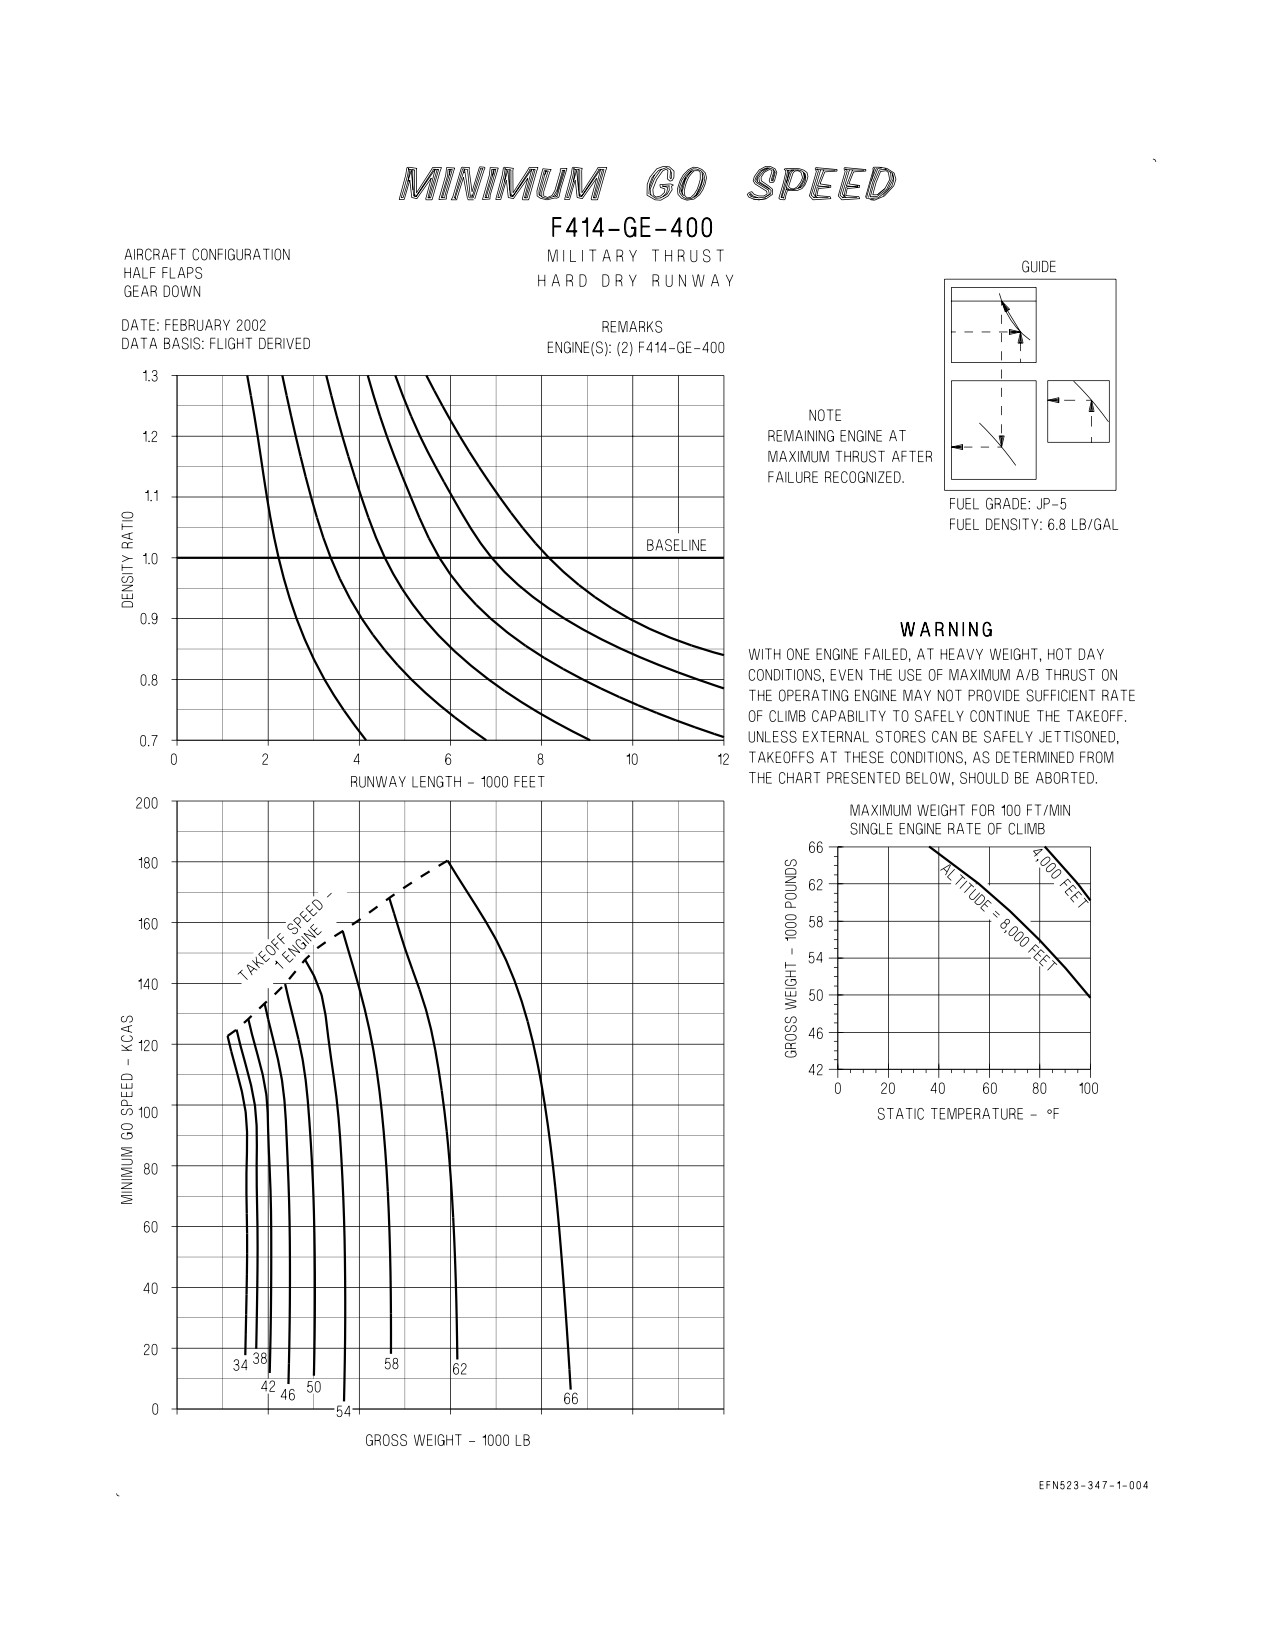
3.3 MINIMUM GO SPEED CHARTS
These charts (figures 3-3 and 3-4) provide the means of determining the minimum speed at which
the aircraft can experience an engine failure and still take off. Variations in ambient temperature,
pressure altitude, gross weight, and the runway length are taken into consideration. Separate plots are
provided for maximum afterburner and military thrust conditions. The data presented reflect an
engine failure occurring at the minimum go speed and allowing a 3-second decision period from the
time of the failure. In the case of a military thrust takeoff, an additional 2-second period is allotted for
advancing the throttles and transitioning to maximum afterburner thrust on the operating engine.
If an engine is lost above the maximum abort speed but below the
minimum go speed or at a condition where insufficient rate of climb
capability exists, the pilot can neither abort nor take off safely with the
runway length remaining without considering such factors as reducing
gross weight or engaging the overrun end arrestment cable.
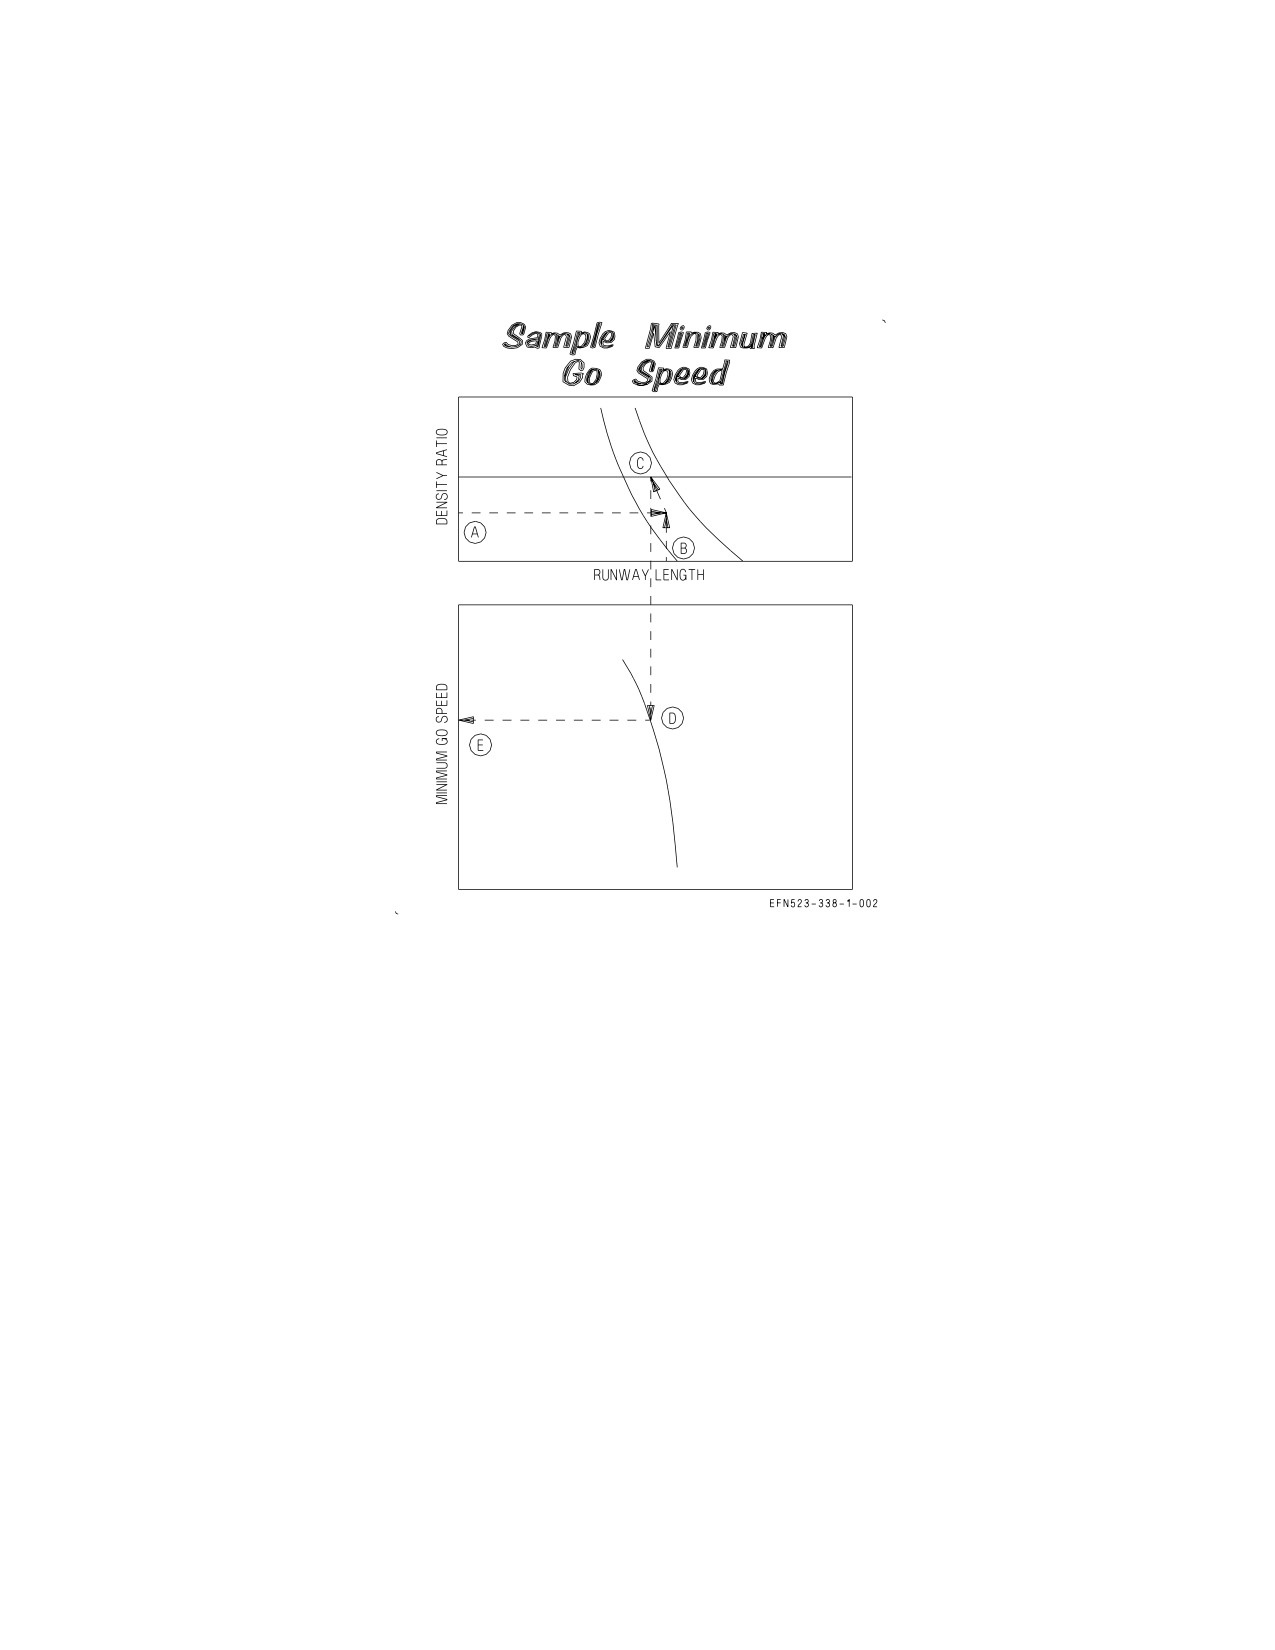
3.3.1 Use. To determine minimum go speed, enter the applicable plot with the prevailing density
ratio, and project horizontally to the available runway length grid line. Parallel the nearest guideline
up or down until intersecting the density ratio baseline. From this point descend vertically until
intersecting the applicable gross weight curve. If this projected line does not intersect the applicable
takeoff gross weight curve, there is no corresponding minimum go speed (single engine takeoff is
possible for the available runway length regardless of engine failure speed). If the gross weight curve
lies to the right of the projected line, a single-engine takeoff cannot be made under the prevailing
conditions. Finally, project horizontally to read the minimum go speed.
NOTE
This problem assumes maximum thrust on operating engine within 5
seconds after engine failure. The minimum go speed for a maximum
thrust takeoff will be lower than that for a military thrust takeoff due
to the greater acceleration with maximum thrust up to and including
the 3-second decision time.
XI-3-2
ORIGINAL
A1-F18EA-NFM-200
3.3.2 Sample Problem. Military Thrust Takeoff.
A. Density ratio
0.90
D. Takeoff gross weight
62,000 Lb.
B. Runway length
6000 Ft.
E. Minimum go speed
145 KCAS
C. Density baseline
XI-3-3
ORIGINAL
A1-F18EA-NFM-200
3.4 MAXIMUM GROSS WEIGHT WITH SINGLE ENGINE CHARTS
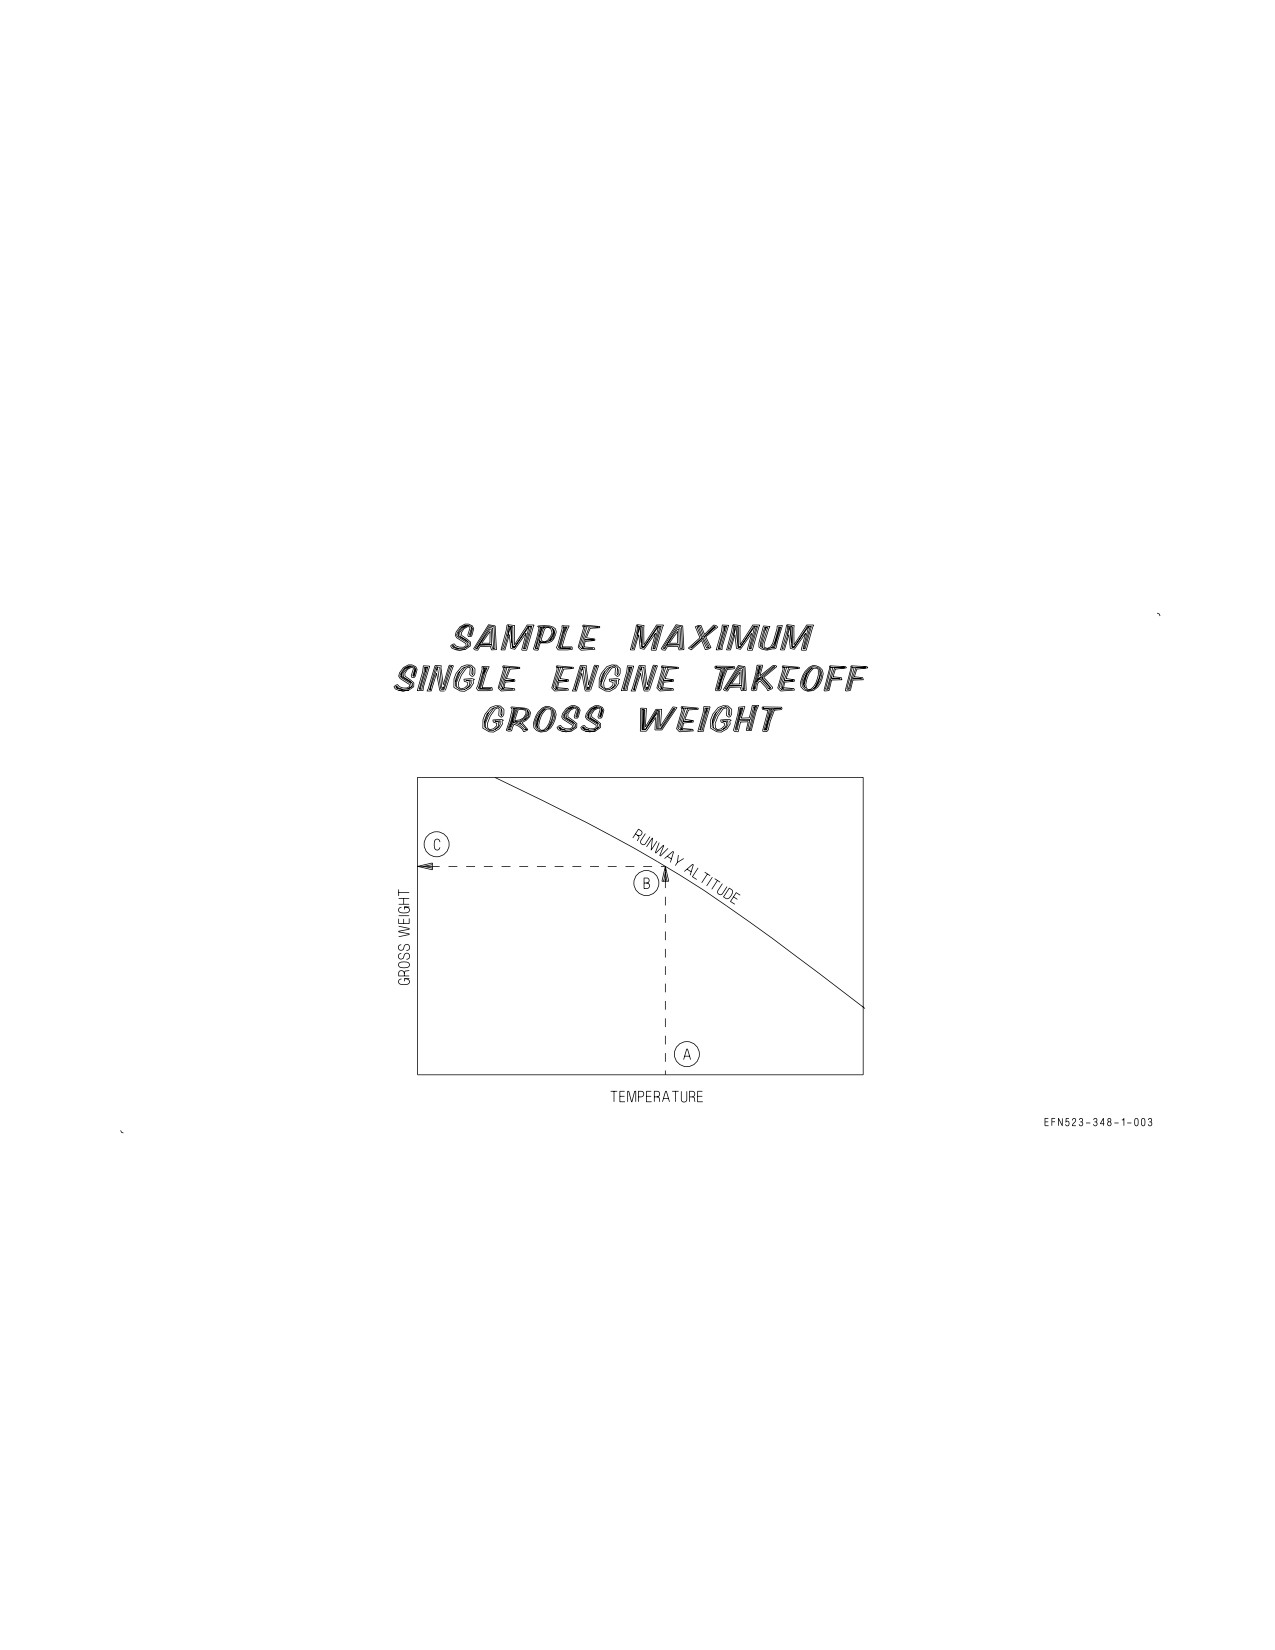
These charts (included with figures 3-3 and 3-4) provide a the means for determining the maximum
takeoff gross weight for which the aircraft is capable of establishing at least 100 fpm single engine rate
of climb. Variations in field ambient temperature and runway altitude are taken into consideration.
3.4.1 Use. To determine the maximum gross weight for 100 fpm single engine rate of climb, enter the
applicable chart with the field temperature and ascend vertically to the field altitude. From this point
project horizontally to read the maximum takeoff gross weight for which at least 100 fpm single engine
rate of climb is possible. If the takeoff gross weight is higher than this value and gross weight cannot
be safely reduced, the takeoff should be aborted.
3.4.2 Sample Problem.
A. Temperature
60°F (15.6°C)
C. Maximum Gross Weight
61,000 lbs.
B. Altitude
8000 feet
XI-3-4
ORIGINAL
A1-F18EA-NFM-200
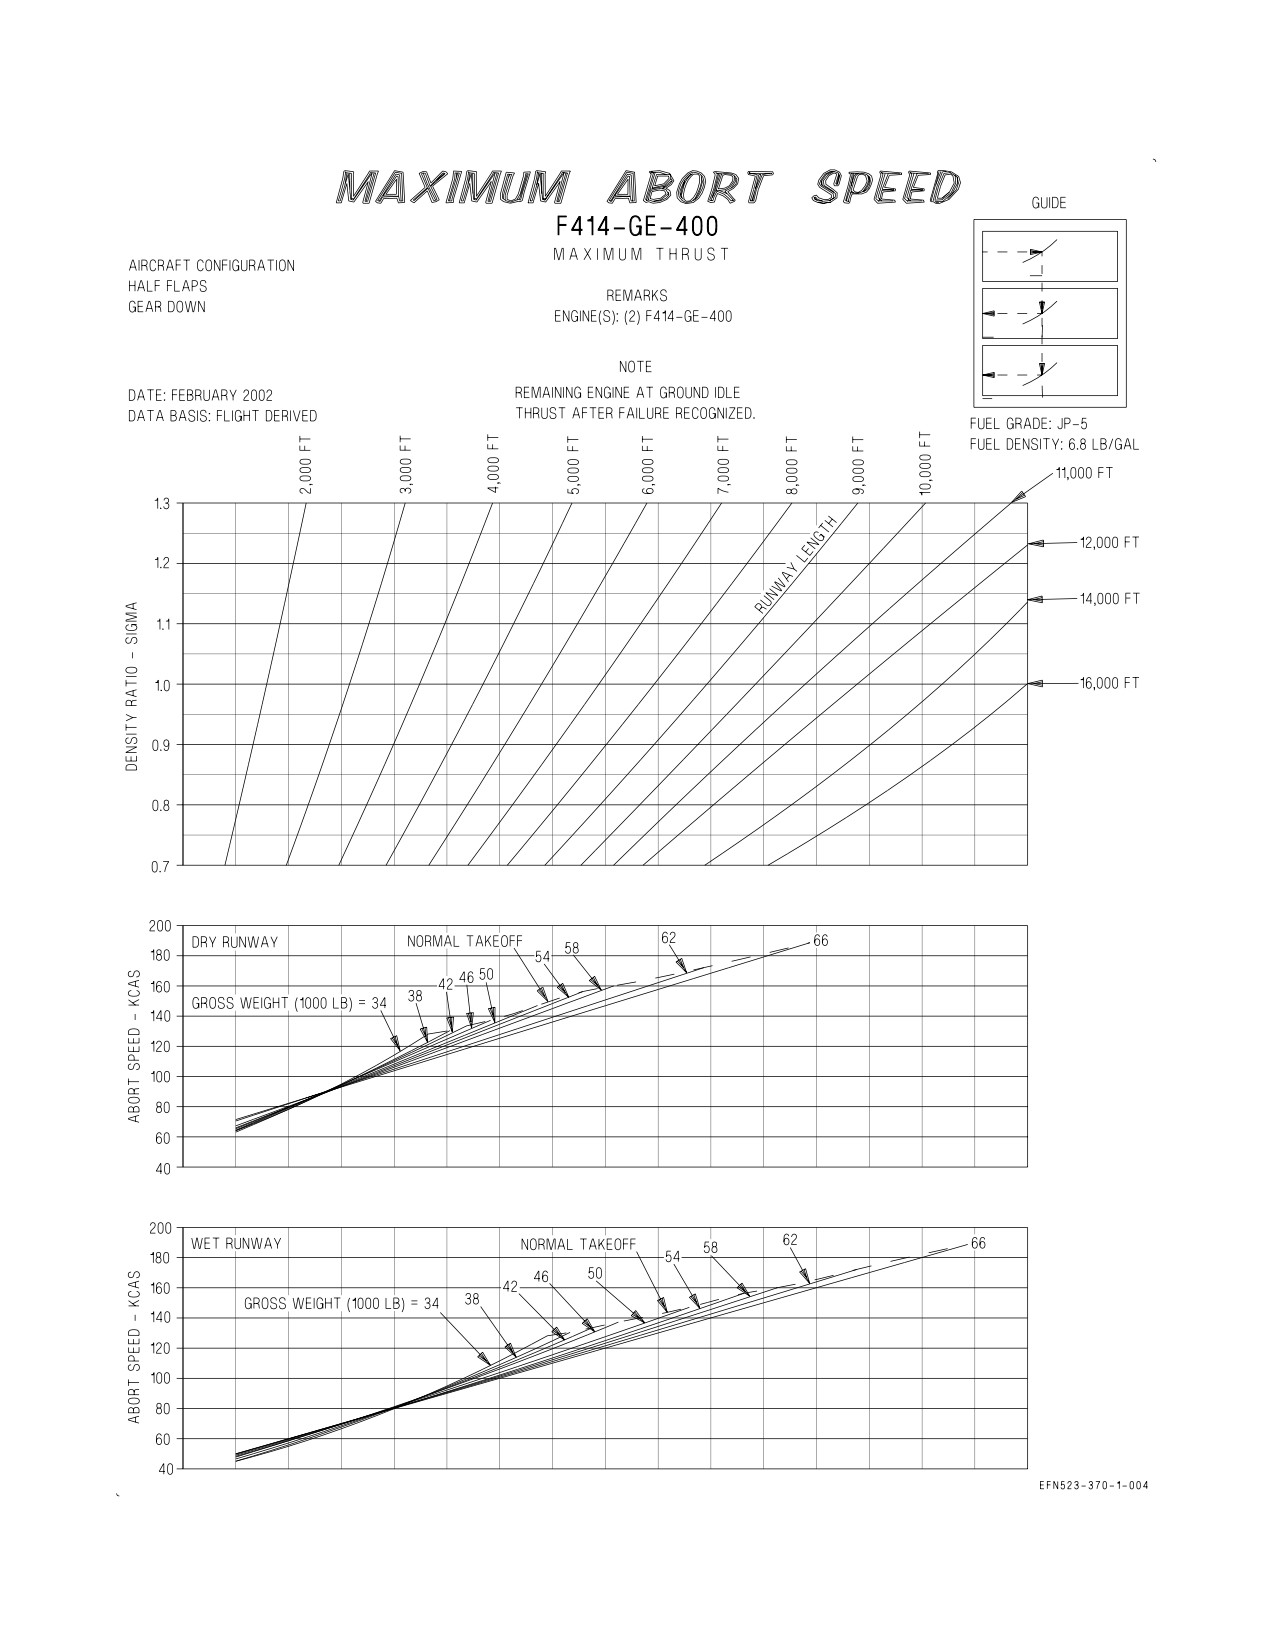
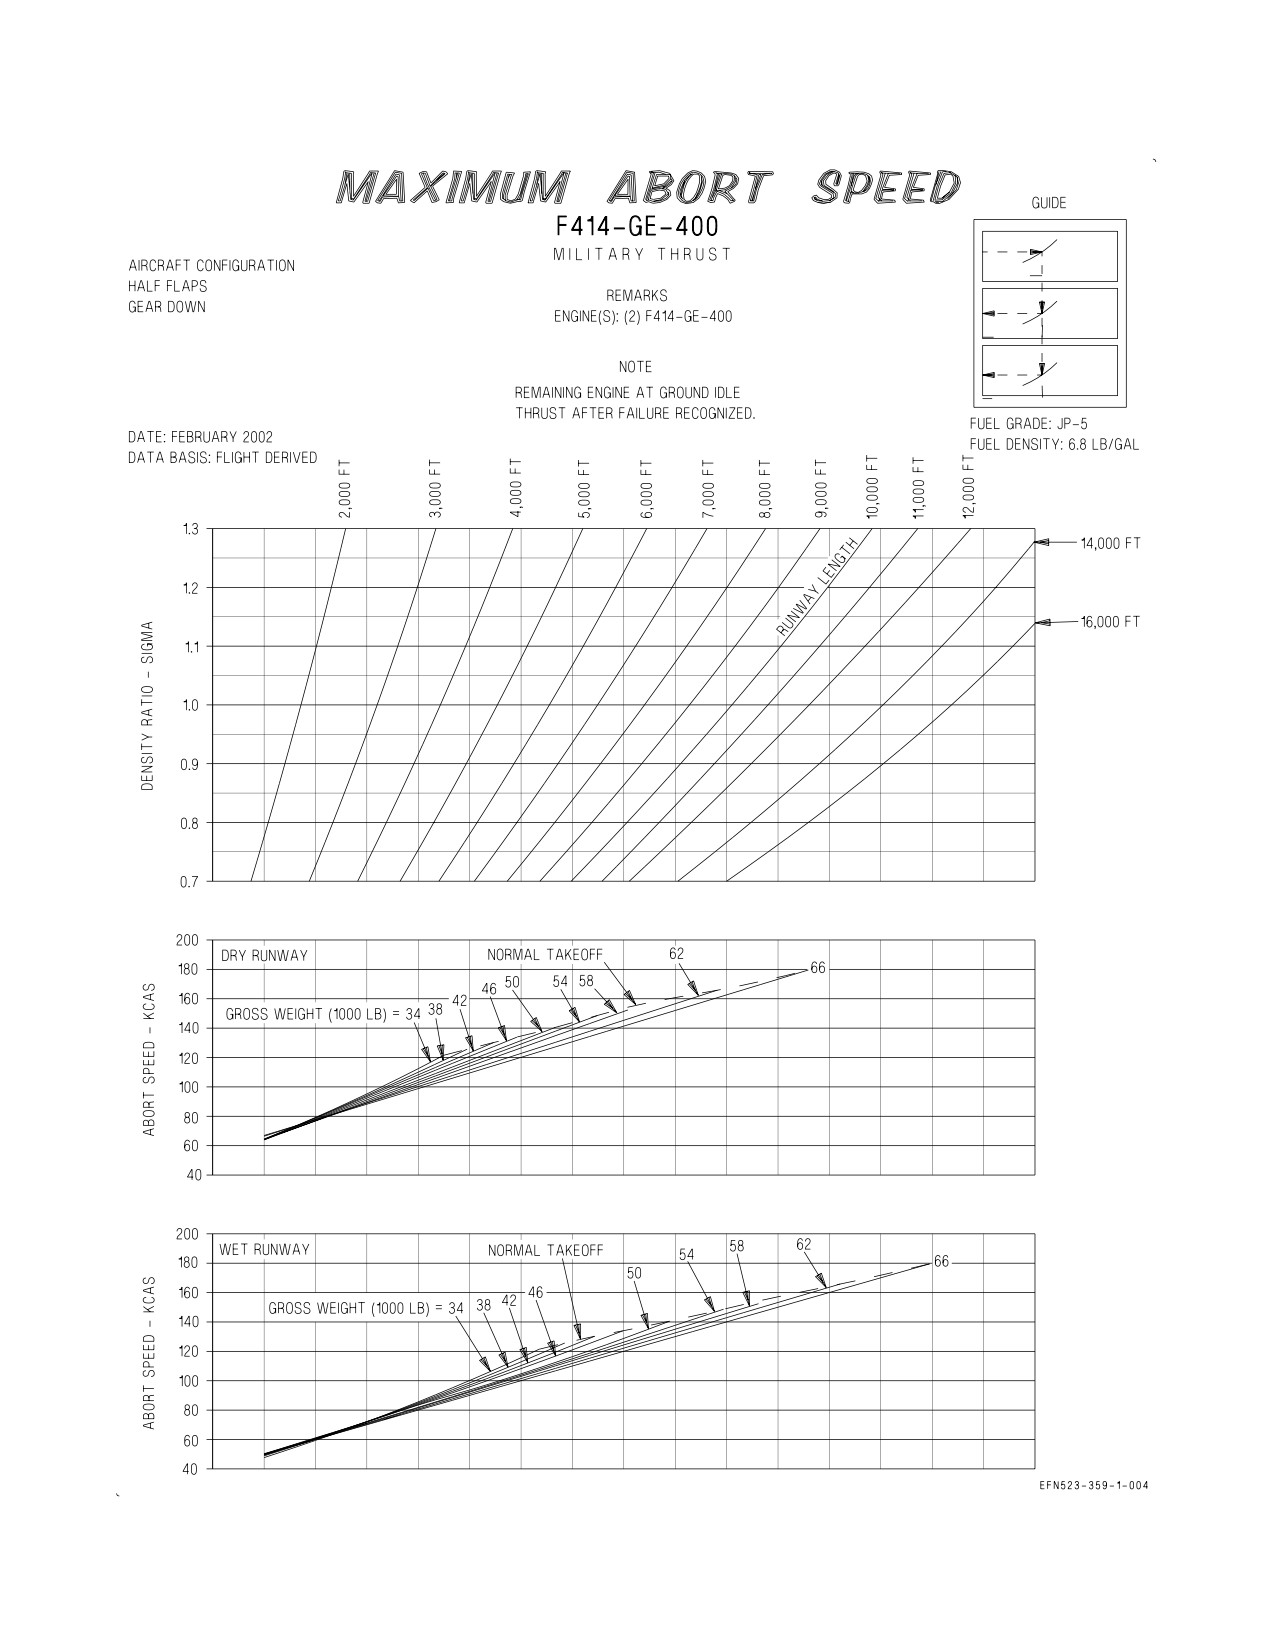
3.5 MAXIMUM ABORT SPEED CHARTS
These charts (figures 3-5 and 3-6) provide the means for determining the maximum speed at which
a field takeoff may be aborted and the aircraft stopped within the remaining runway length. Variations
in ambient temperature, pressure altitude, aircraft gross weight, and runway length are taken into
consideration. Separate plots are provided for maximum afterburner and military thrust takeoffs
under both dry and wet runway conditions. The data presented reflect an engine failure occurring at
the maximum abort speed allowing a 3-second decision period from the time of failure followed by a
2-second transition to idle thrust on the operating engine and full braking (brake application speed
limits applied).
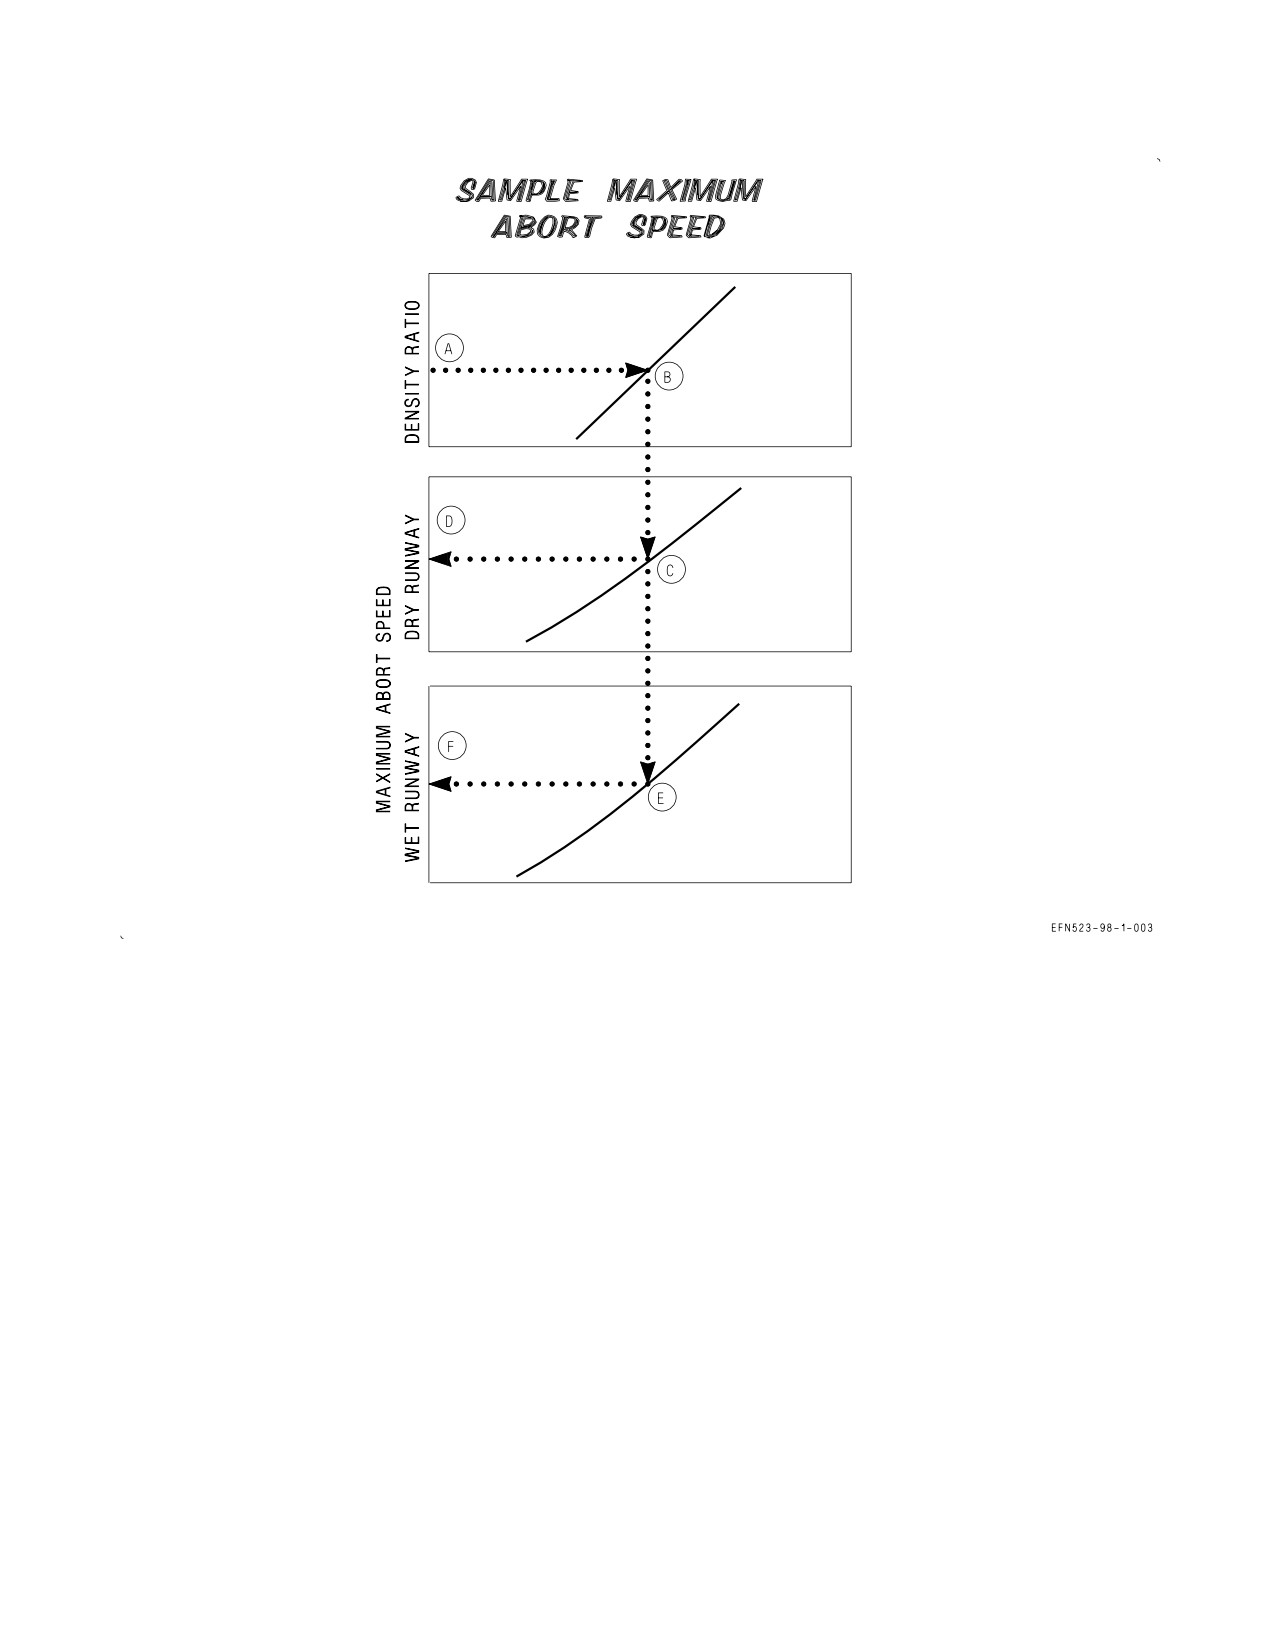
3.5.1 Use. Enter the chart with the prevailing density ratio and project horizontally right to intersect
the available runway length curve. From this point, project vertically down to the applicable gross
weight curve for either dry or wet runway conditions, then horizontally left to read maximum abort
speed.
3.5.2 Sample Problem. Maximum Thrust Takeoff (figure 3-5).
A. Density ratio
0.90
D. Maximum abort speed
B. Runway length
8000 feet
(Dry runway)
150 KCAS
C. Gross weight
62,000 lbs.
E. Maximum abort speed
(Wet runway)
122 KCAS
XI-3-5
ORIGINAL
A1-F18EA-NFM-200
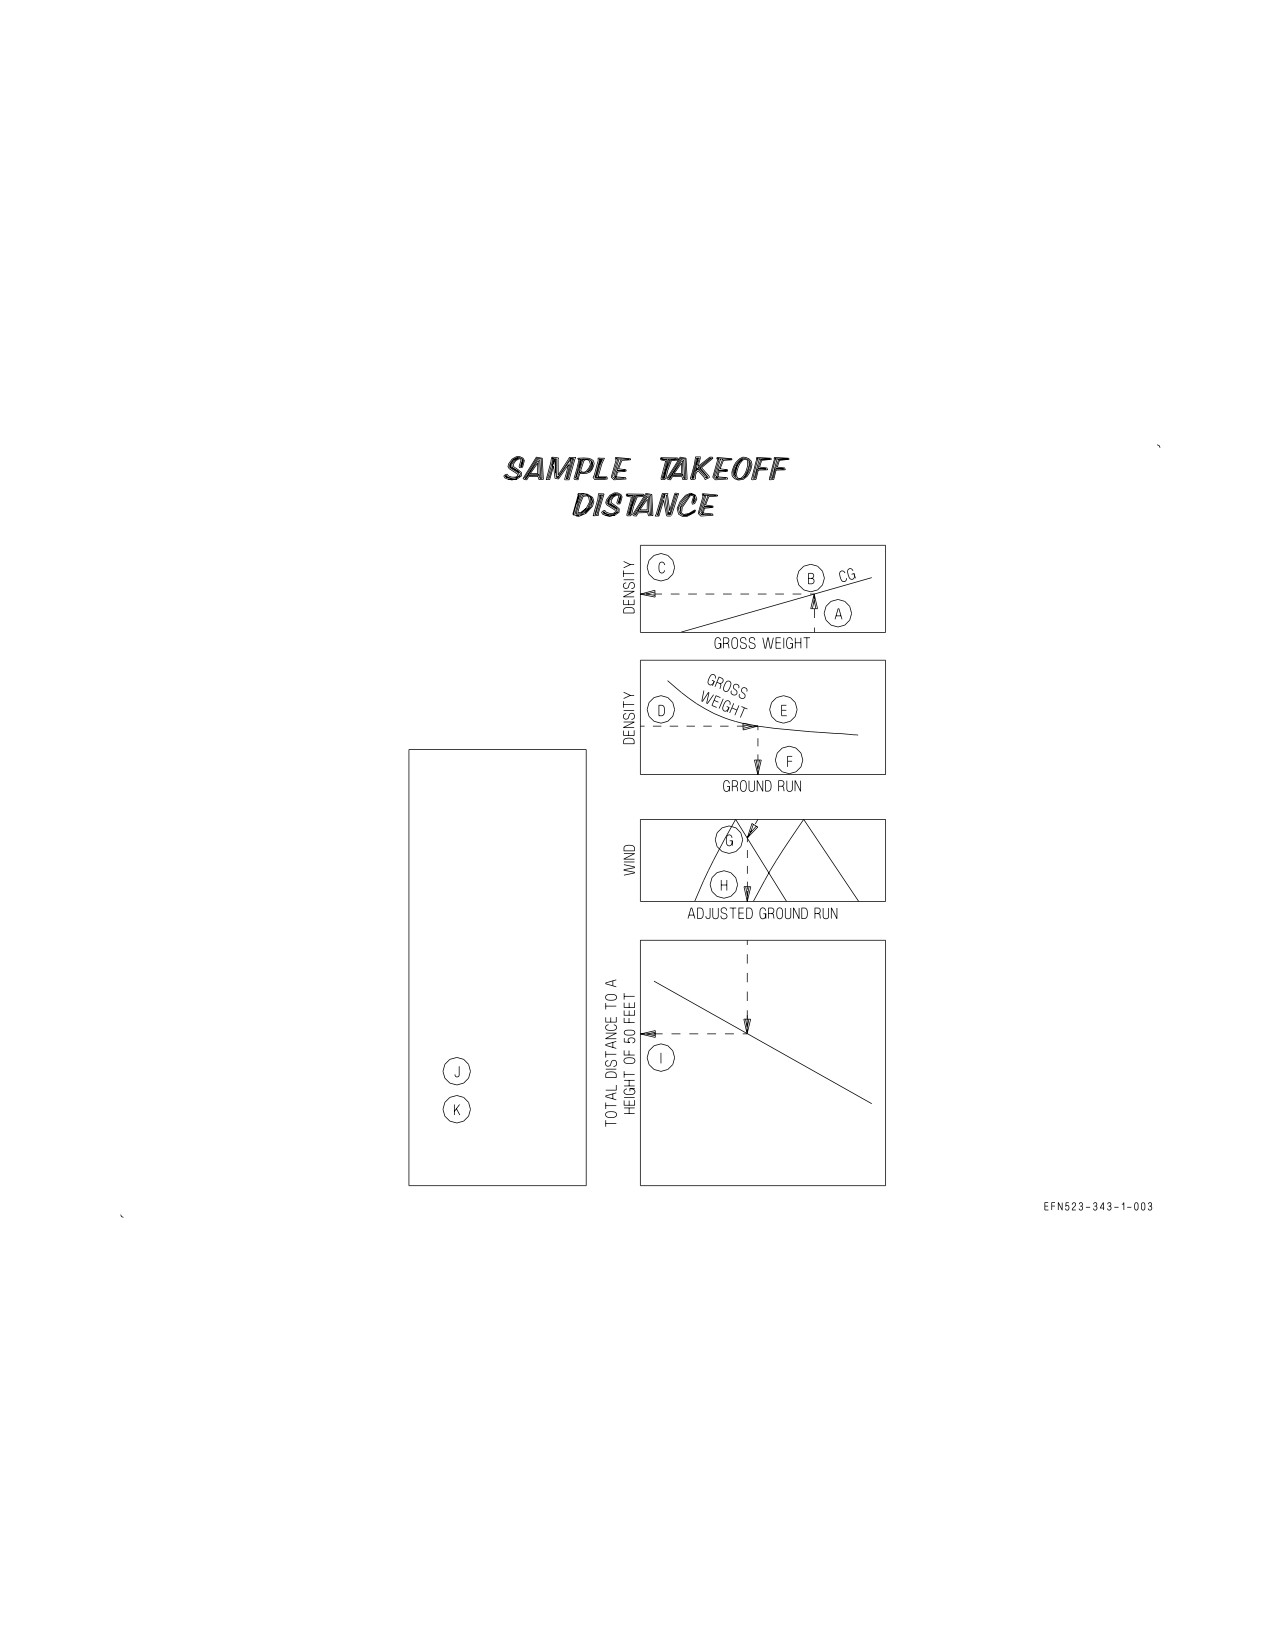
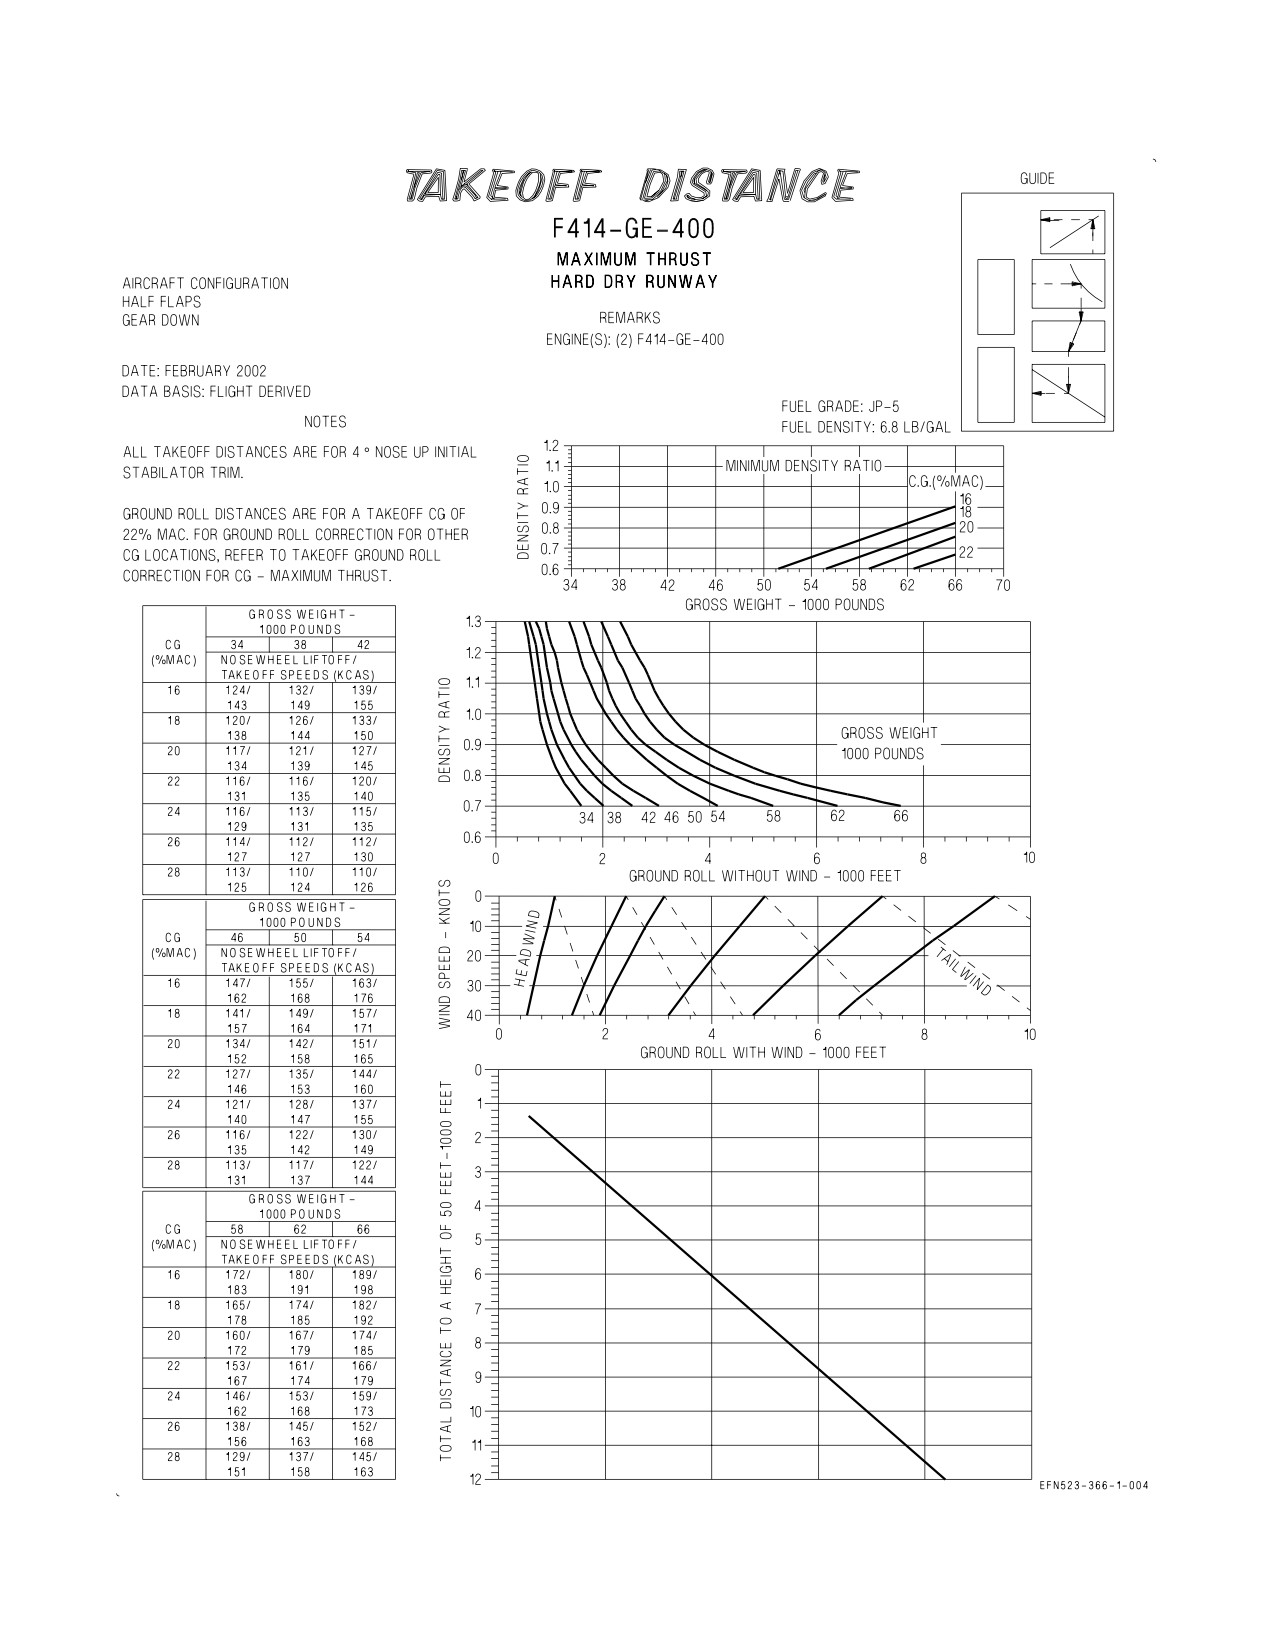
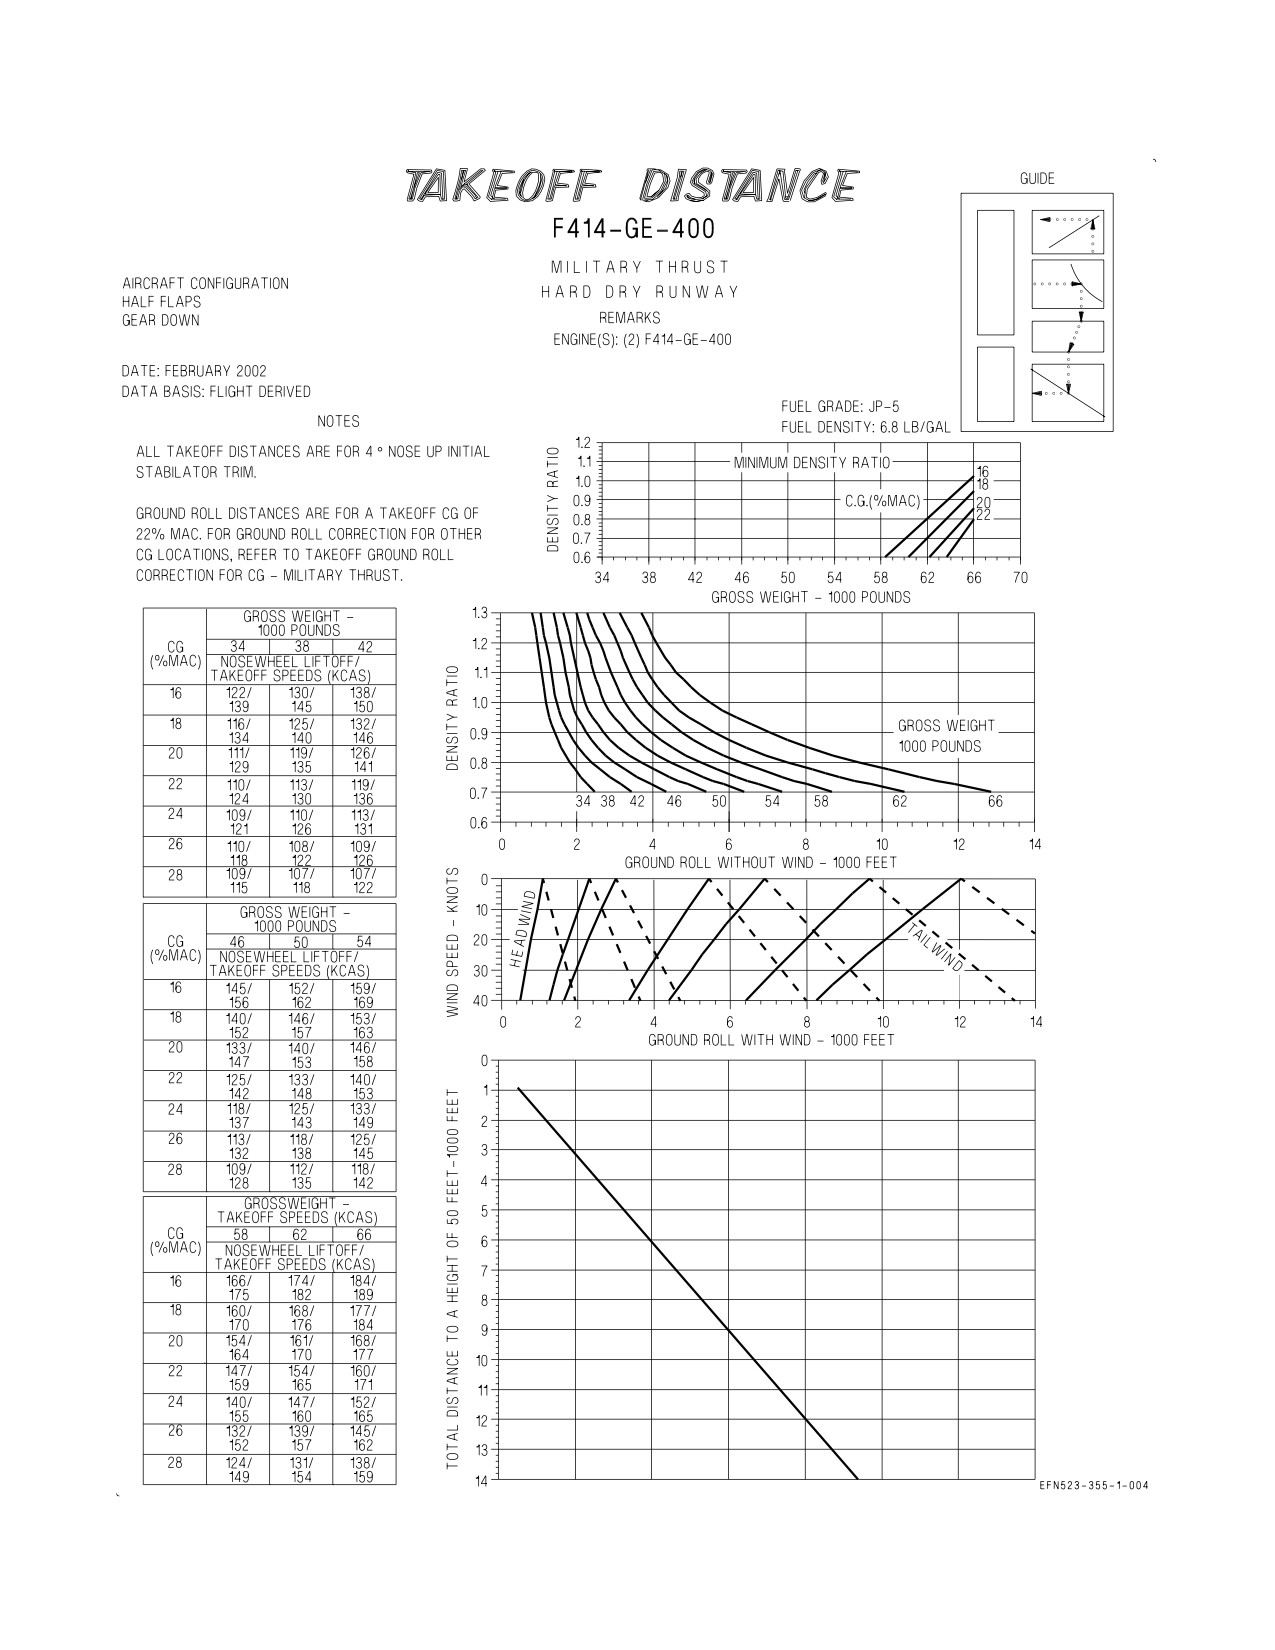
3.6 TAKEOFF DISTANCE CHARTS
These charts (figures 3-7 and 3-8) are used to determine the no wind ground run distance, wind
adjusted ground run and the total distance to climb to a height of 50 feet. Separate charts are provided
for maximum and military thrust. A table has been provided on each chart to show nosewheel liftoff
speed with the corresponding aircraft takeoff speed for various gross weight and CG combinations.
3.6.1 Use. Enter the density ratio plot with the gross weight and project vertically up to intersect the
appropriate CG curve. From this intersection, project horizontally to the left to read the minimum
allowable density ratio for takeoff at this weight/CG combination.
Enter the chart with the applicable density ratio and project horizontally to the right to intersect the
appropriate takeoff gross weight curve. From this intersection, project vertically down to read no wind
ground run distance. Parallel the appropriate wind guideline (headwind or tailwind) to intersect the
takeoff wind velocity. From this point project vertically down to read ground run adjusted for wind
effects. To find the total distance required to climb to a height of 50 feet, continue down to the reflector
line and project horizontally to the left scale.
XI-3-6
ORIGINAL
A1-F18EA-NFM-200
3.6.2 Sample Problem. Maximum Thrust Takeoff CG - 22% MAC.
A. Gross weight
58,000 lbs.
G. Effective headwind
10 knots
B. CG
18% MAC
H. Ground run (wind corrected)
2500 feet
C. Minimum density ratio
0.66
I. Total distance required to climb
3800 feet
(Applicable density ratio > Minimum
to a height of 50 feet
density ratio)
J. Nosewheel liftoff speed for a
153 KCAS
D. Density ratio
0.90
CG of 22% MAC (from table)
E. Gross weight
58,000 lbs.
K. Takeoff speed (from table)
167 KCAS
F. No wind ground run distance
2800 feet
XI-3-7
ORIGINAL
A1-F18EA-NFM-200
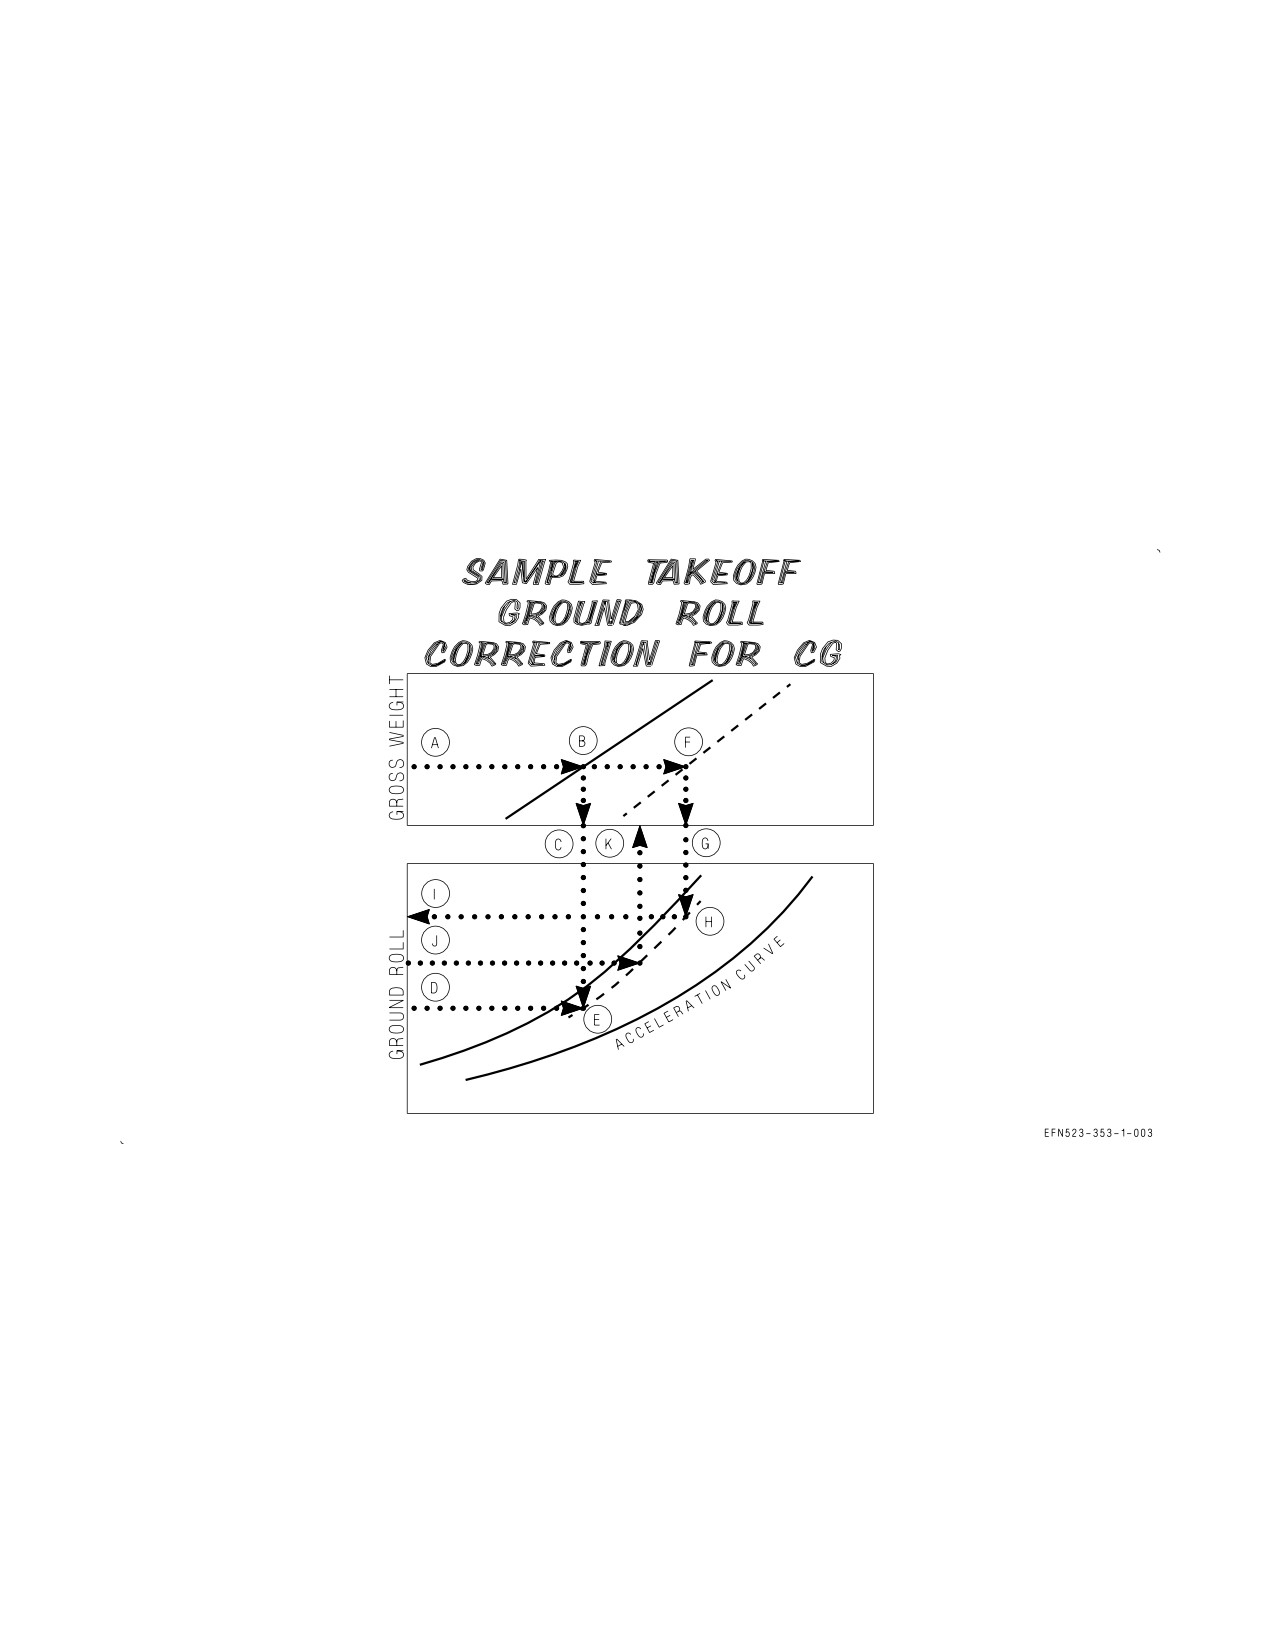
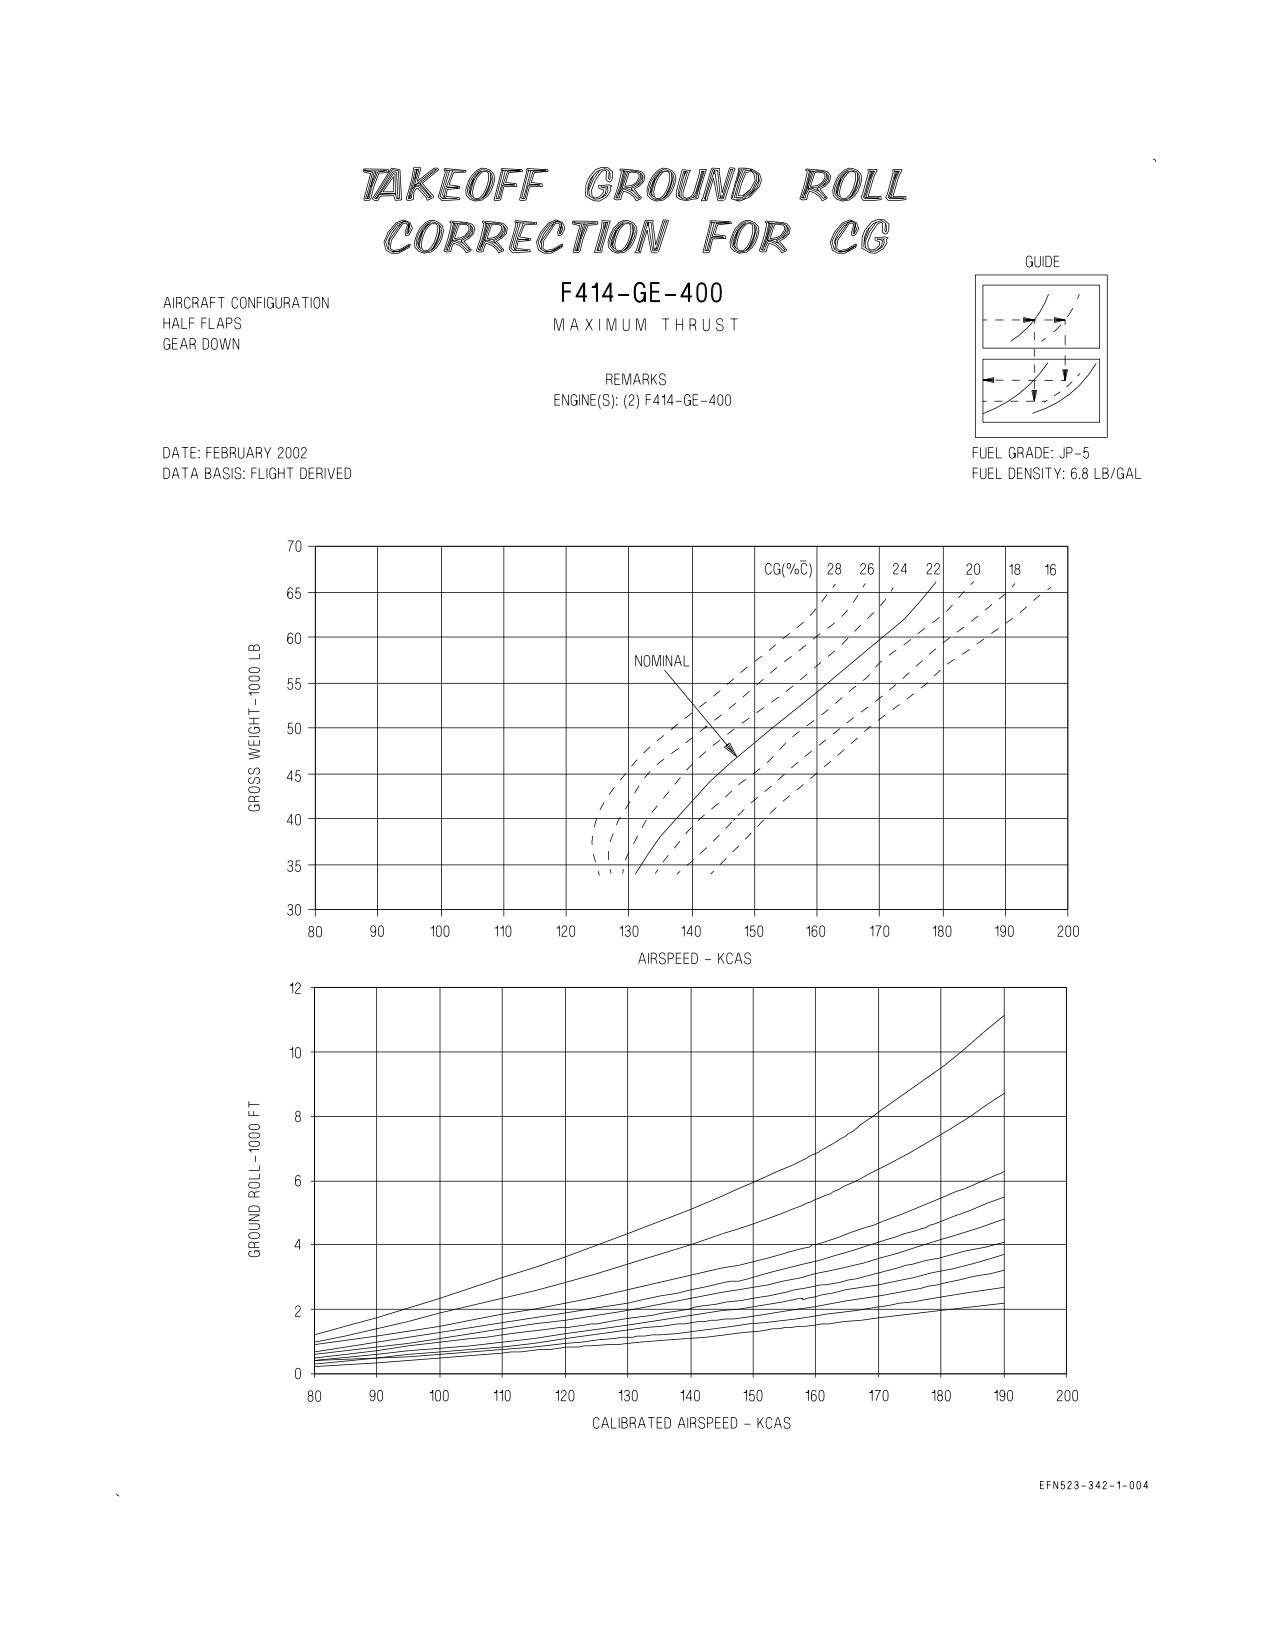
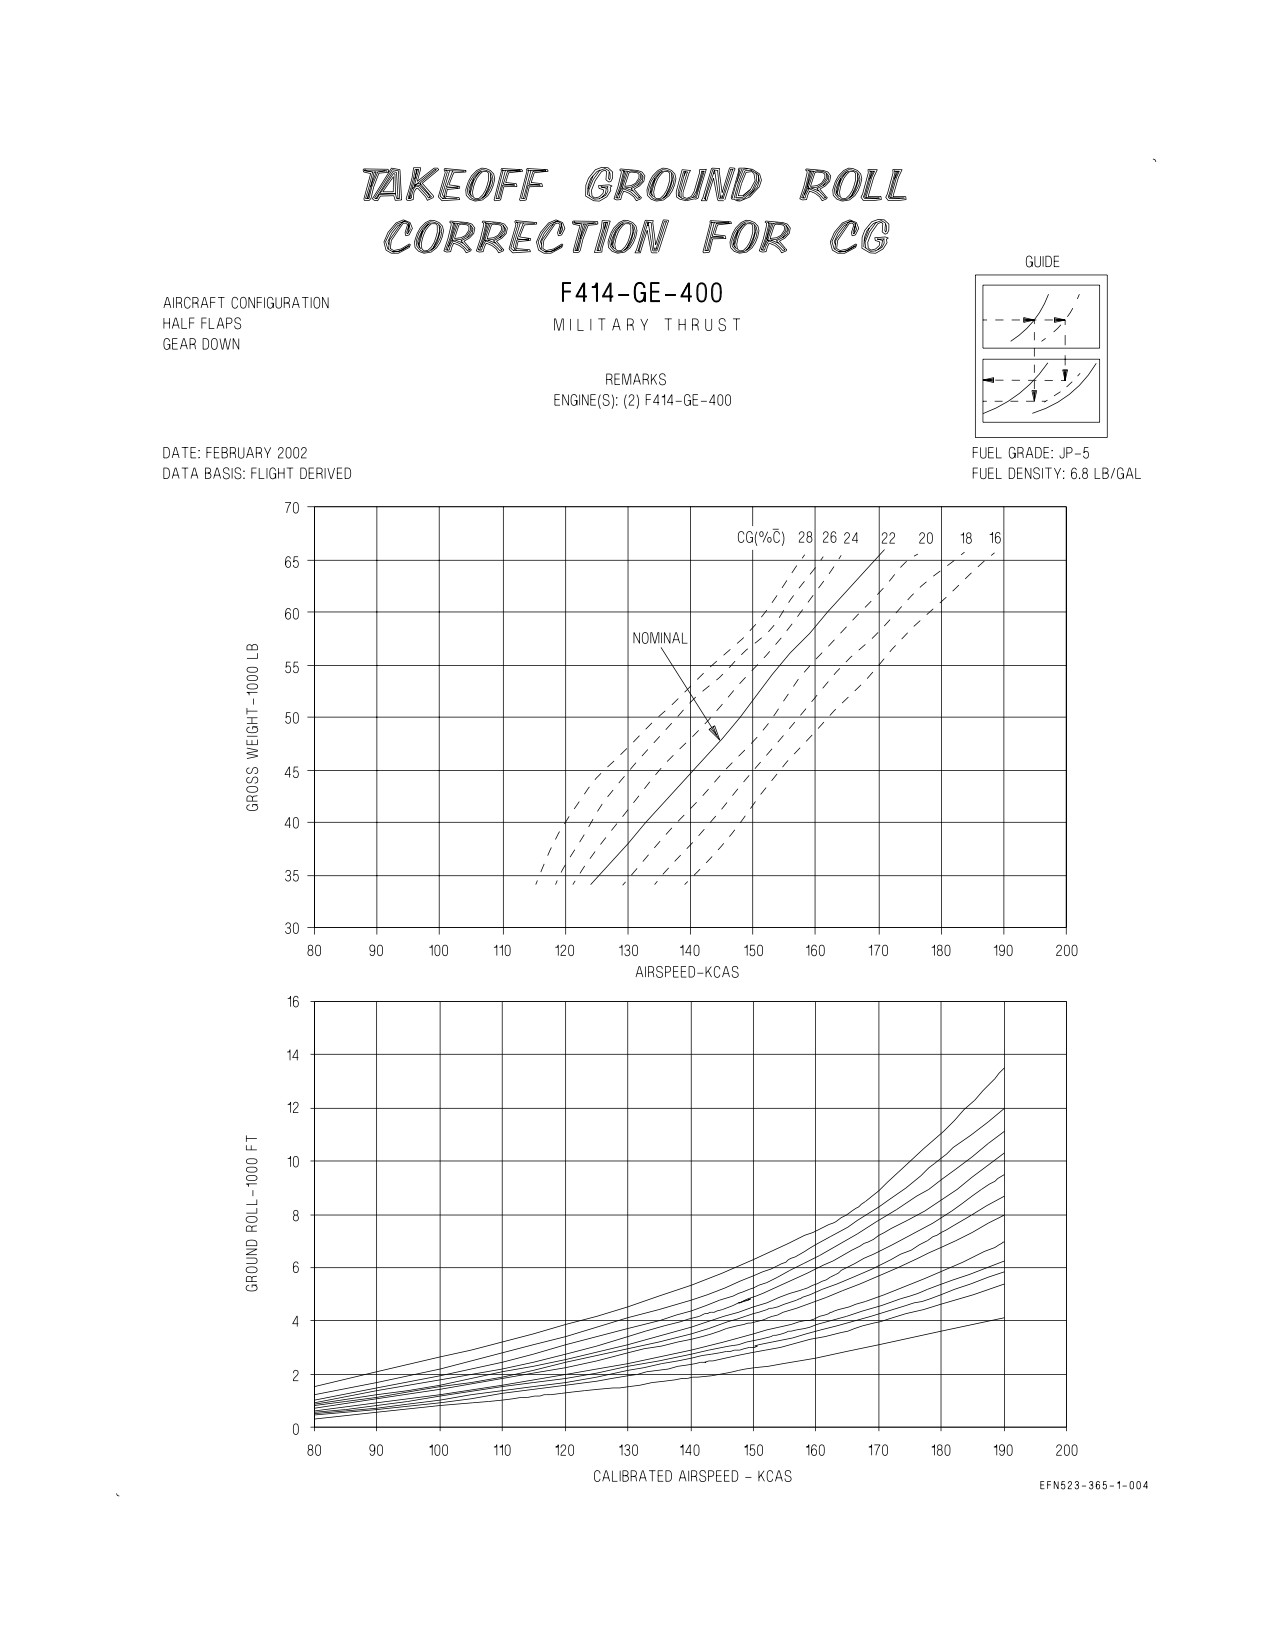
3.7 TAKEOFF GROUND ROLL CORRECTION FOR CG CHARTS
These charts (figures 3-9 and 3-10) are used primarily to determine takeoff distances resulting from
adverse conditions of gross weight and CG. The charts can also be used to obtain any distance and
speed relationship during the takeoff ground run.
3.7.1 Use. Enter the chart with the applicable takeoff gross weight and project horizontally right to
intersect the normal CG curve, then project vertically down. The vertical projection passes through the
normal CG takeoff speed. Reenter the chart with the normal no wind ground run (from Takeoff
Distance chart) and project horizontally right to intersect the vertical projection from the normal CG
curve. From this intersection, parallel the nearest acceleration guideline. Return to the gross
weight-normal CG intersection and project further right to the actual takeoff CG curve, then vertically
down to intersect the new acceleration curve. The vertical projection passes through the actual CG
takeoff speed. From this intersection, project horizontally left to ground run corrected for CG. To
determine wind effect on ground run and total distance to height of 50 feet, reenter appropriate takeoff
distance chart with corrected ground roll. The nosewheel liftoff speed can be determined in the takeoff
distance chart by interpolation in the speed table using gross weight and CG. To determine speed at
a given distance on the takeoff run, enter the chart at the ground run distance and project horizontally
to the reference acceleration curve. Then project vertically up to the corresponding speed.
XI-3-8
ORIGINAL
A1-F18EA-NFM-200
3.7.2 Sample Problem. Maximum Thrust Takeoff CG - 22% MAC.
A. Gross weight
58,000 lbs.
B. Normal CG
22% MAC
C. Normal CG takeoff speed
167 KCAS
D. Normal no wind ground run
2800 Ft.
(from Takeoff Distance chart)
E. Parallel acceleration guideline
F. Takeoff CG
18% MAC
G. 20% MAC takeoff speed
178 KCAS
H. Intersection of new acceleration curve
I. Ground run corrected for CG
3400 Ft.
J. Given distance on ground run
2000 Ft.
K. Corresponding ground run speed
142 KCAS
XI-3-9
ORIGINAL
A1-F18EA-NFM-200
Figure 3-1. Wind Components
XI-3-10
ORIGINAL
A1-F18EA-NFM-200
Figure 3-2. Density Ratio
XI-3-11
ORIGINAL
A1-F18EA-NFM-200
Figure 3-3. Minimum Go Speed - Maximum Thrust
XI-3-12
ORIGINAL
A1-F18EA-NFM-200
Figure 3-4. Minimum Go Speed - Military Thrust
XI-3-13
ORIGINAL
A1-F18EA-NFM-200
Figure 3-5. Maximum Abort Speed - Maximum Thrust
XI-3-14
ORIGINAL
A1-F18EA-NFM-200
Figure 3-6. Maximum Abort Speed - Military Thrust
XI-3-15
ORIGINAL
A1-F18EA-NFM-200
Figure 3-7. Takeoff Distance - Maximum Thrust
XI-3-16
ORIGINAL
A1-F18EA-NFM-200
Figure 3-8. Takeoff Distance - Military Thrust
XI-3-17
ORIGINAL
A1-F18EA-NFM-200
Figure 3-9. Takeoff Ground Roll Correction for CG - Maximum Thrust
XI-3-18
ORIGINAL
A1-F18EA-NFM-200
Figure 3-10. Takeoff Ground Roll Correction for CG - Military Thrust
XI-3-19 (Reverse Blank)
ORIGINAL
A1-F18EA-NFM-200
CHAPTER 4
Climb
F414-GE-400
4.1 TAKEOFF ALLOWANCES CHART
The takeoff allowances and acceleration to climb speed chart (figure 4-1) presents fuel usage during
start, taxi, engine run-up. This chart is used to determine fuel, time and distance data from brake
release to 350 KIAS or climb speed.
4.2 CLIMB PERFORMANCE CHARTS
Climb charts present the military thrust climb performance for two-engine operation. Climb charts
are also included to present the maximum thrust climb performance for two-engine operation. These
charts are used to obtain climb data after takeoff to selected altitude in a gear-up and flaps-up
configuration.
4.2.1 Military Thrust Climb. Military thrust climb charts (figures 4-2 thru 4-6) are provided for two
engine operation, single engine operation, and various drag indexes and gross weights. The data
includes climb speed schedule; combat ceiling and service ceiling; optimum cruise altitude; and
separate charts for time, fuel, and distance required to climb from sea level to selected altitude at climb
speed schedule. Also provided are data for peak rate of climb (figure 4-7).
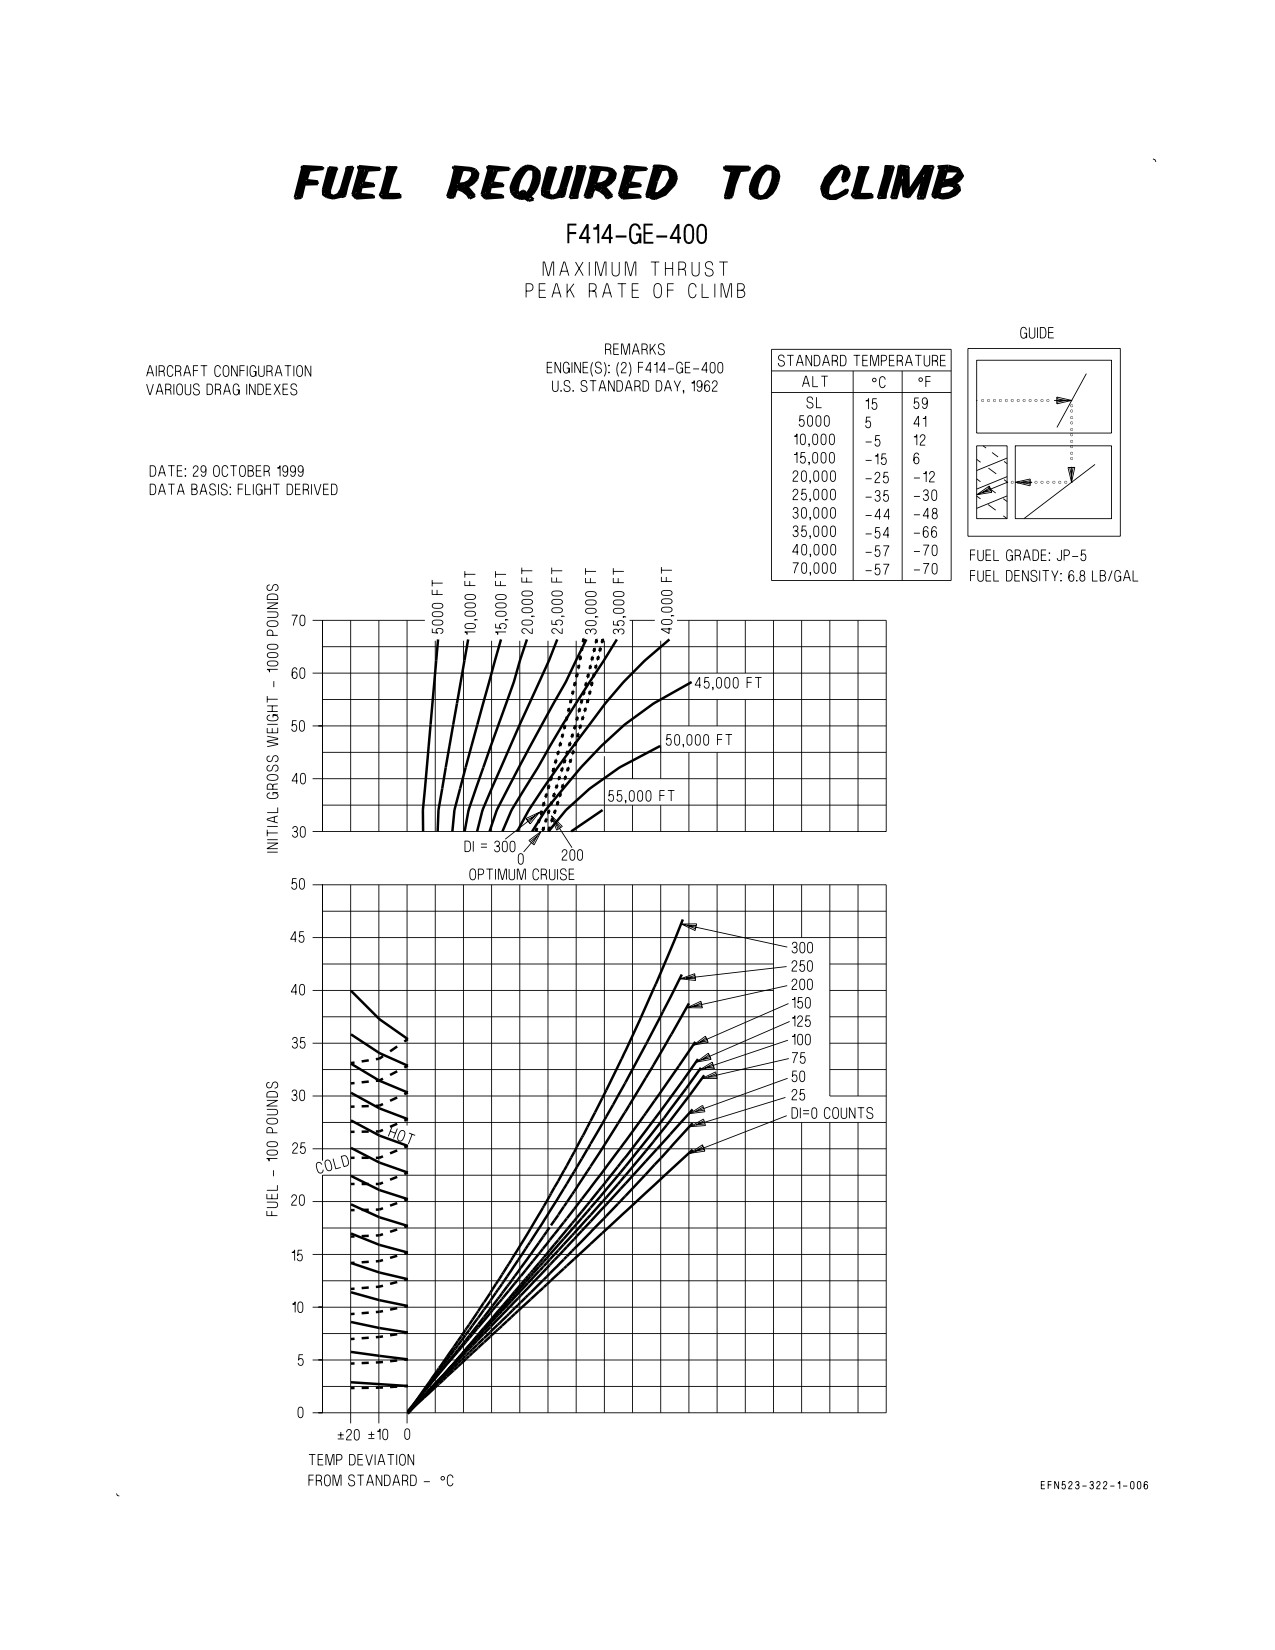
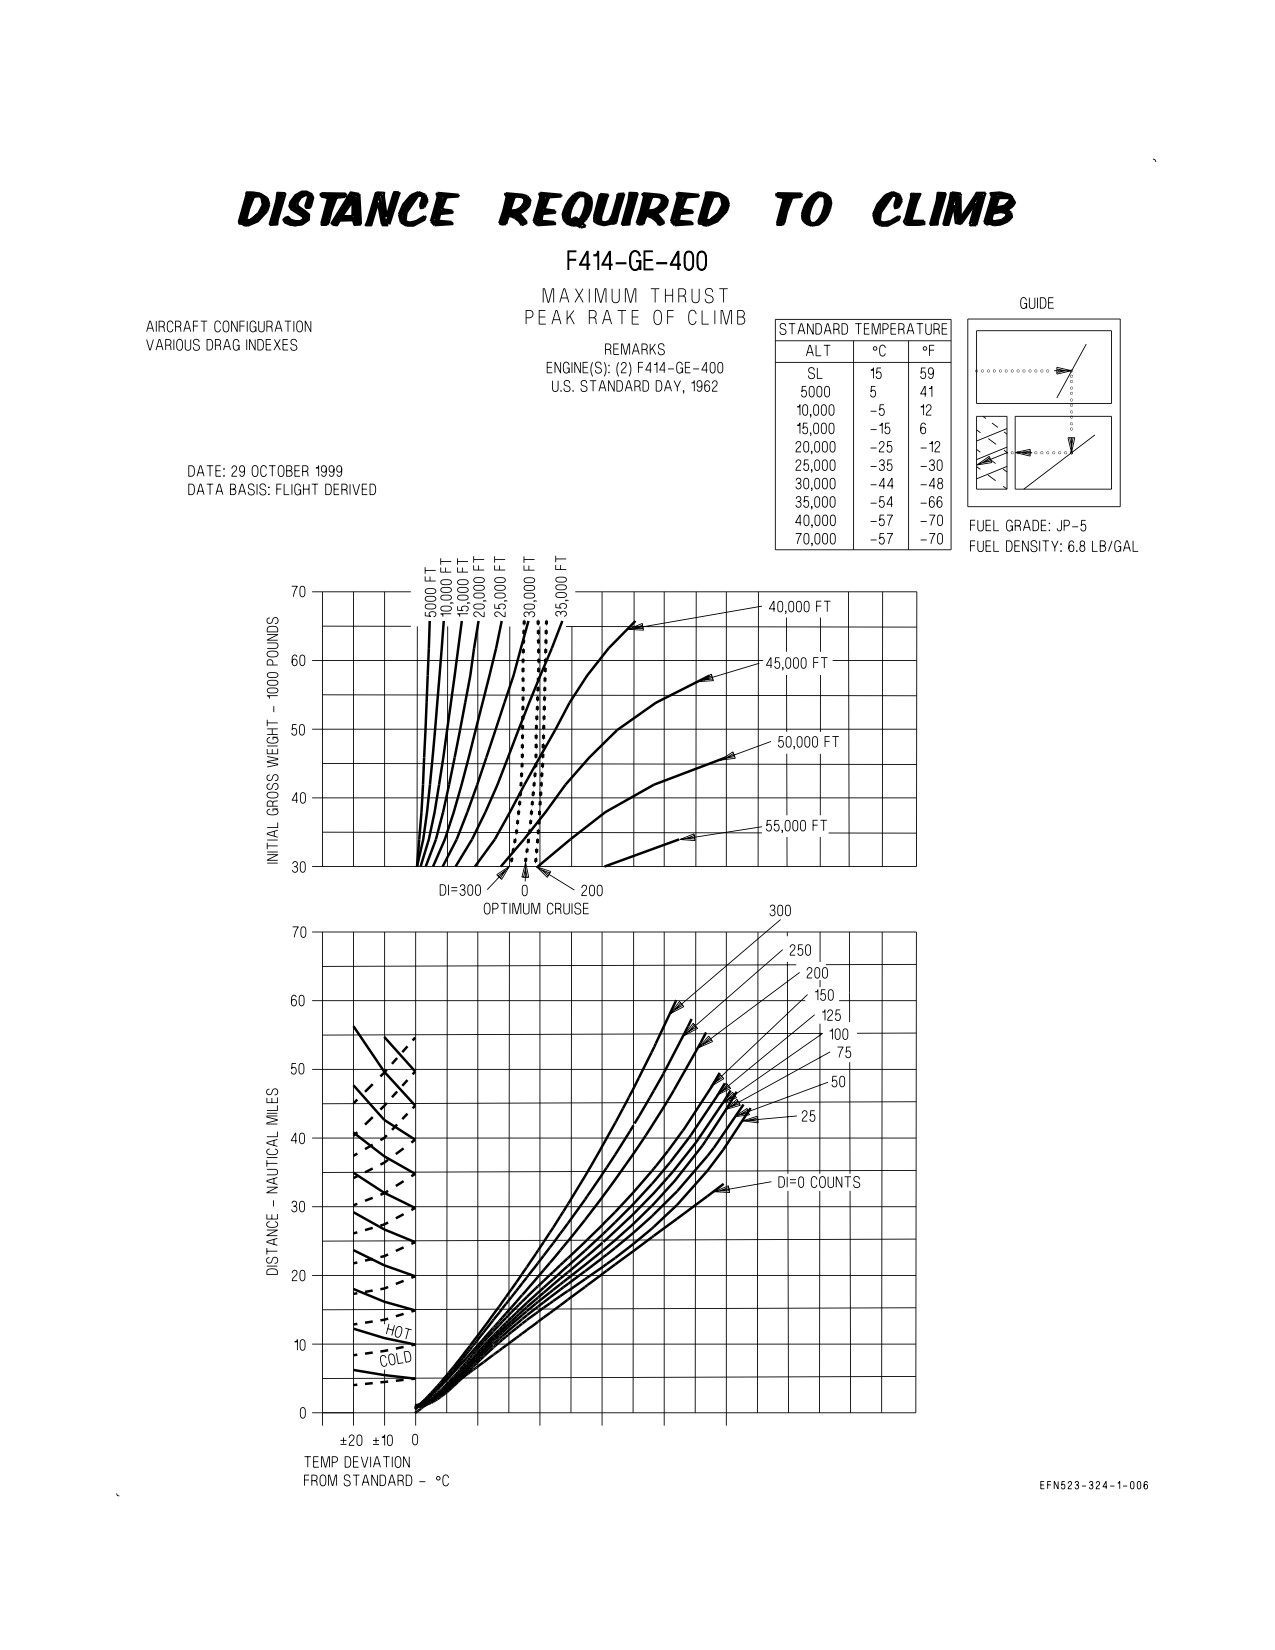
4.2.2 Maximum Thrust Climb. Maximum thrust climb charts for two-engine operation (figure 4-8)
are provided for various drag indexes and gross weights. The data include peak rate of climb Mach
number; combat ceiling; and separate charts for time, fuel, and distance required to climb from sea
level to selected altitude at peak rate of climb.
4.2.3 Use. CLIMB SPEED SCHEDULE - From the appropriate drag index column determine the
optimum climb speed (calibrated airspeed to constant Mach number) for the selected climb altitude.
The preclimb fuel requirements should be noted if the takeoff acceleration phase is to be considered
in the climb planning.
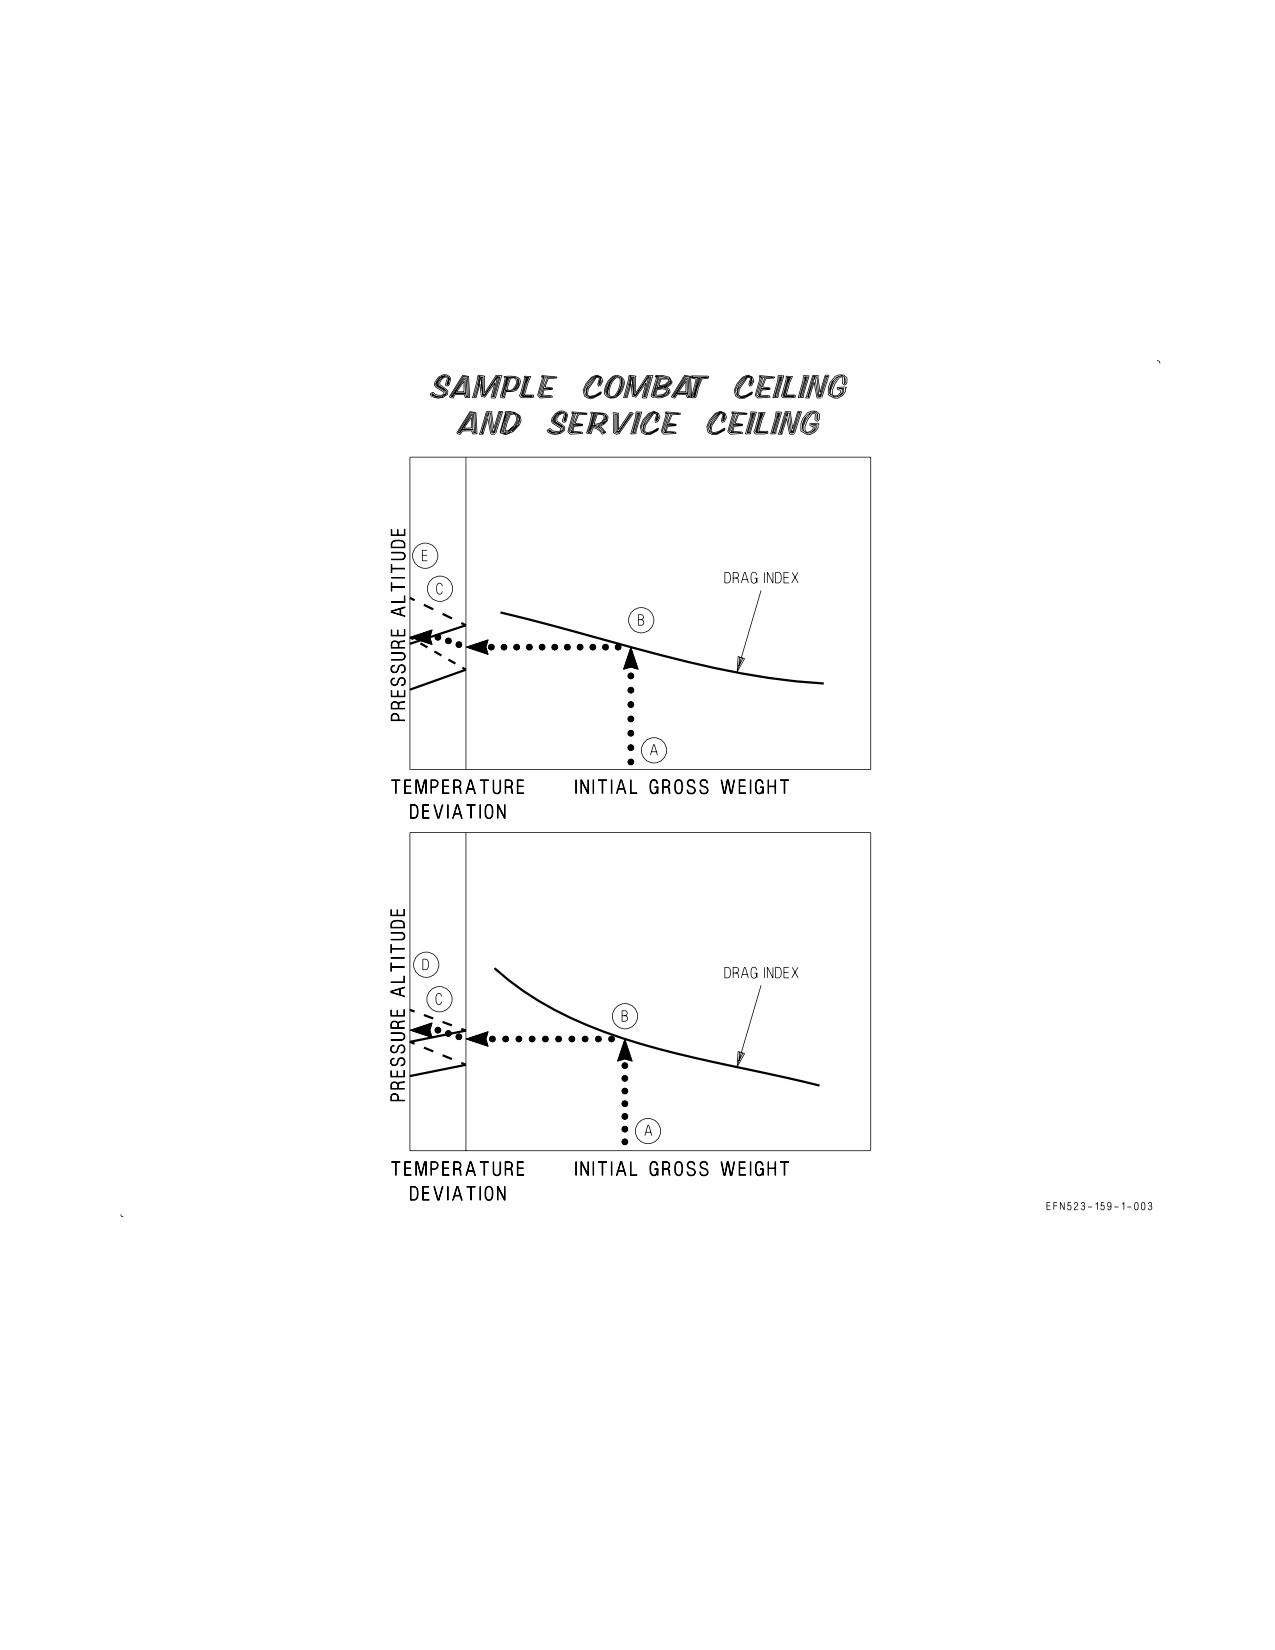
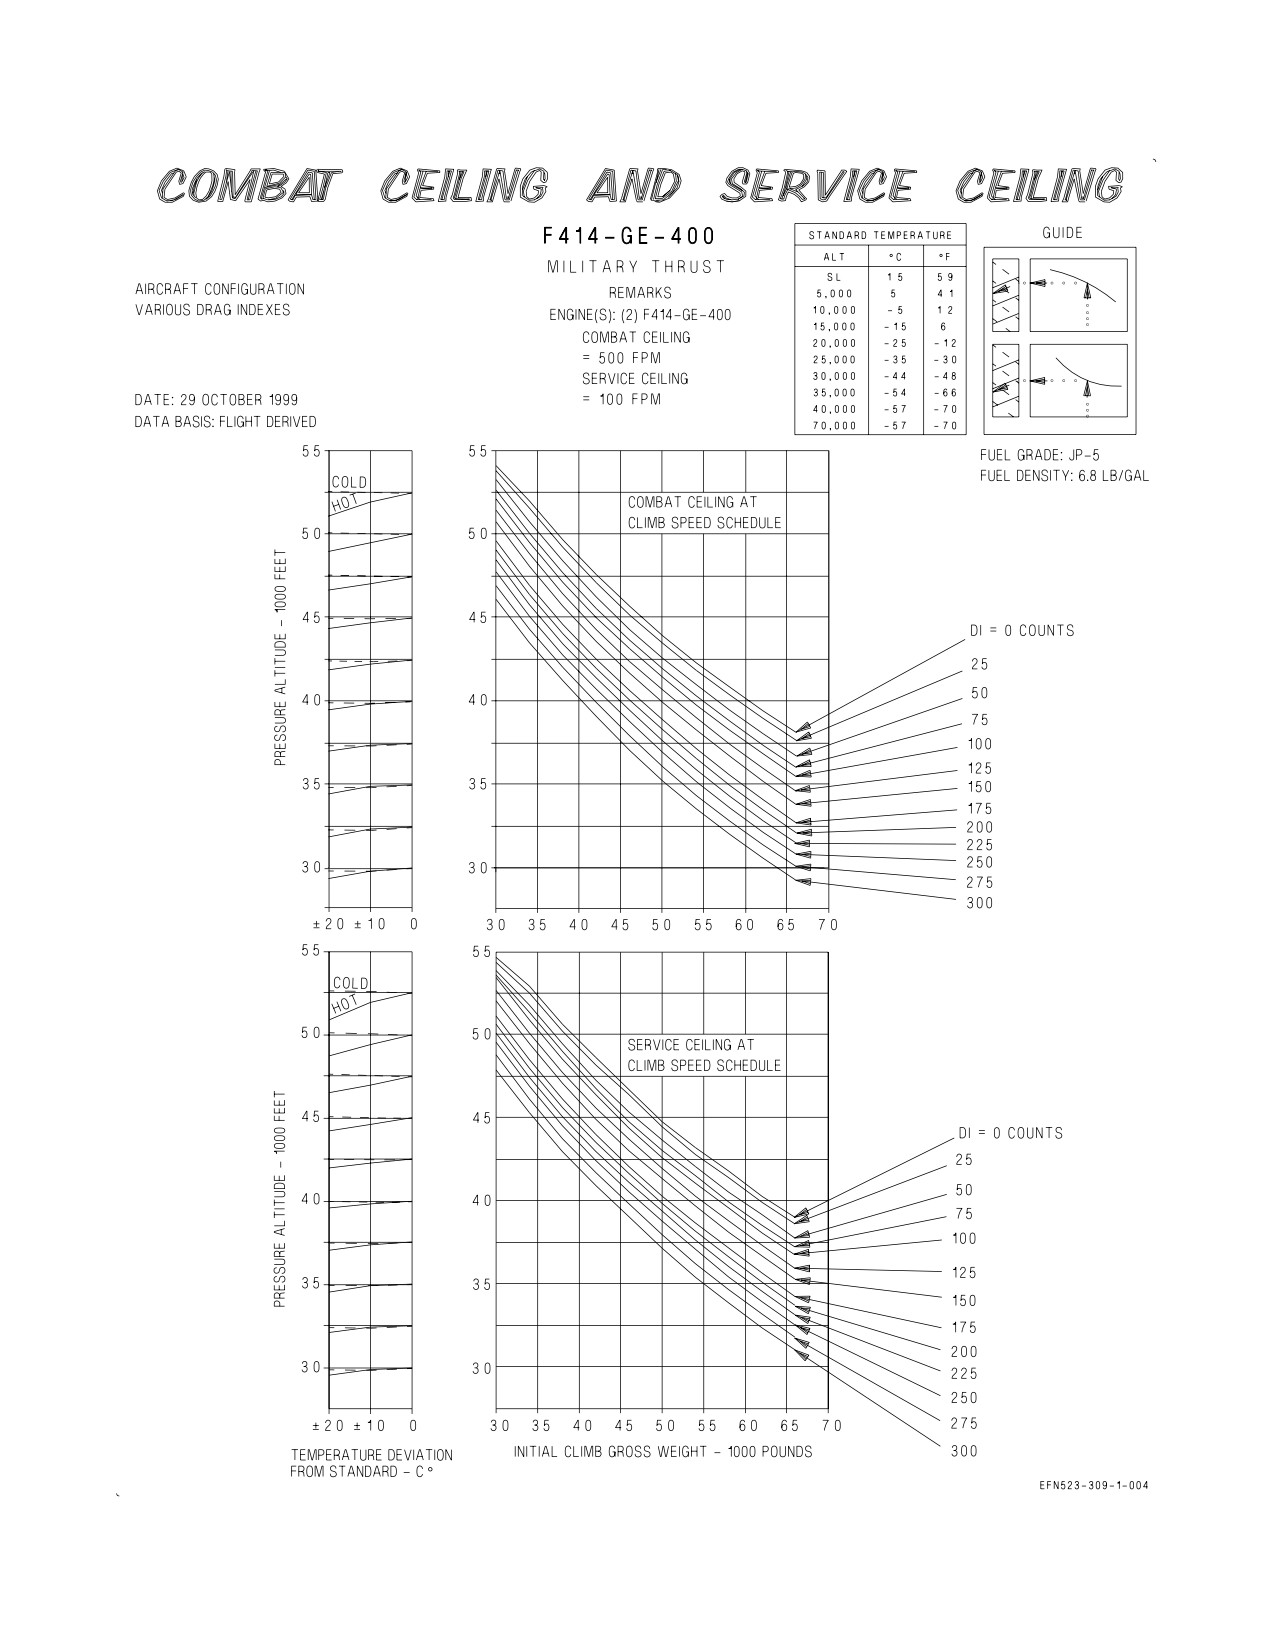
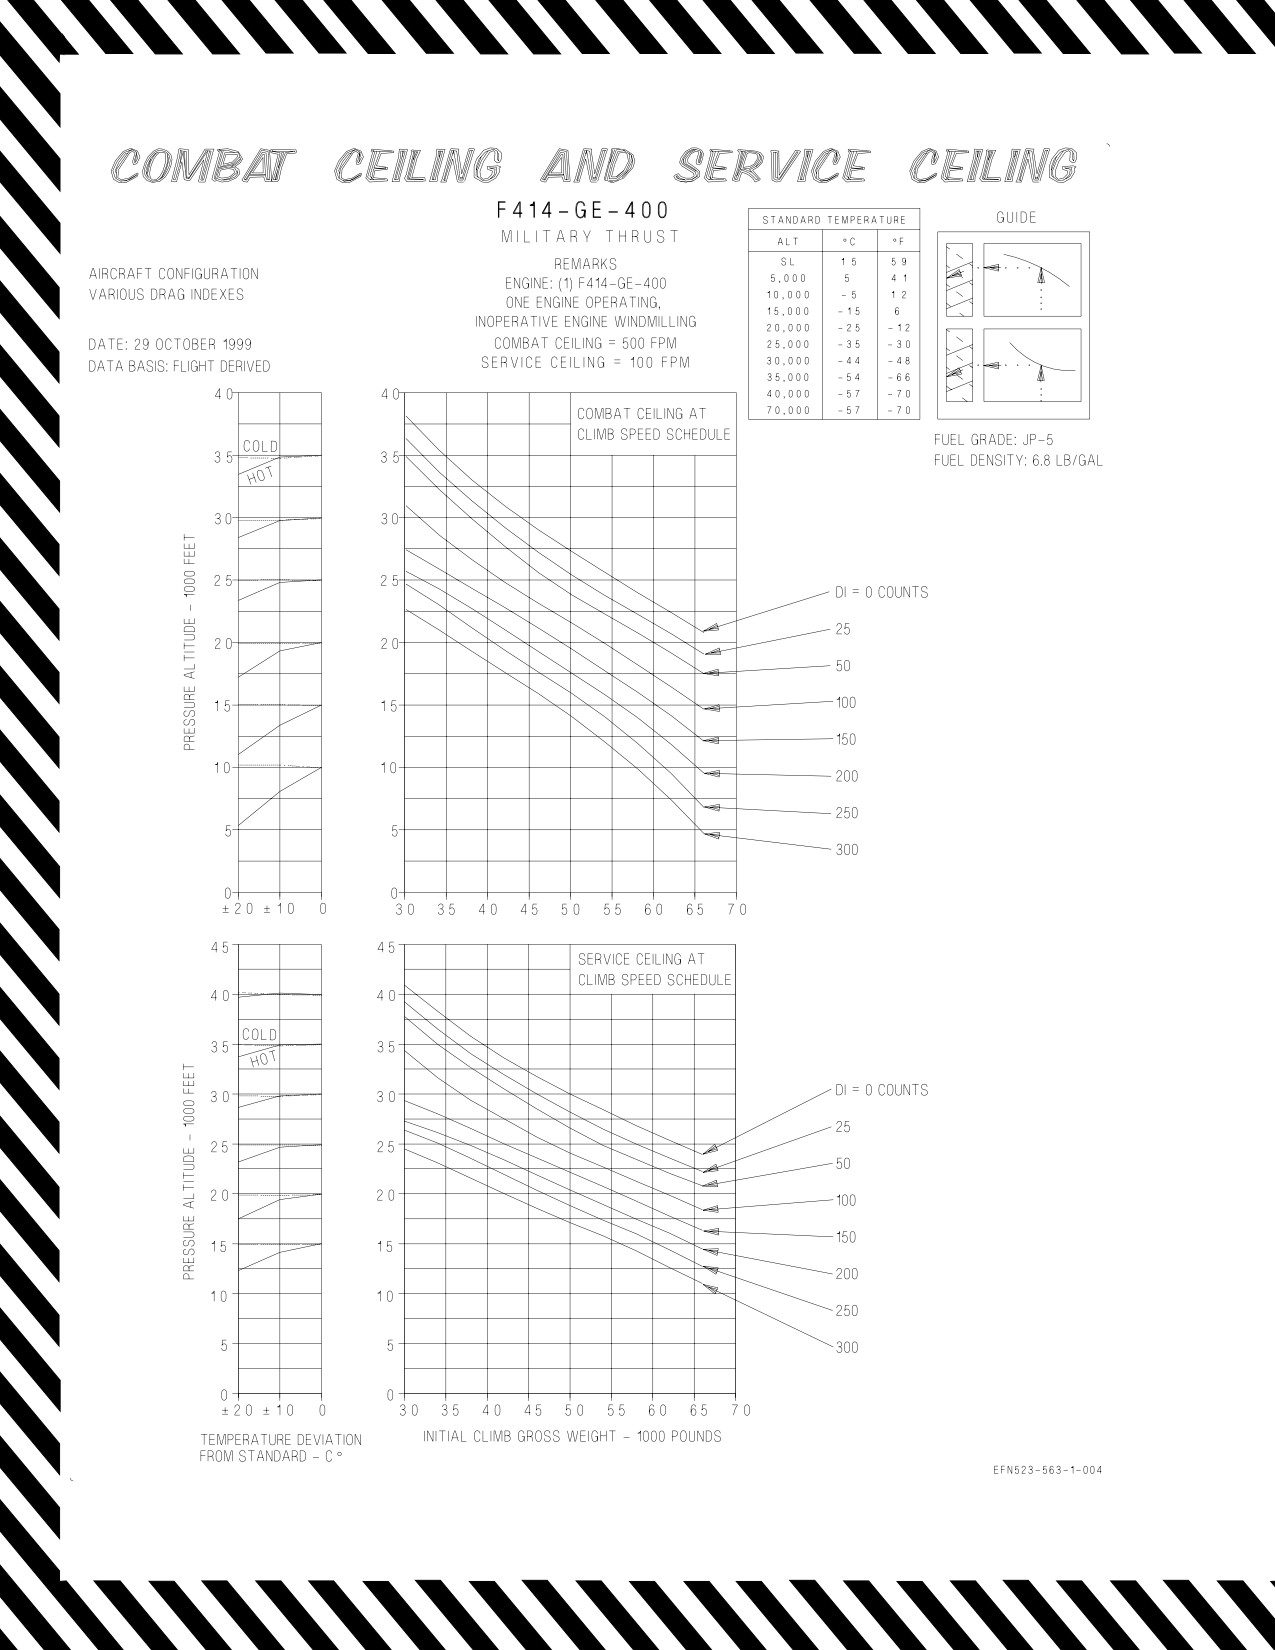
COMBAT CEILING AND SERVICE CEILING - Enter the chart with the initial climb gross weight
and project vertically up to the appropriate drag index curve, then horizontally left to the temperature
baseline and parallel the appropriate temperature deviation guideline to the correct temperature
deviation. Project horizontally left to find the service ceiling and the combat ceiling for initial climb
gross weight.
XI-4-1
ORIGINAL
A1-F18EA-NFM-200
4.2.4 Sample Problem. Combat Ceiling and Service Ceiling (figure 4-2, sheet 2).
A. Initial gross weight
44,000 Lb.
B. Drag Index
100
C. Temperature deviation
-10°C
from standard day
D. Service ceiling
45,400 Ft.
E. Combat ceiling
44,050 Ft.
XI-4-2
ORIGINAL
A1-F18EA-NFM-200
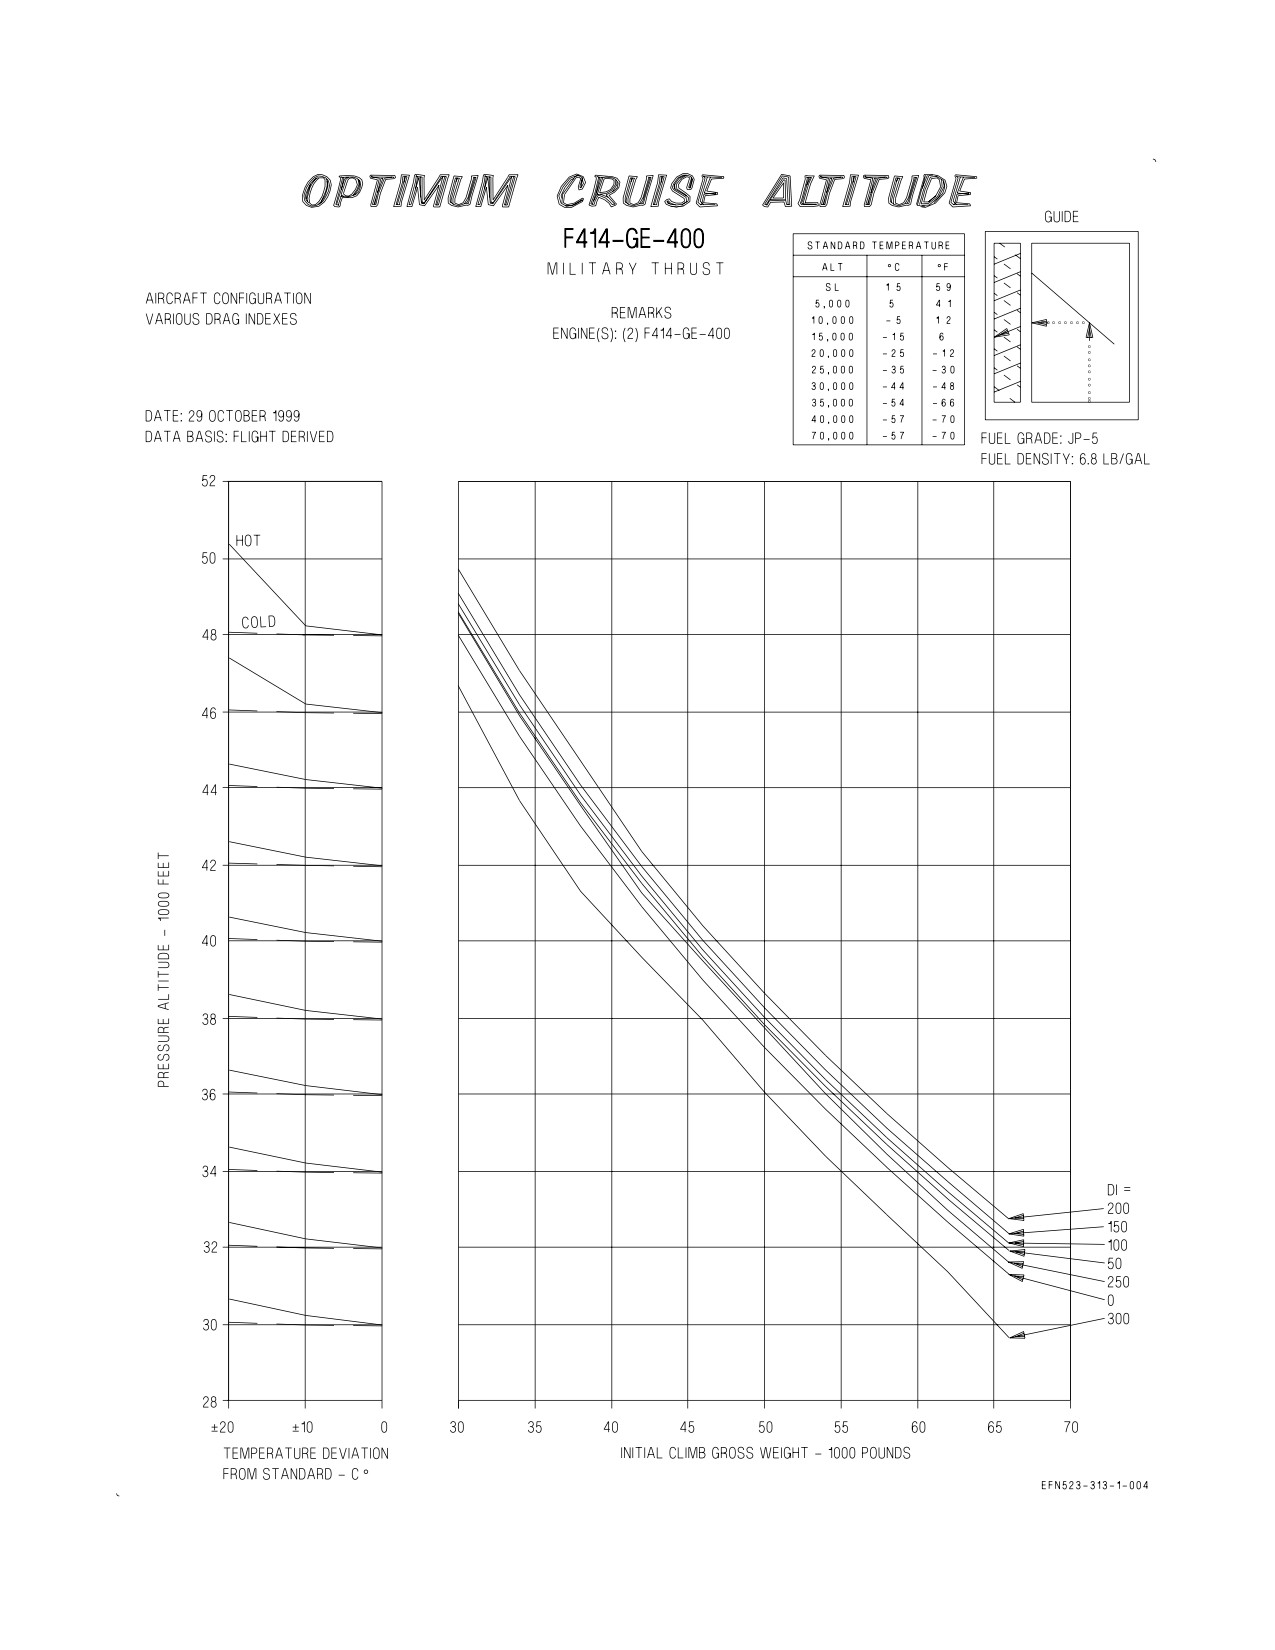
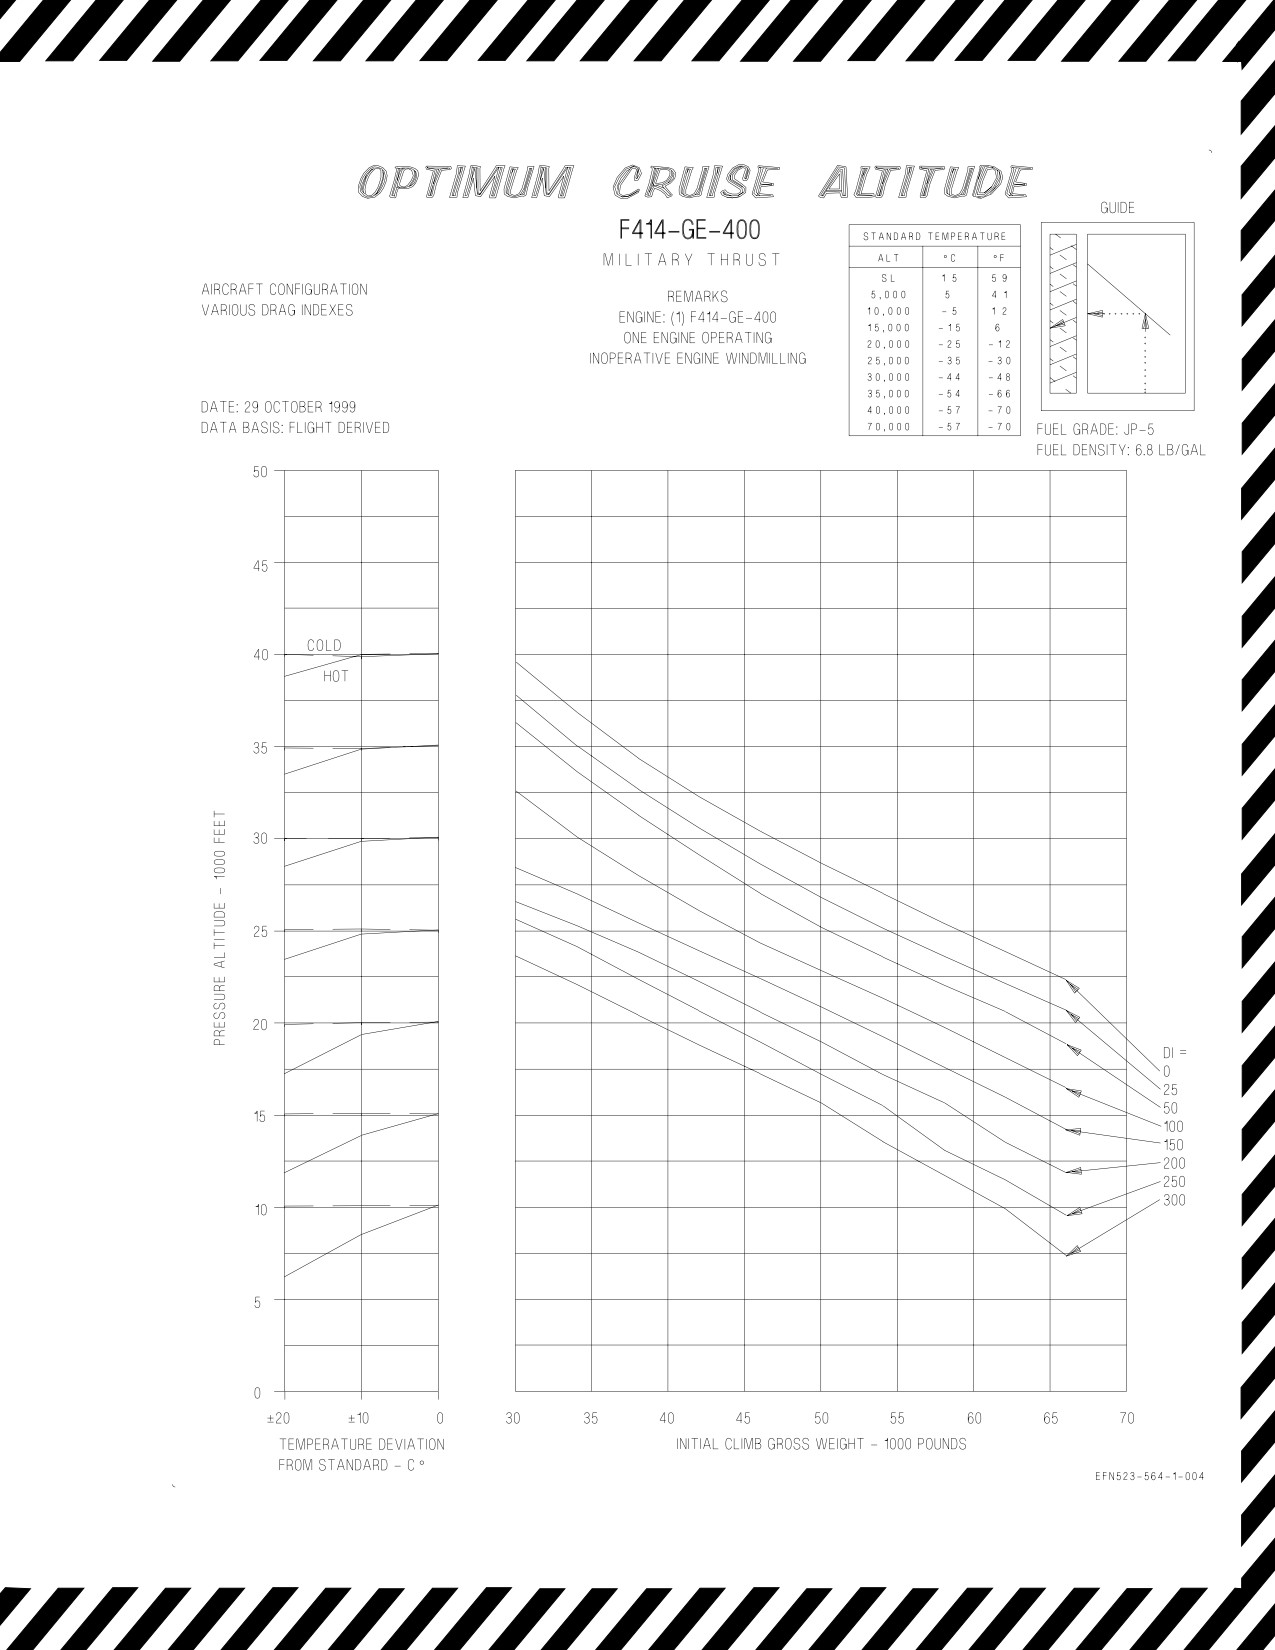
OPTIMUM CRUISE ALTITUDE - Enter the chart with the initial gross weight and project
vertically up to the appropriate drag index curve, then horizontally left to the temperature baseline and
parallel the appropriate temperature deviation guideline to the correct temperature deviation. Project
horizontally left to find the optimum cruise altitude for initial climb gross weight.
Optimum Cruise Altitude (figure 4-2, sheet 3)
A. Initial gross weight
44,000 Lb.
B. Drag Index
100
C. Temperature deviation
-10°C
from standard day
D. Optimum cruise altitude
40,950 Ft.
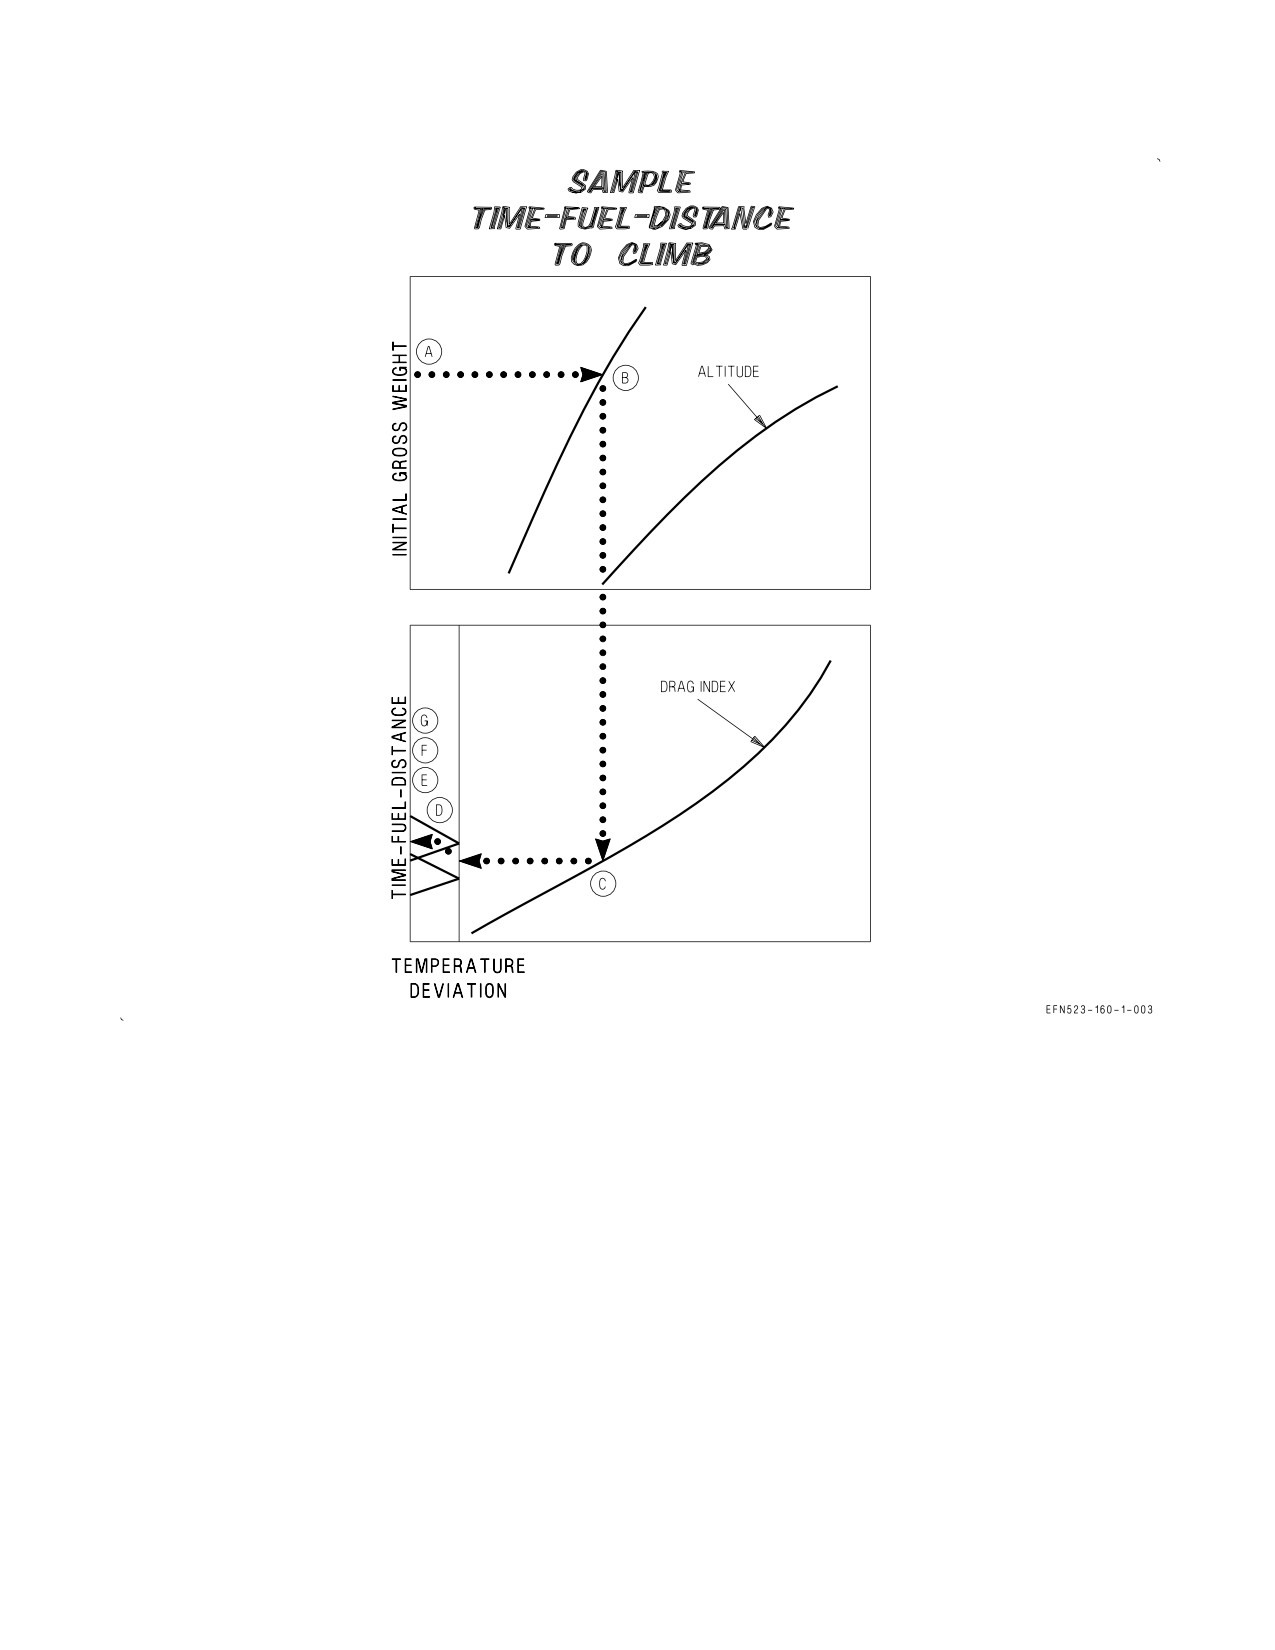
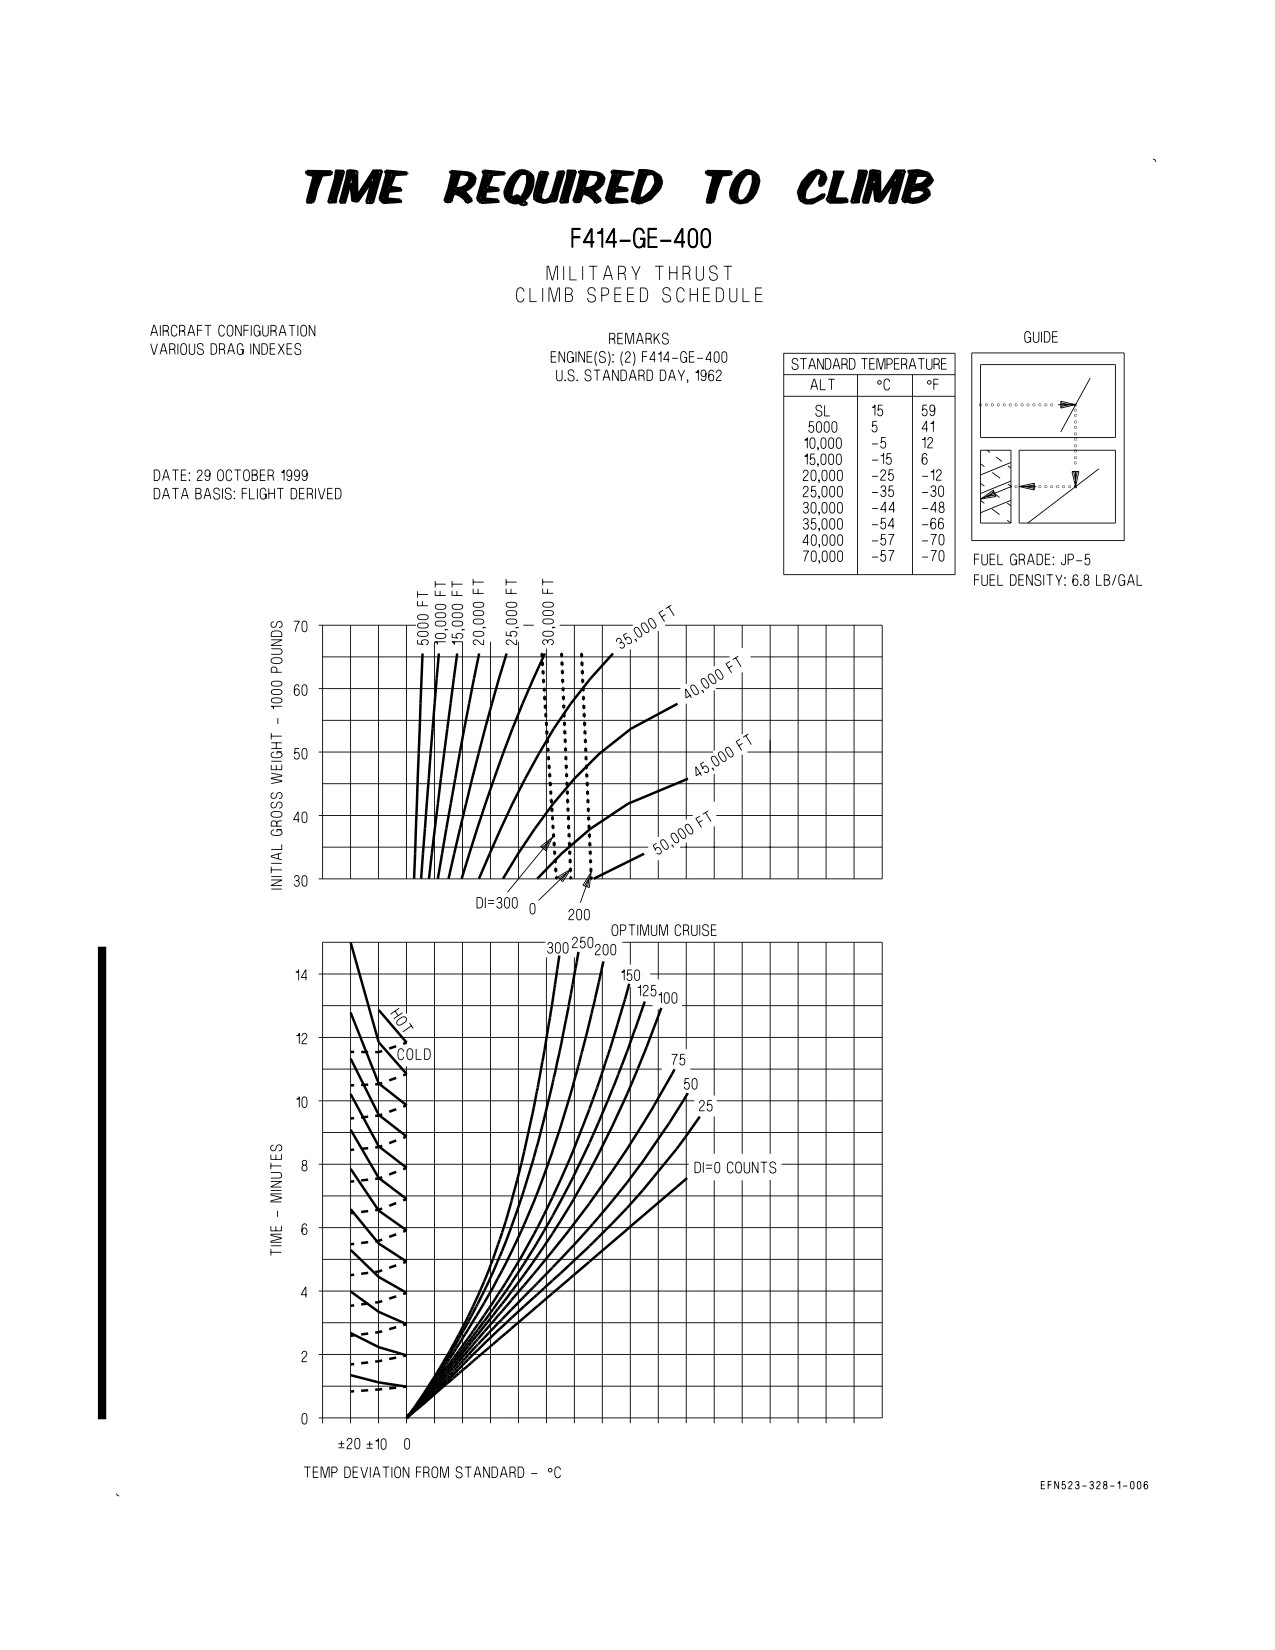
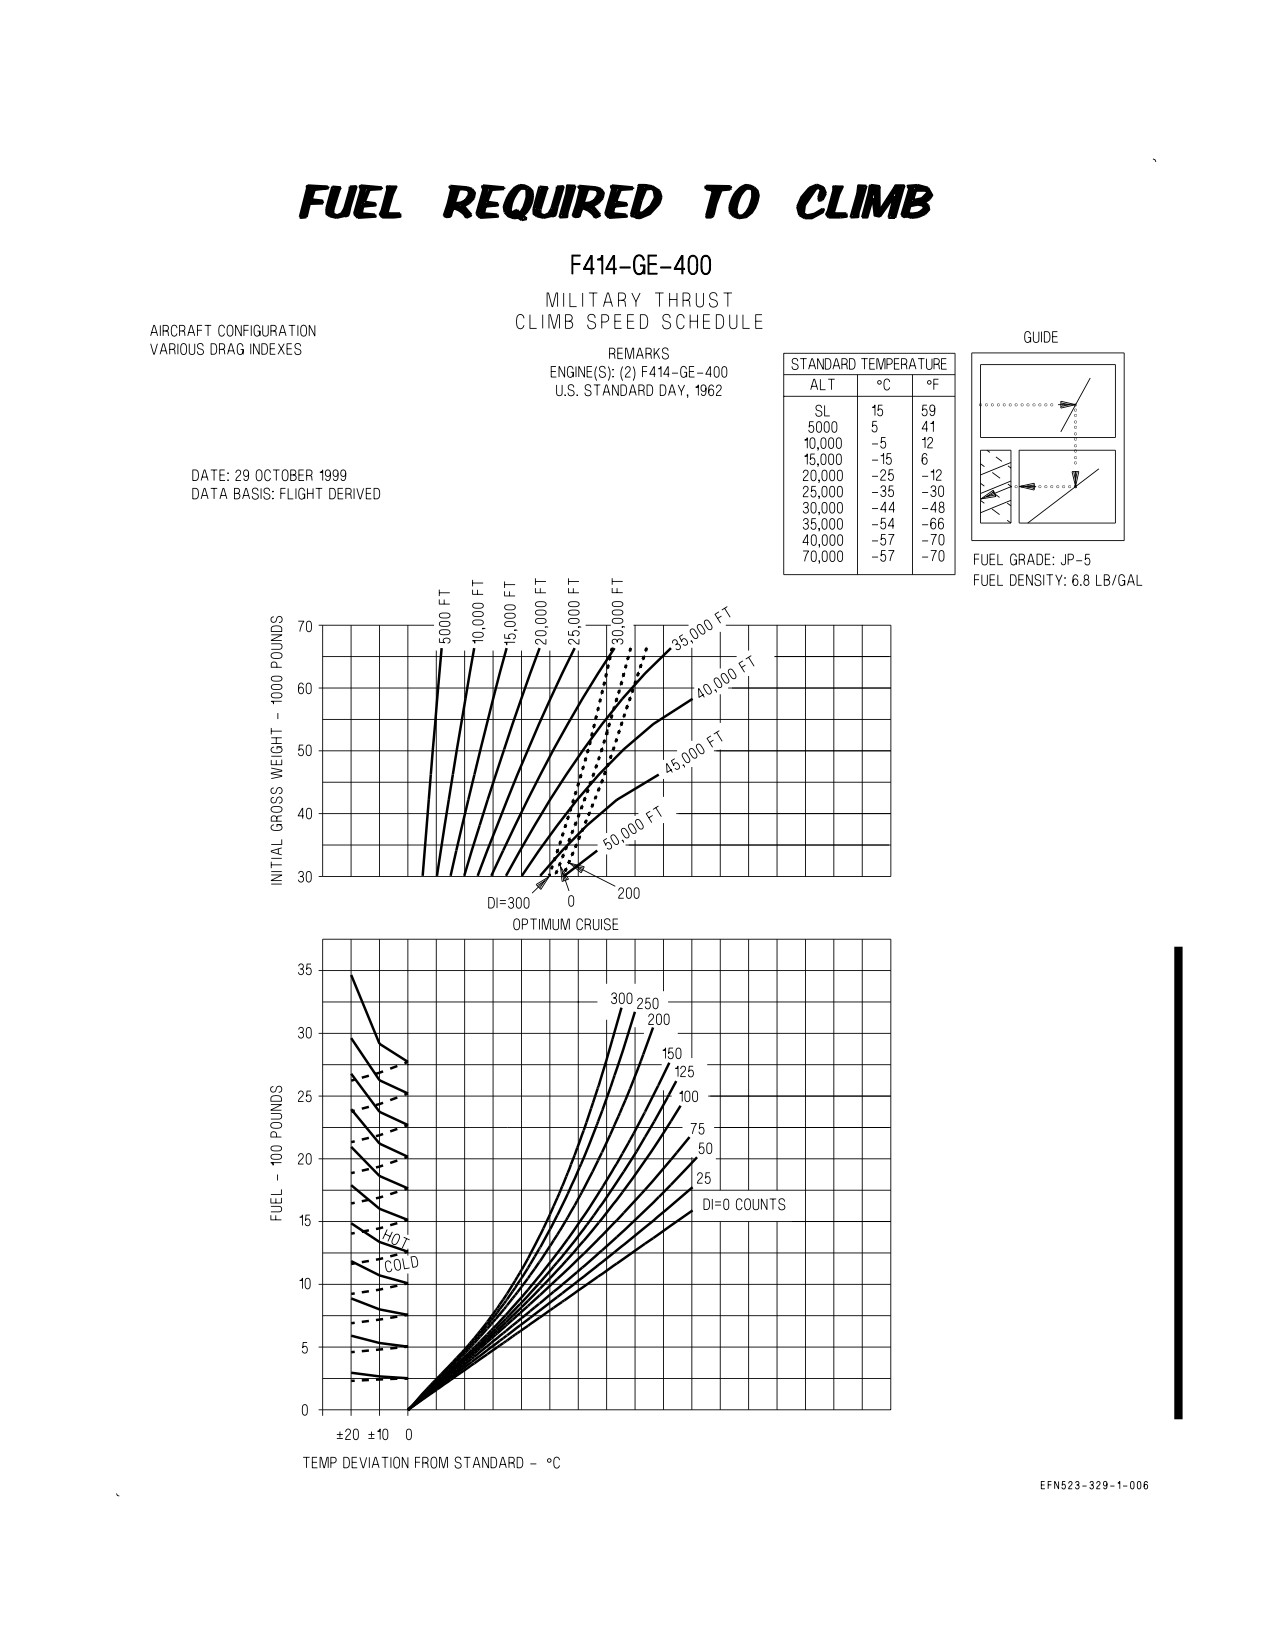
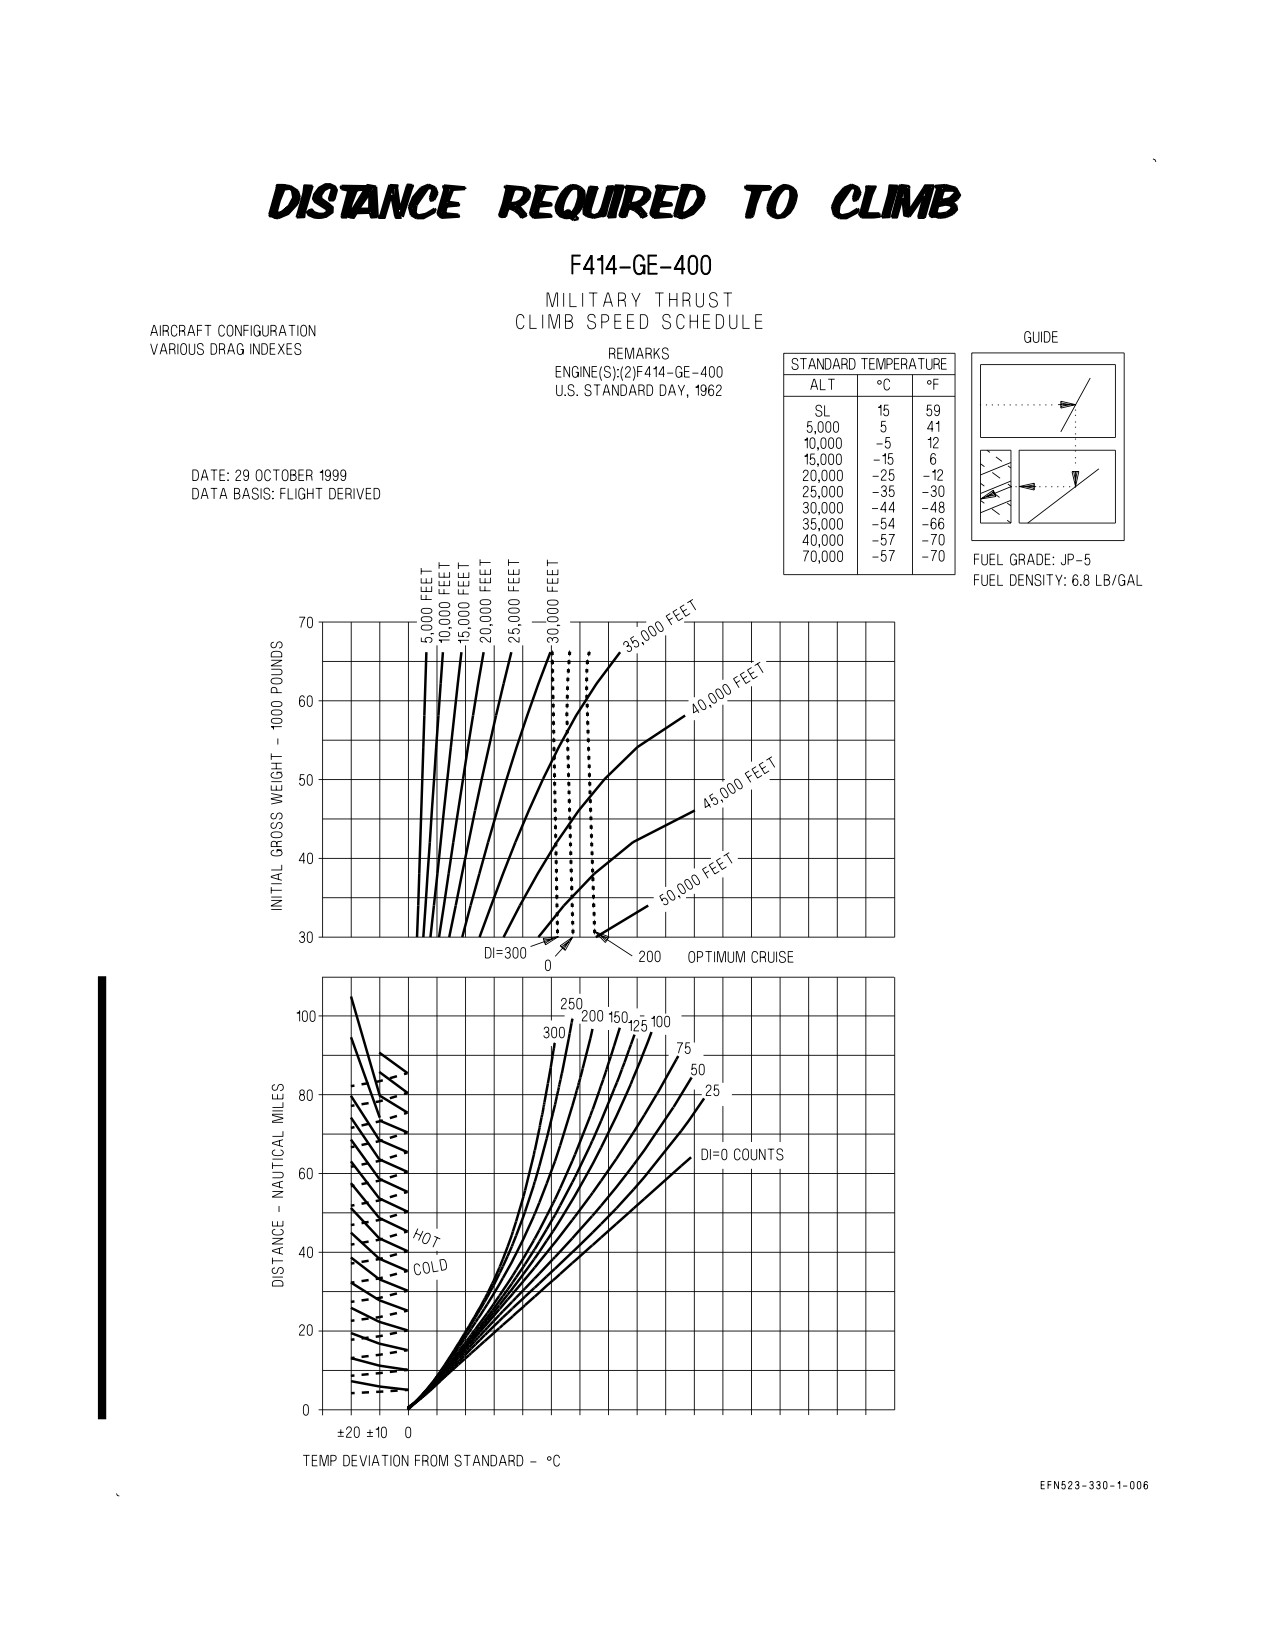
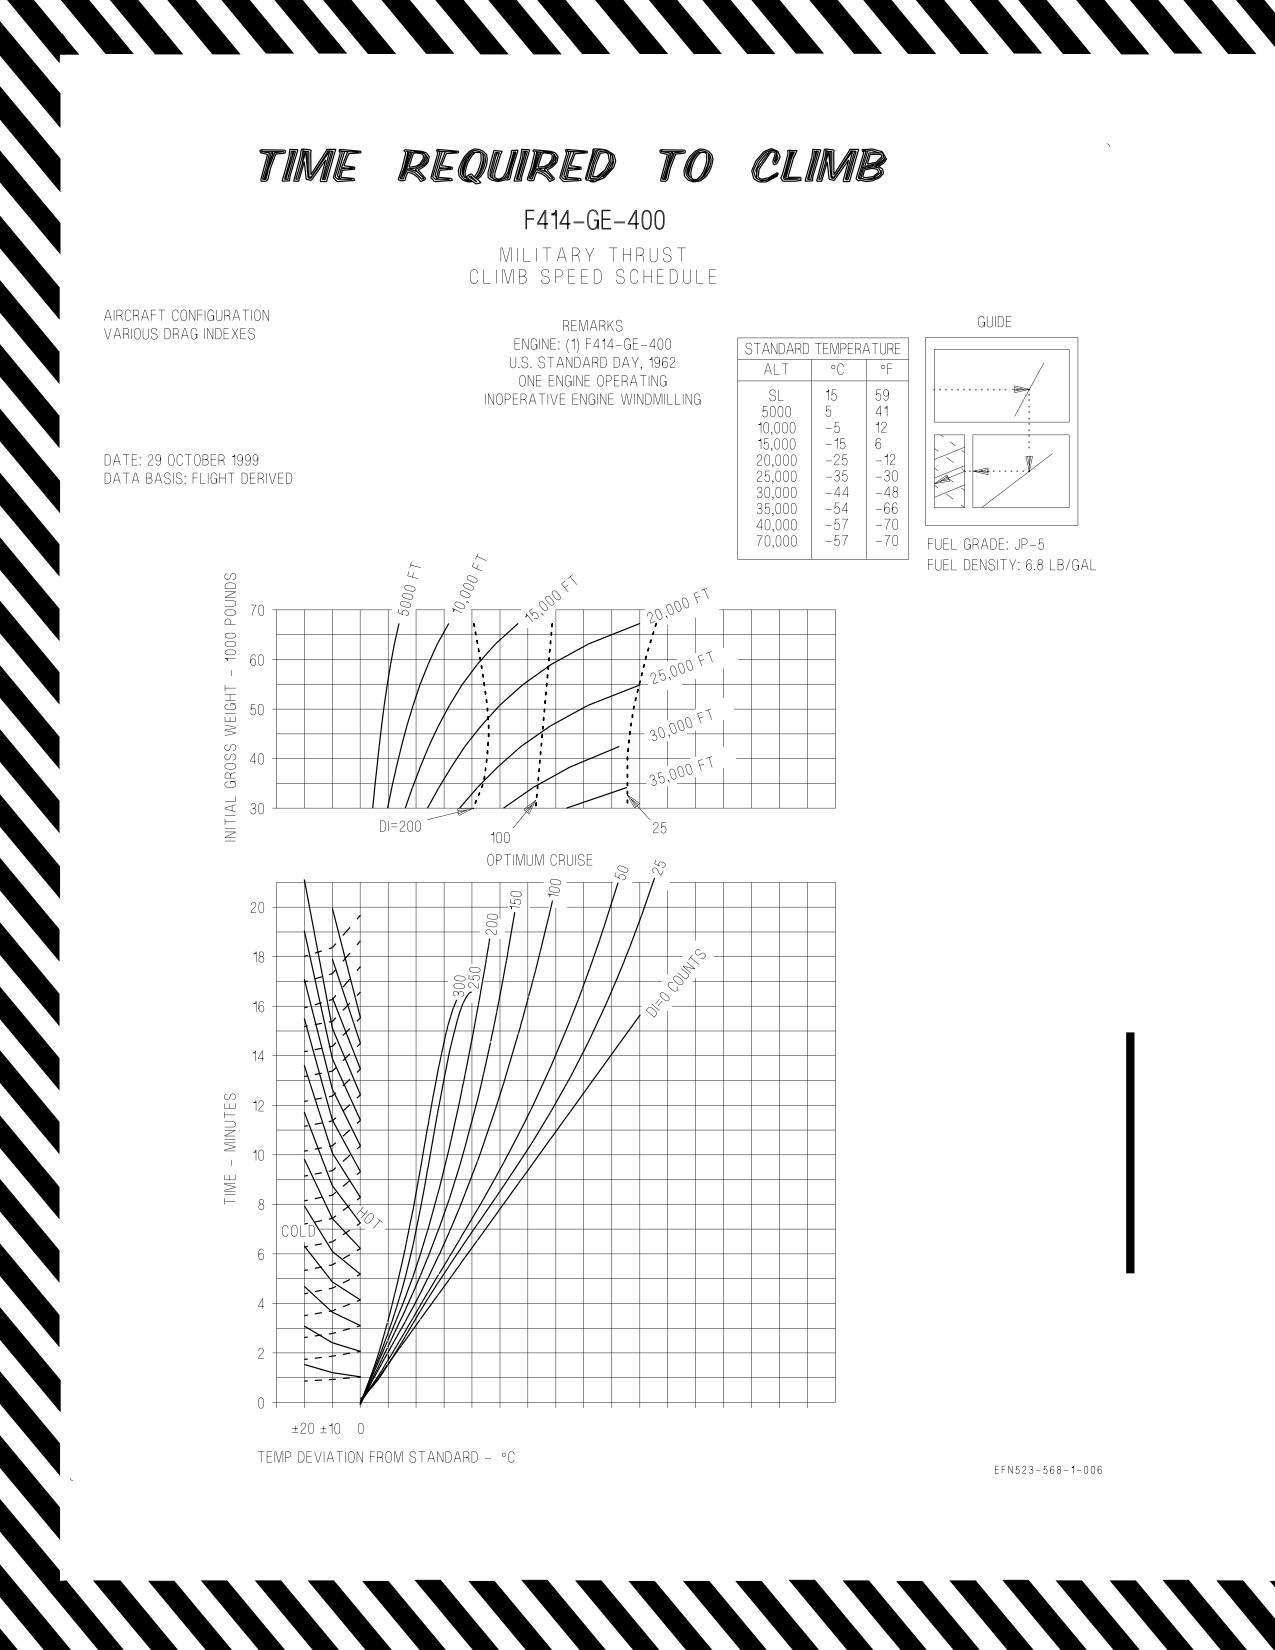
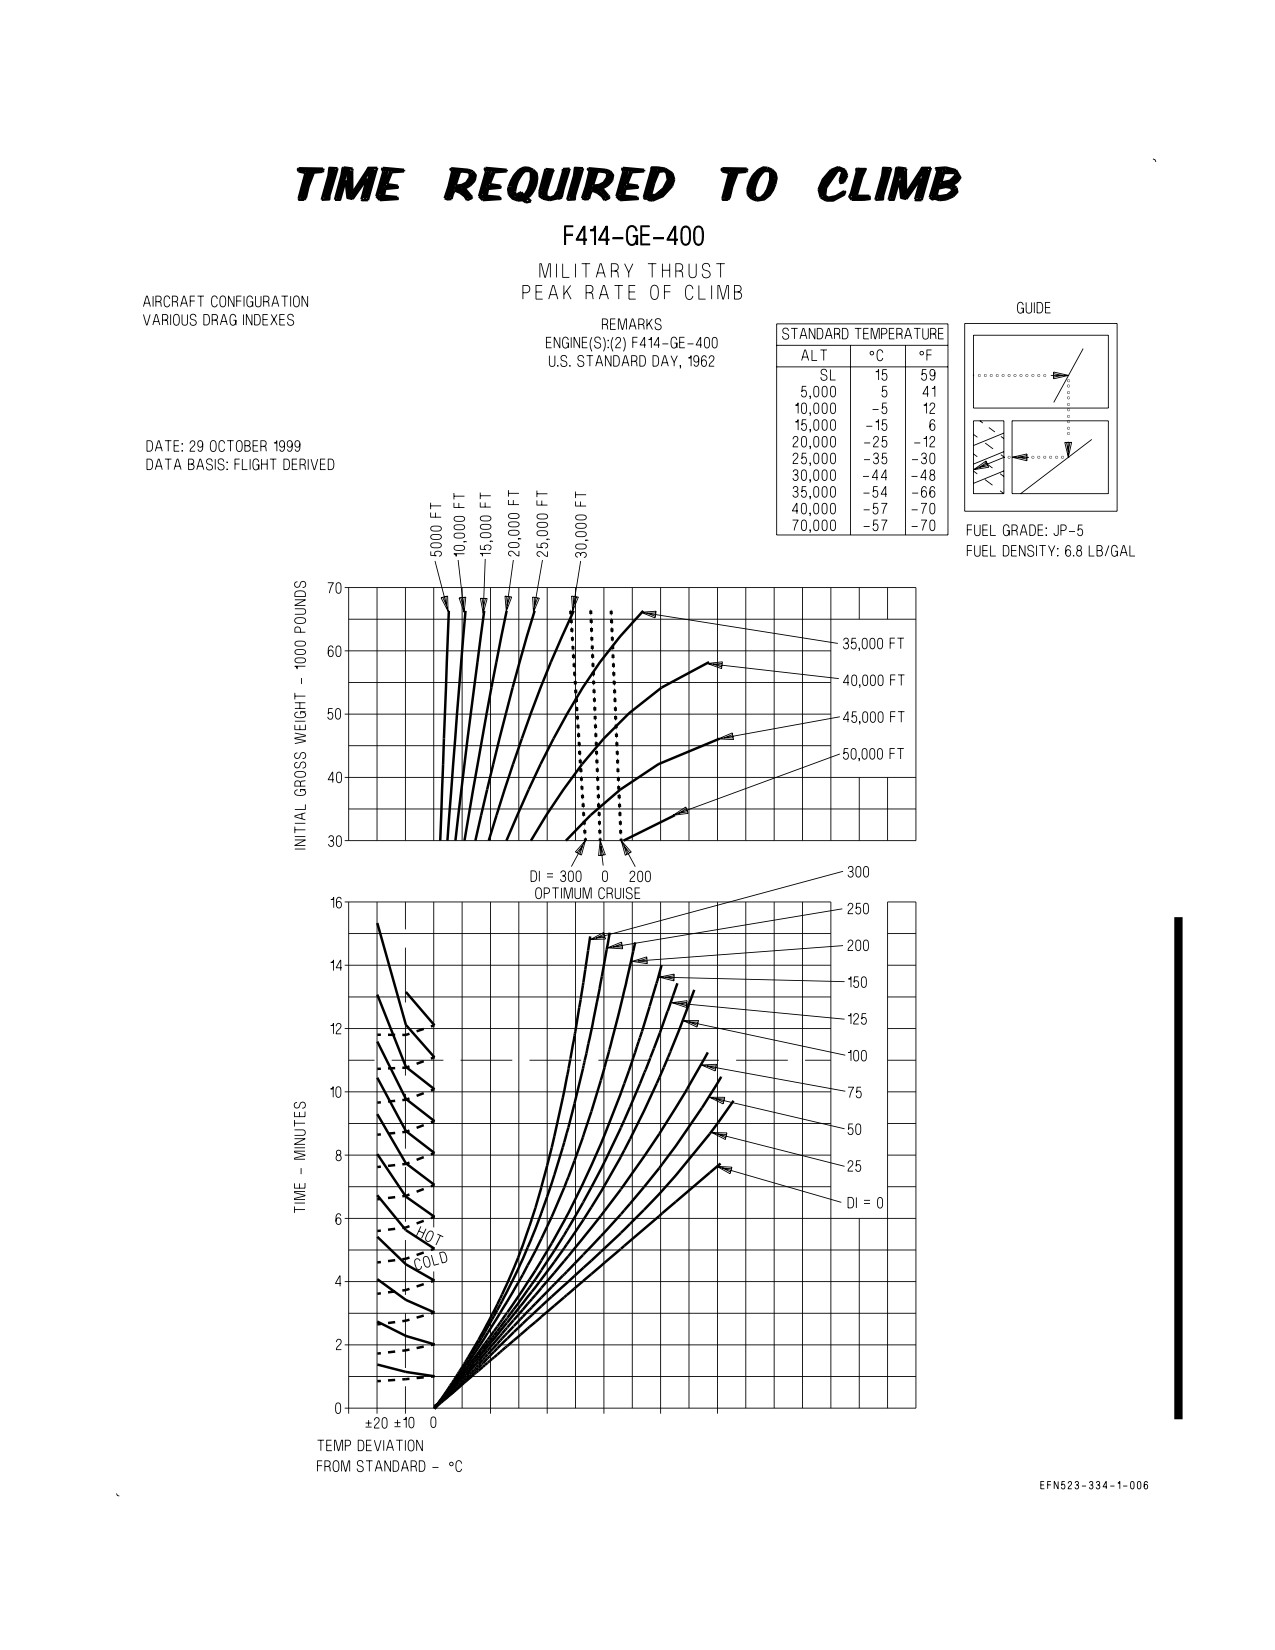
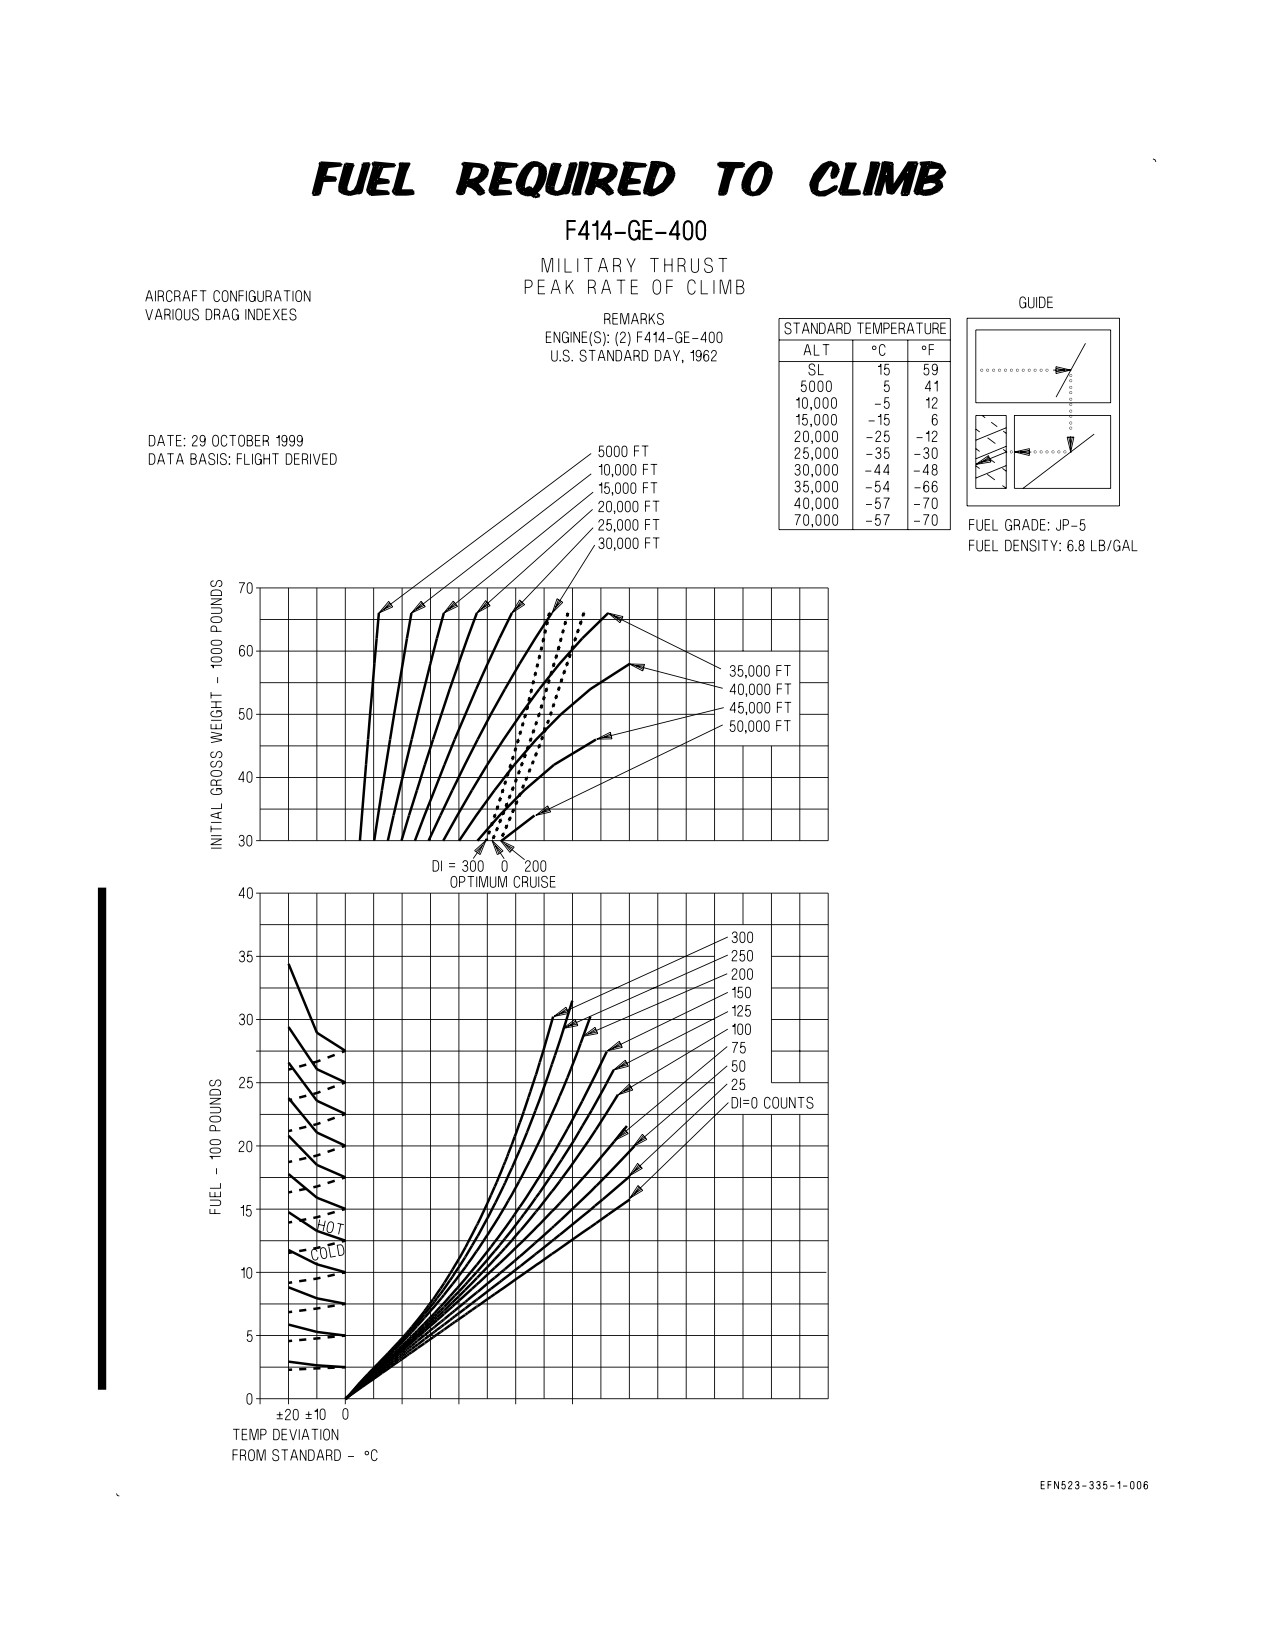
TIME, FUEL, AND DISTANCE - Presentations of these charts are identical: therefore, they are
used in the same manner. Enter the appropriate chart with the initial gross weight and project
horizontally right to intersect the desired altitude then vertically down to the appropriate drag index
curve. From this point project horizontally left to the temperature baseline and parallel the
appropriate temperature deviation guideline to the correct temperature deviation, project horizontally
left to find time, fuel, or distance required.
Time, Fuel, and Distance to Climb (figure 4-2, sheets 4, 5, & 6)
A. Initial gross weight
44,000 Lb.
B. Selected altitude
35,000 Ft.
C. Drag Index
100
D. Temperature deviation
+10°C
from standard day
E. Time to climb
4.6 Min.
F. Fuel required
1260 Lb.
G. Distance
38NM
XI-4-3
ORIGINAL
A1-F18EA-NFM-200
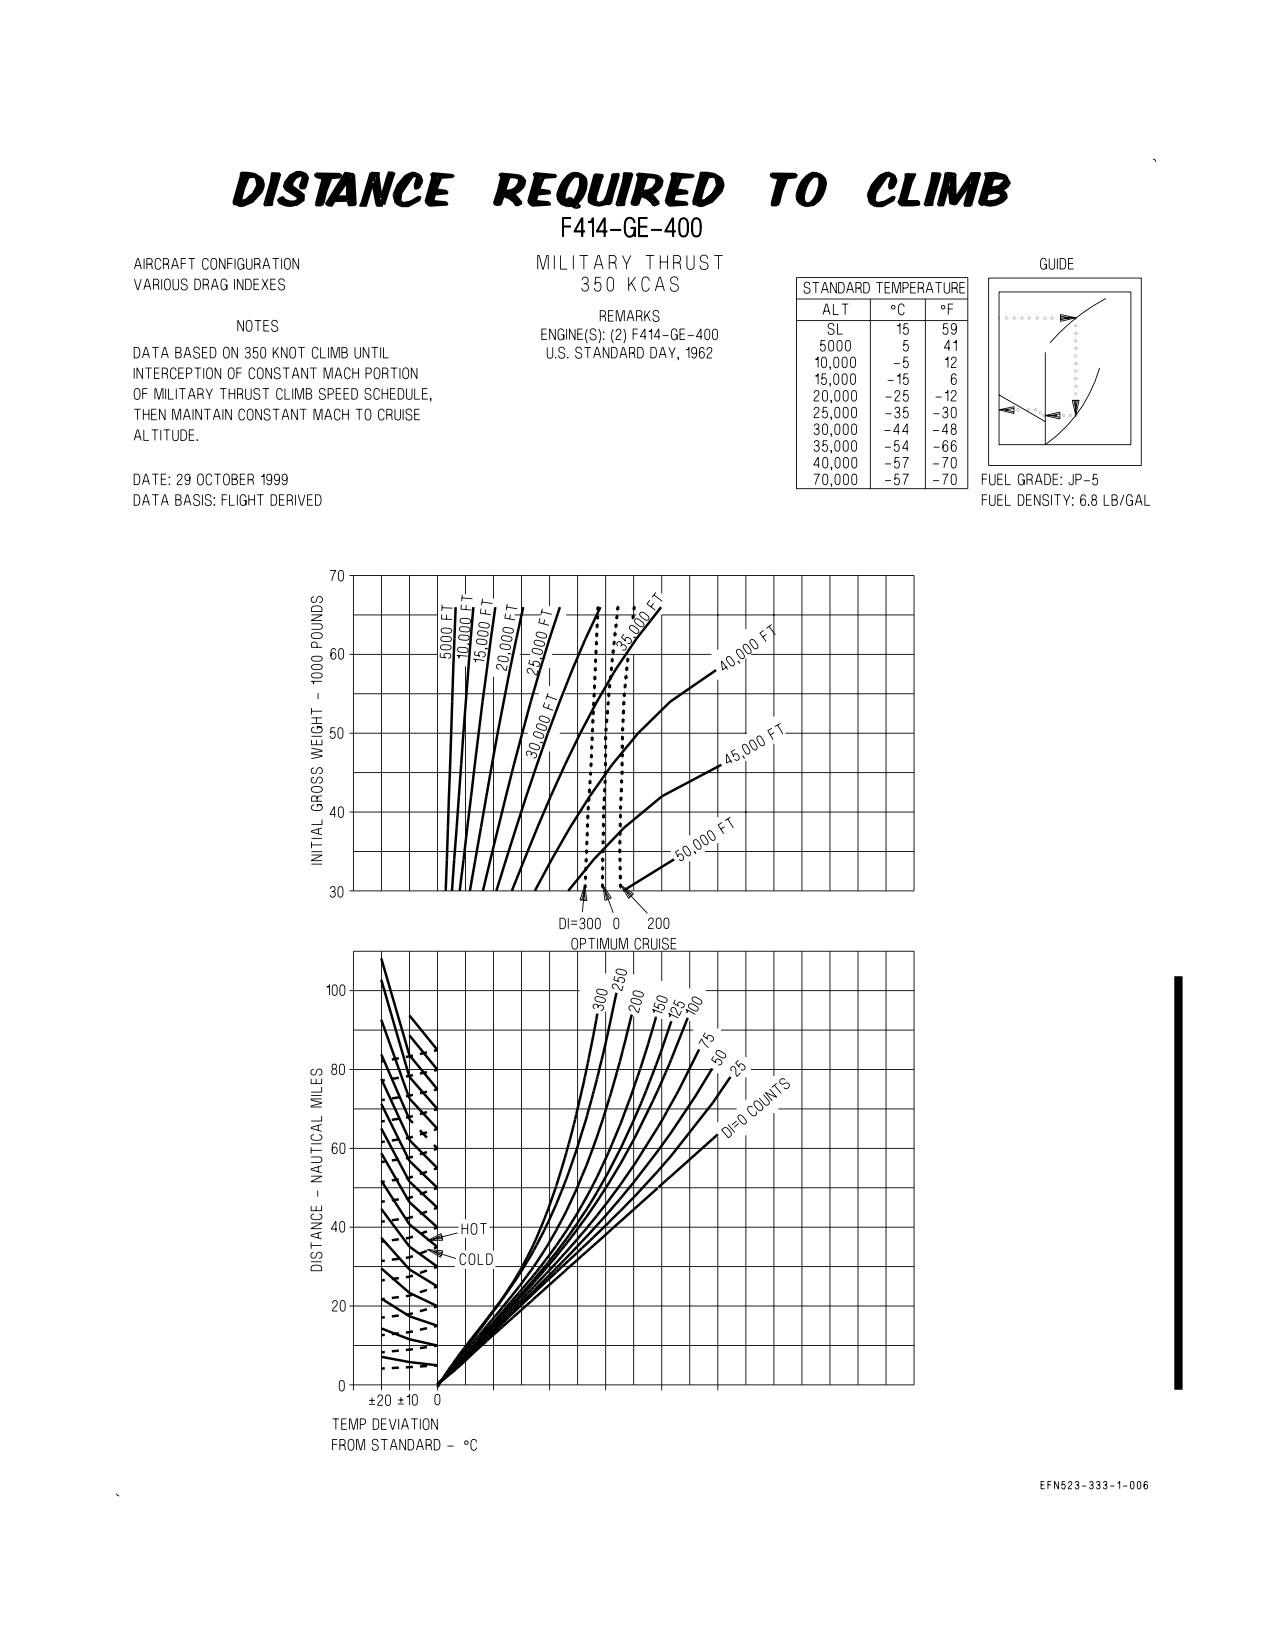
4.3 CLIMB CHARTS - 350 KCAS
These charts (figures 4-4 thru figure 4-6) show time, fuel, and distance for a simplified military
thrust climb. These data charts are based on climbing at 350 knots until interception of the constant
Mach portion of the military thrust climb speed schedule, then maintaining constant Mach to cruise
altitude.
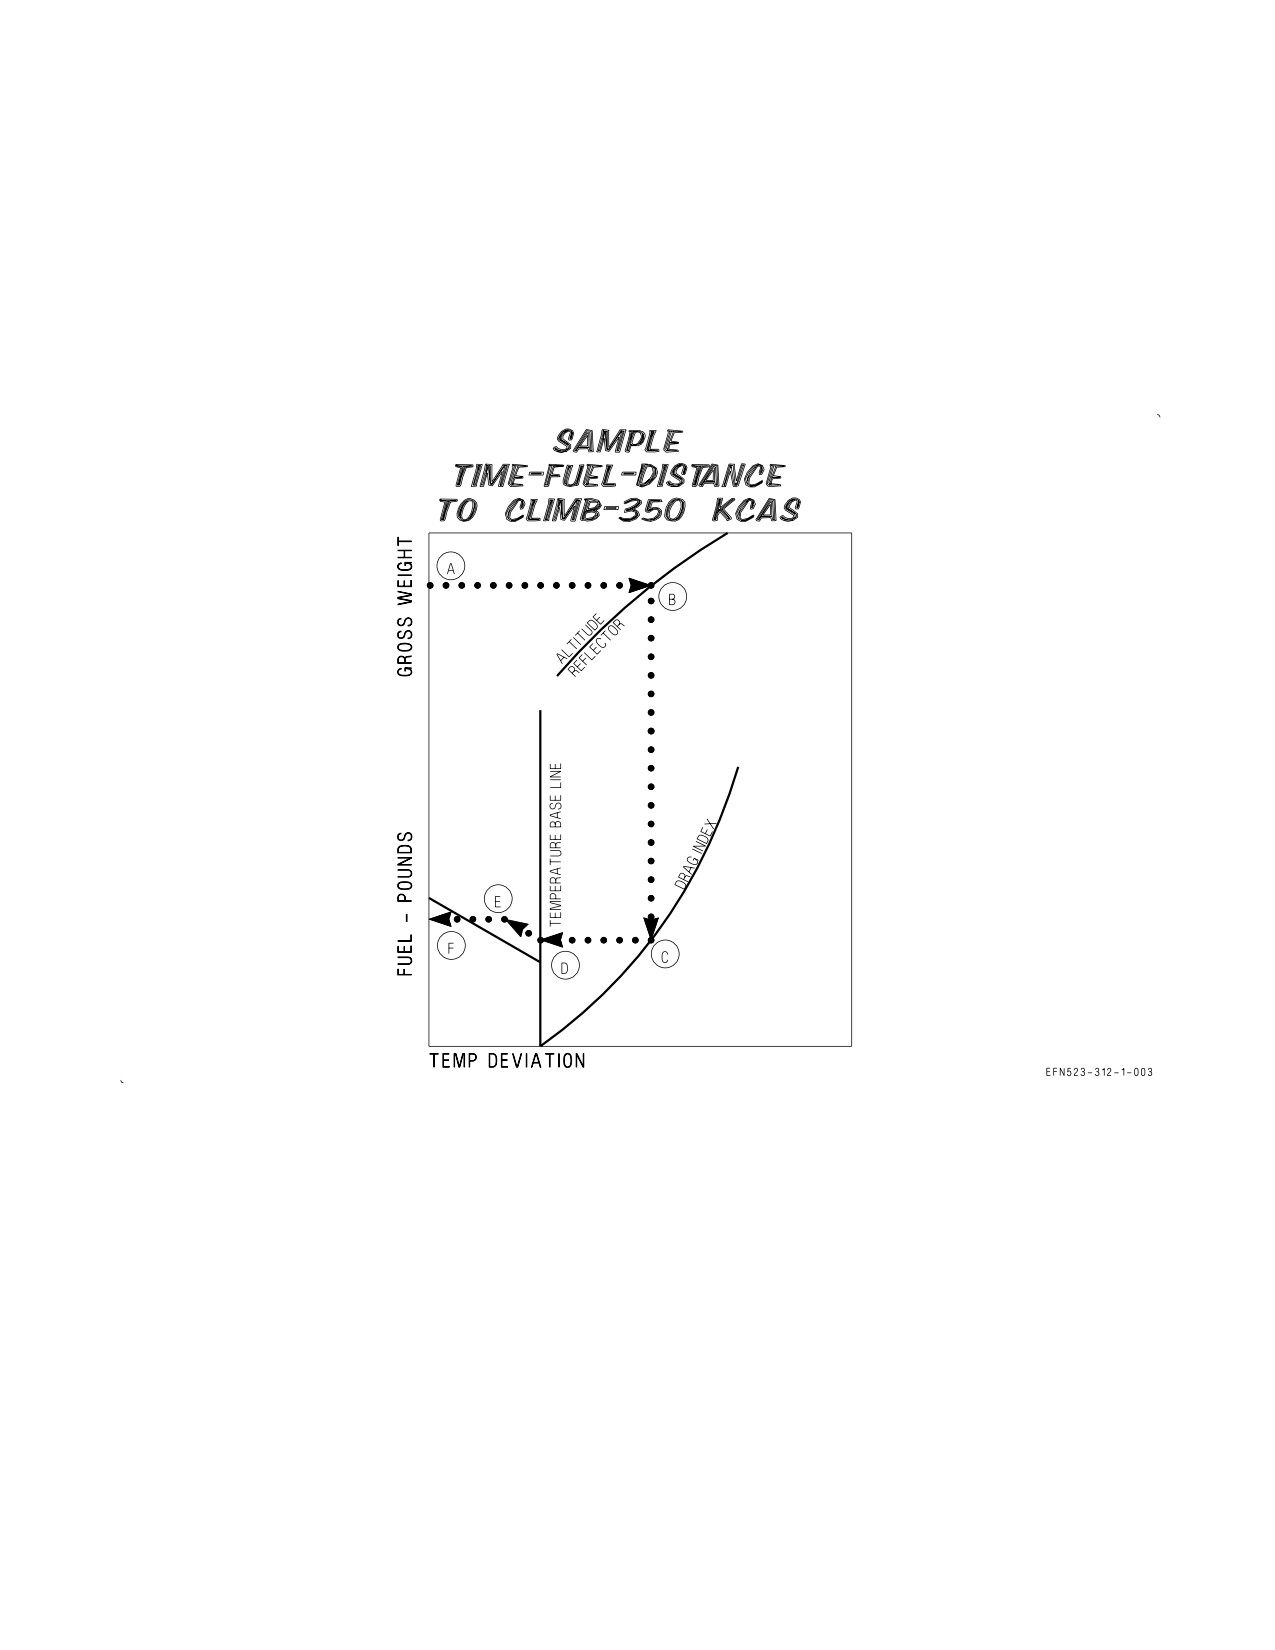
4.3.1 Use. Enter the charts with the initial climb gross weight. Project horizontally to the right and
intersect the assigned cruise altitude, or the optimum cruise altitude for the computed drag index.
Project vertically downward to intersect the applicable drag index line, then project horizontally to the
left to the temperature deviation baseline (corresponds to a U.S. standard day (°C)). Parallel the
applicable guideline (hotter or colder) to intersect a vertical grid line corresponding to the degree of
deviation between forecast flight temperature and standard day temperature. From this point continue
horizontally to the left to read the planning data (fuel, time, or distance).
XI-4-4
ORIGINAL
A1-F18EA-NFM-200
4.3.2 Sample Problem.
A. Gross Weight
52,000 Lb.
B. Cruise Altitude
30,000 Ft.
C. Drag index
150
D. Temperature baseline
E. Temperature deviation
+5°C
F. Fuel required
1450 Lb.
Time to Climb
4.8 Min.
Distance nautical miles
35 NM
XI-4-5
ORIGINAL
A1-F18EA-NFM-200
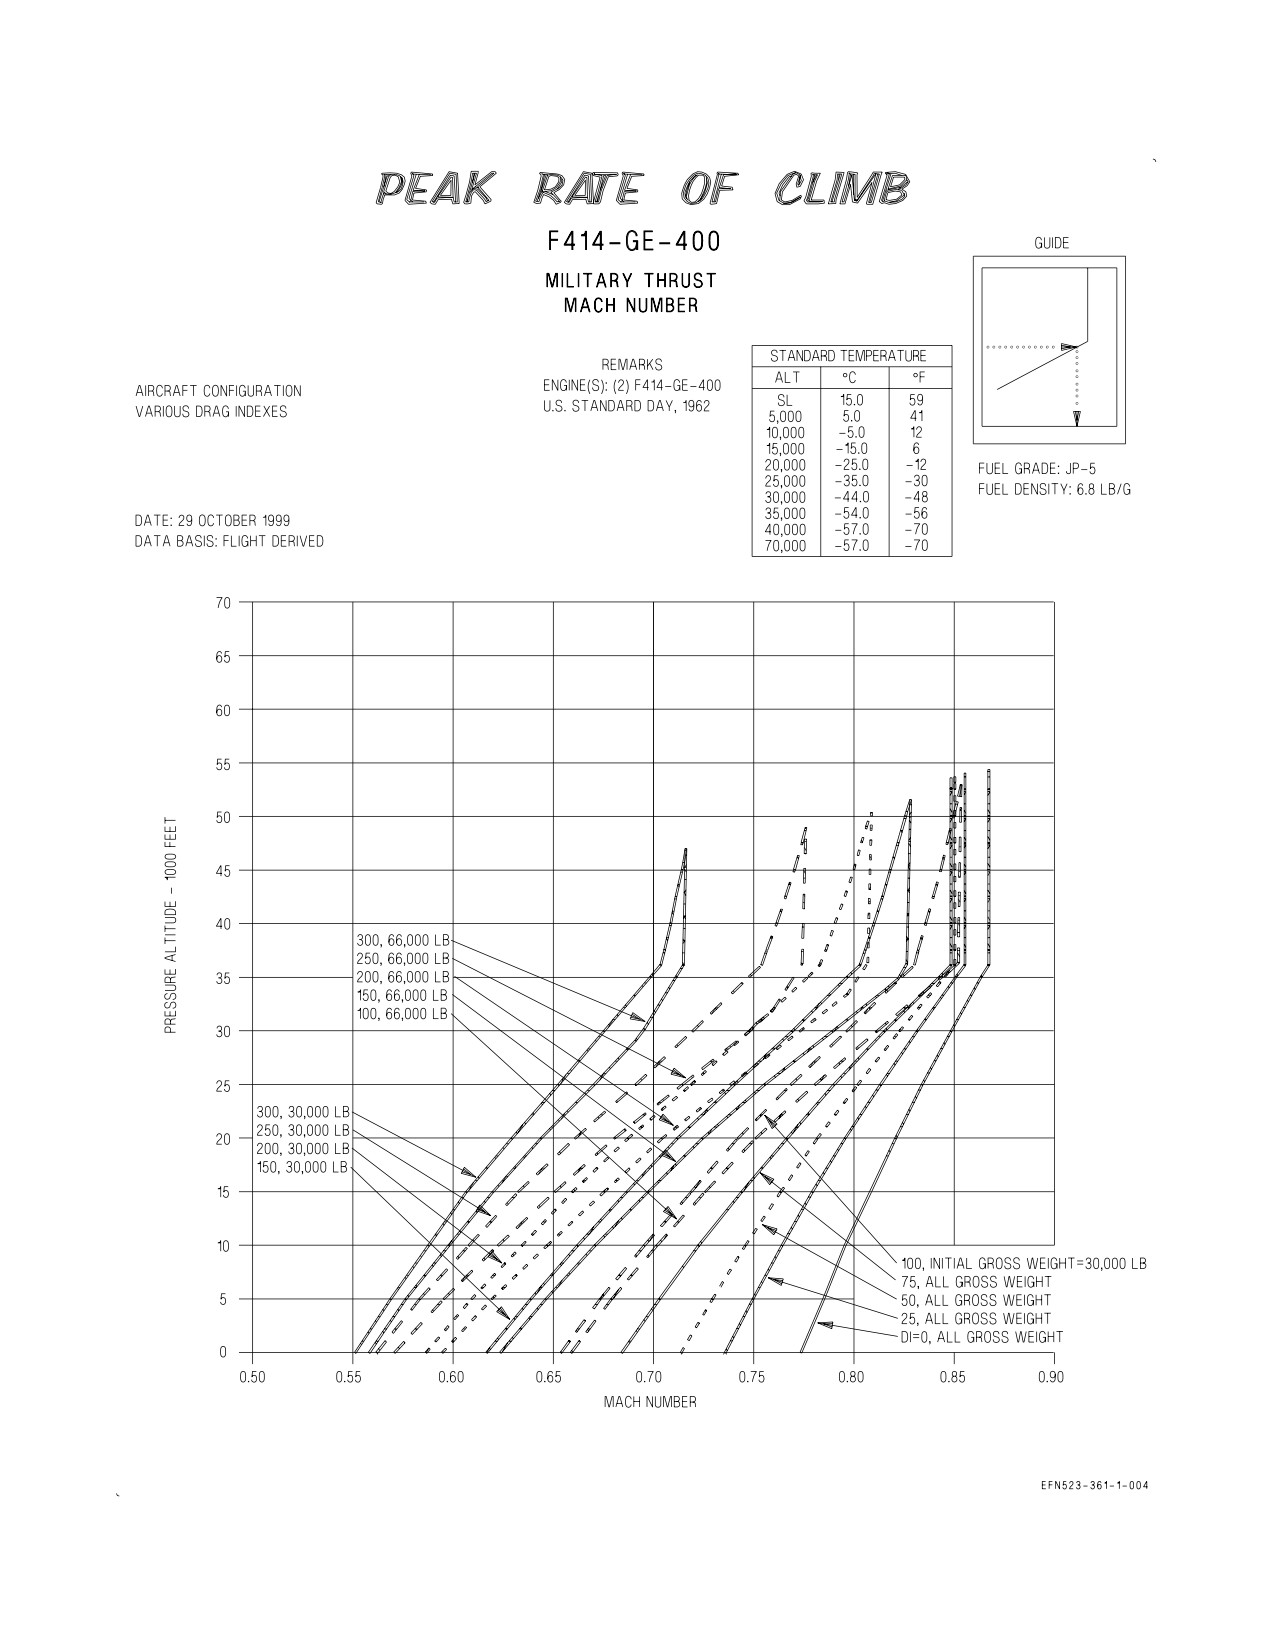
4.4 PEAK RATE OF CLIMB CHARTS
These charts provide peak rate of climb data for two-engine operation. The data are based on either
military thrust (figure 4-7) or maximum thrust (figure 4-8) at selected altitudes, gross weights, and
drag indexes. The charts include a climb schedule (Mach number) and the normal time, fuel, and
distance required charts which are used in an identical manner as the military thrust climb charts
based on the climb speed schedule. A combat ceiling chart is included for maximum thrust.
4.4.1 Use. MACH NUMBER - Enter the chart at the selected pressure altitude and project
horizontally right to the appropriate drag index curve, then vertically down to find the Mach number
for peak rate of climb.
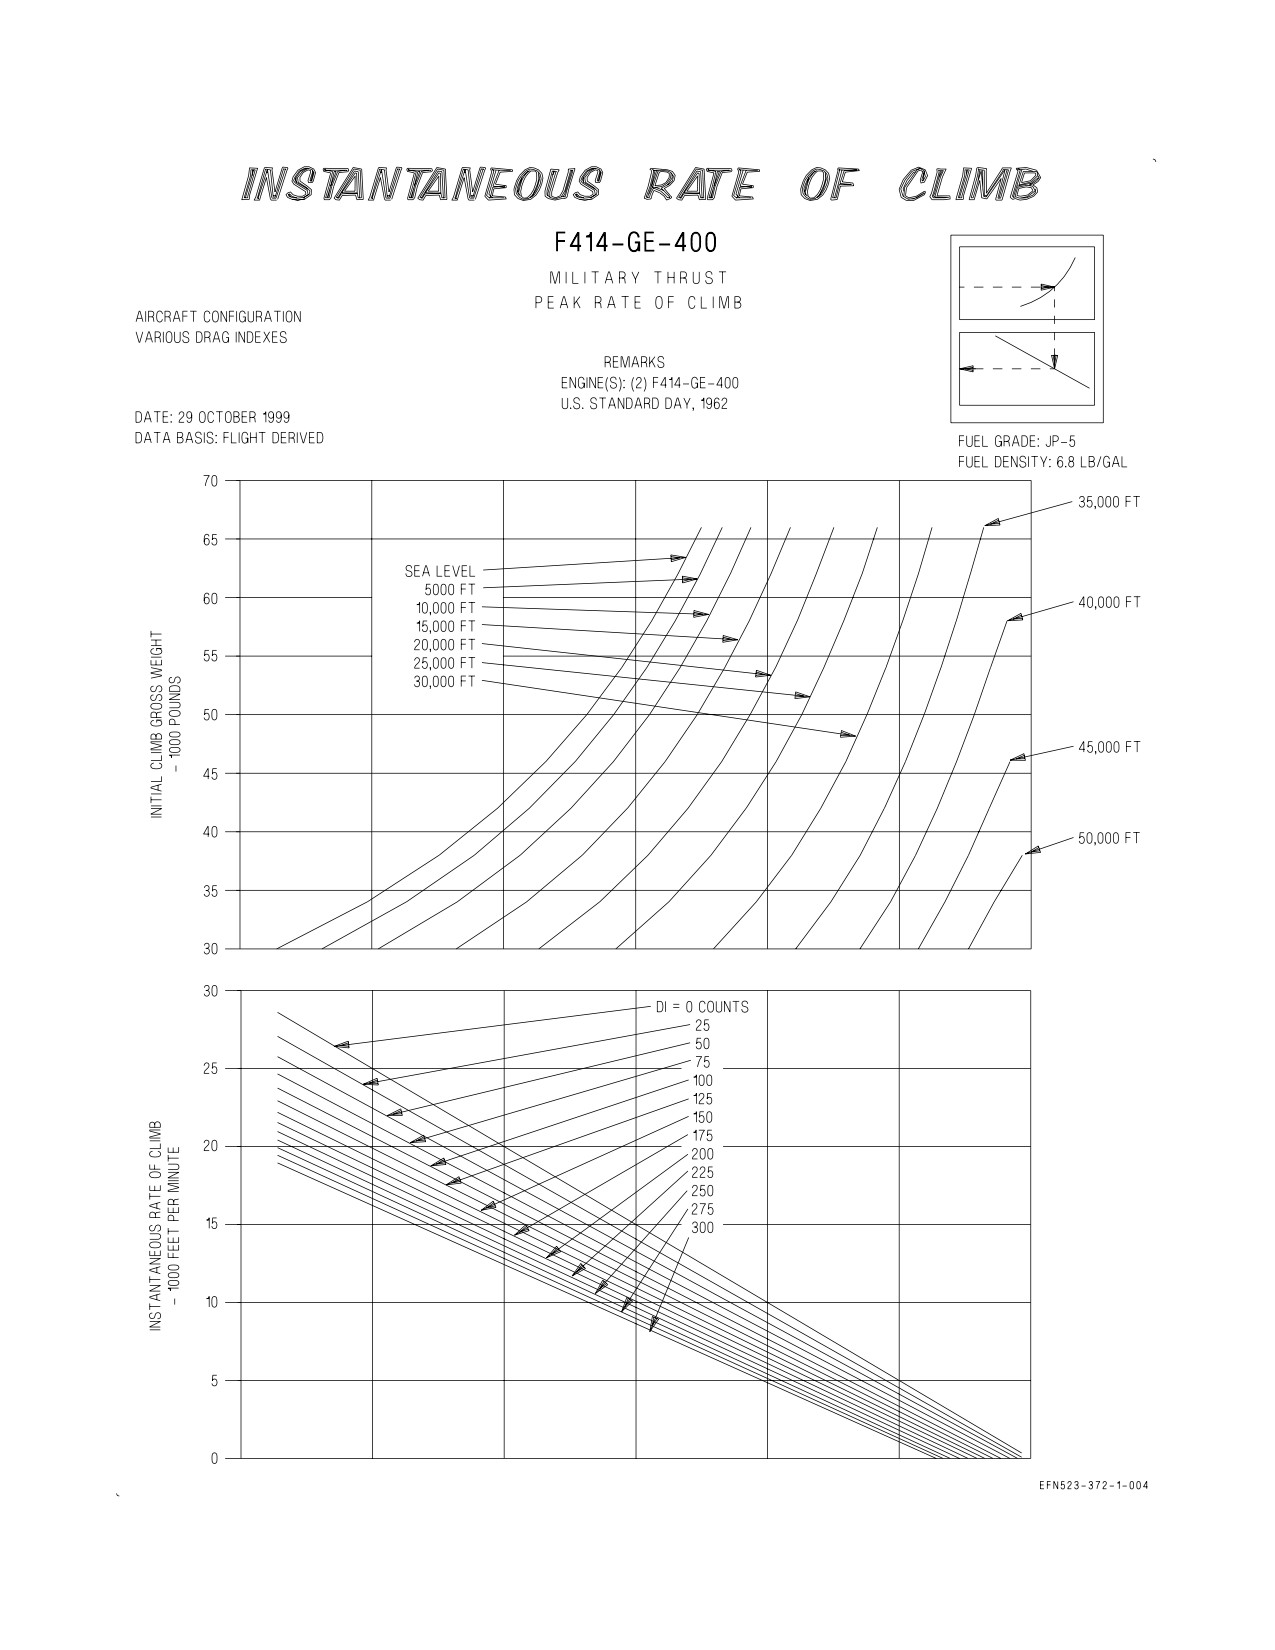
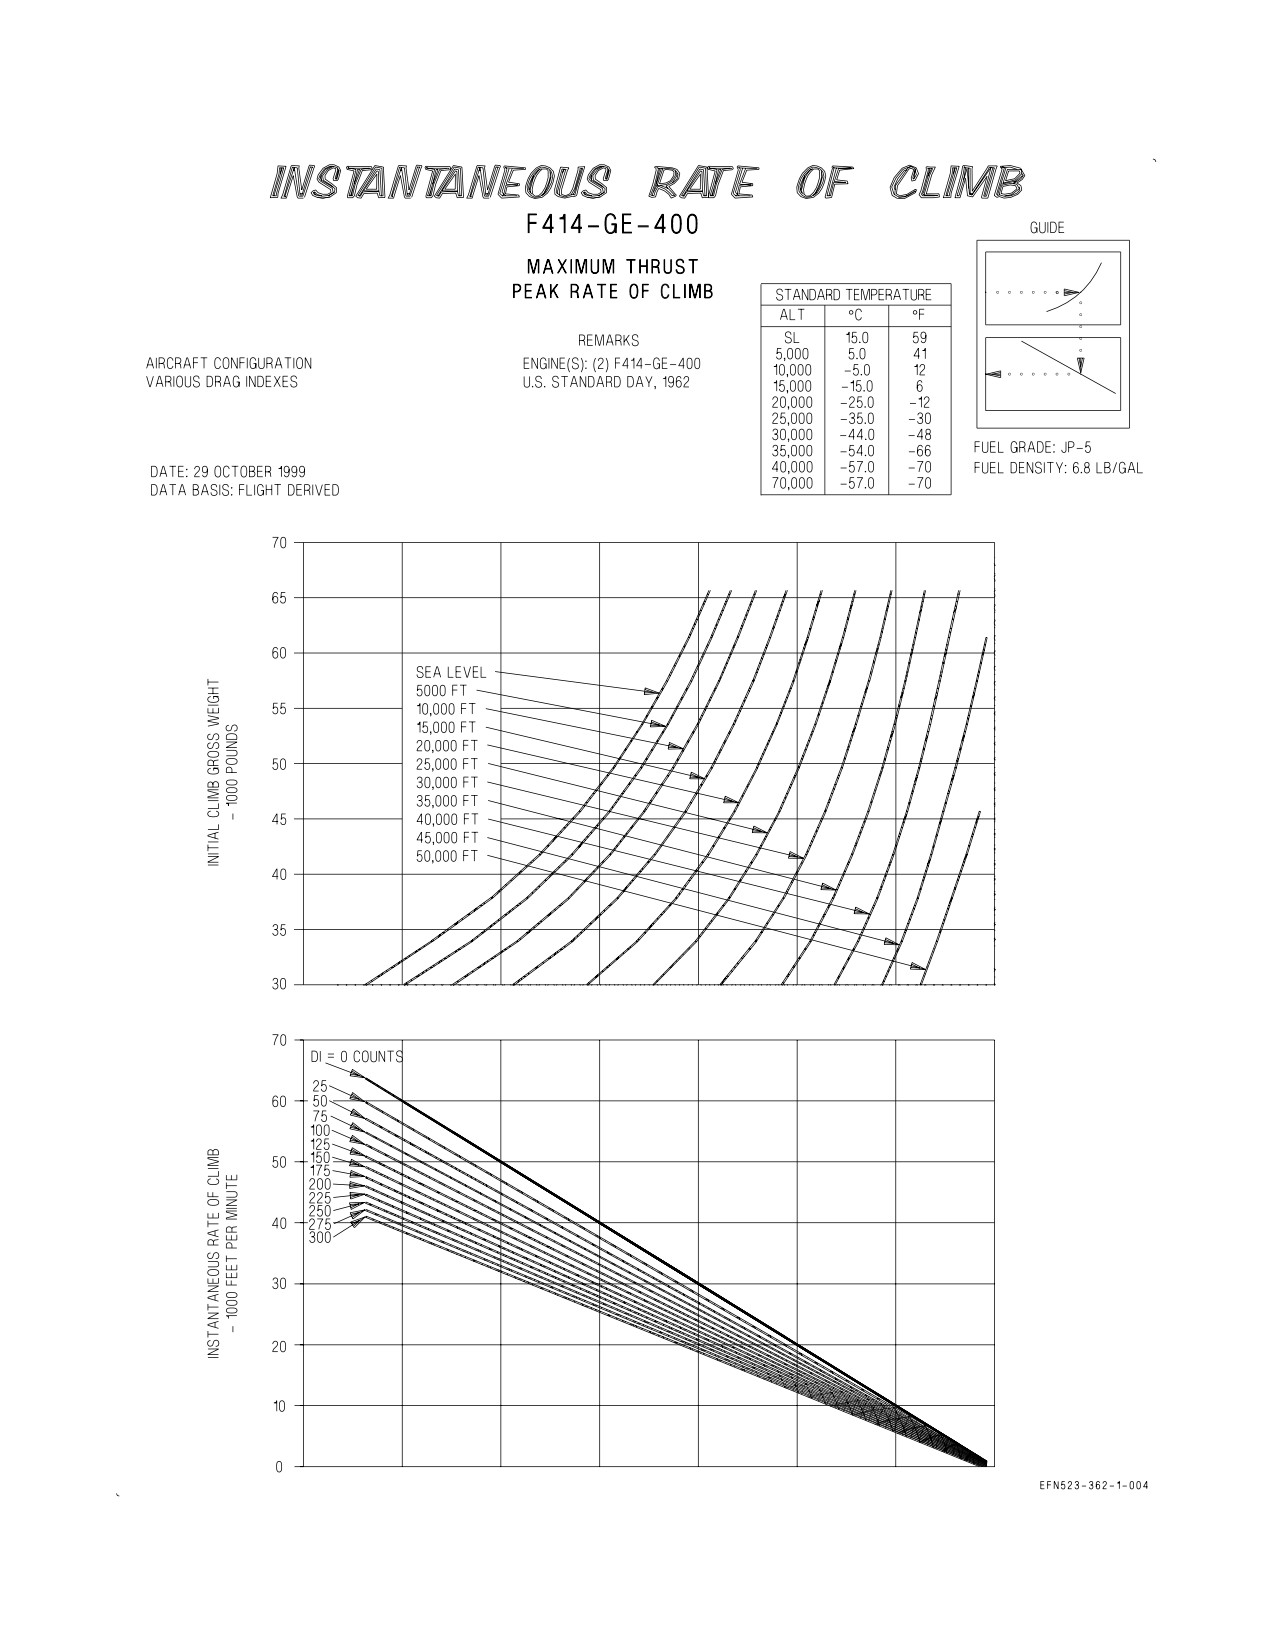
4.5 INSTANTANEOUS RATE OF CLIMB CHARTS
These charts are based on two-engine operation at military thrust (figure 4-9) or maximum thrust
(figure 4-10) and provide instantaneous rate of climb for any given altitude gross weight combination
with various drag indexes.
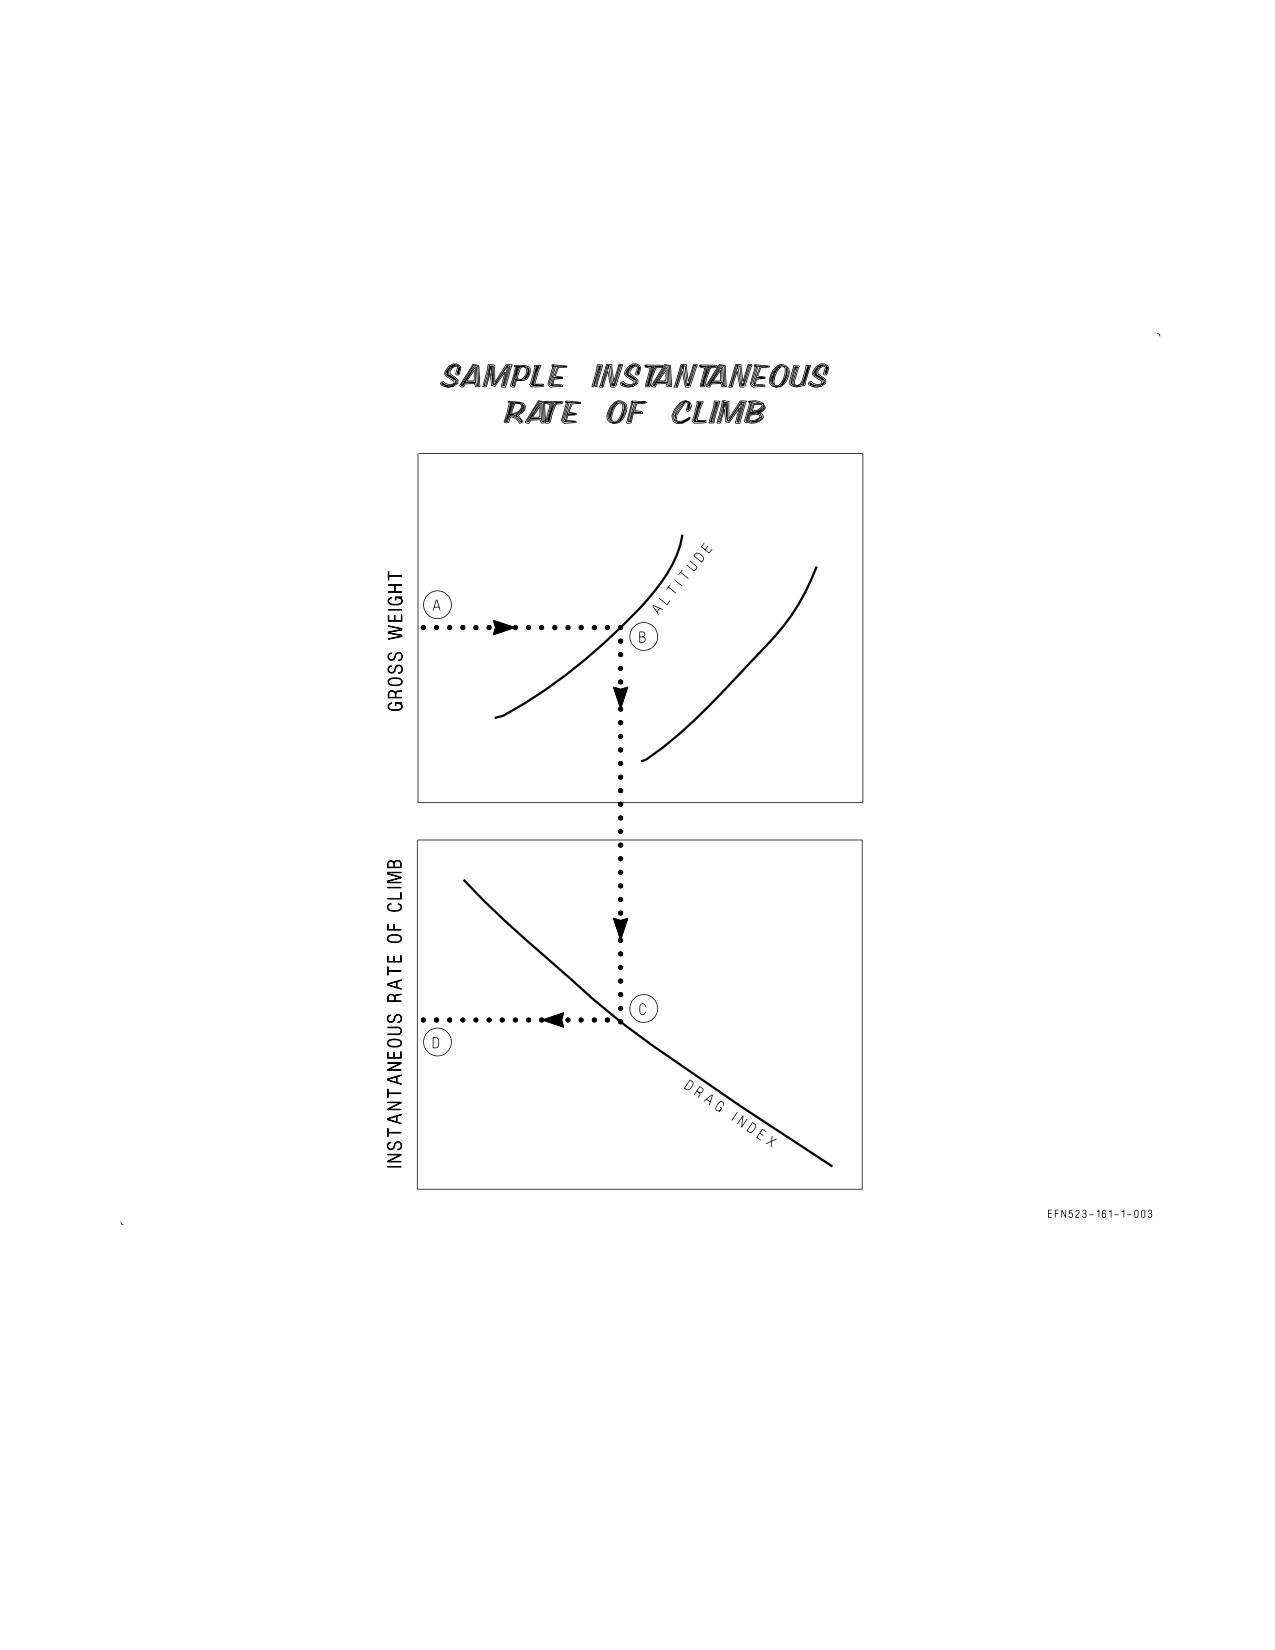
4.5.1 Use. Enter the chart with the appropriate gross weight and project horizontally right to the
selected altitude curve. From this point, project vertically down to the computed drag index curve, then
horizontally left to read the instantaneous rate of climb in feet per minute.
XI-4-6
ORIGINAL
A1-F18EA-NFM-200
4.5.2 Sample Problem.
A. Gross weight
40,000 Lb.
B. Selected altitude
30,000 Ft.
C. Drag index
100
D. Instantaneous rate of climb
6400 FPM
XI-4-7
ORIGINAL
A1-F18EA-NFM-200
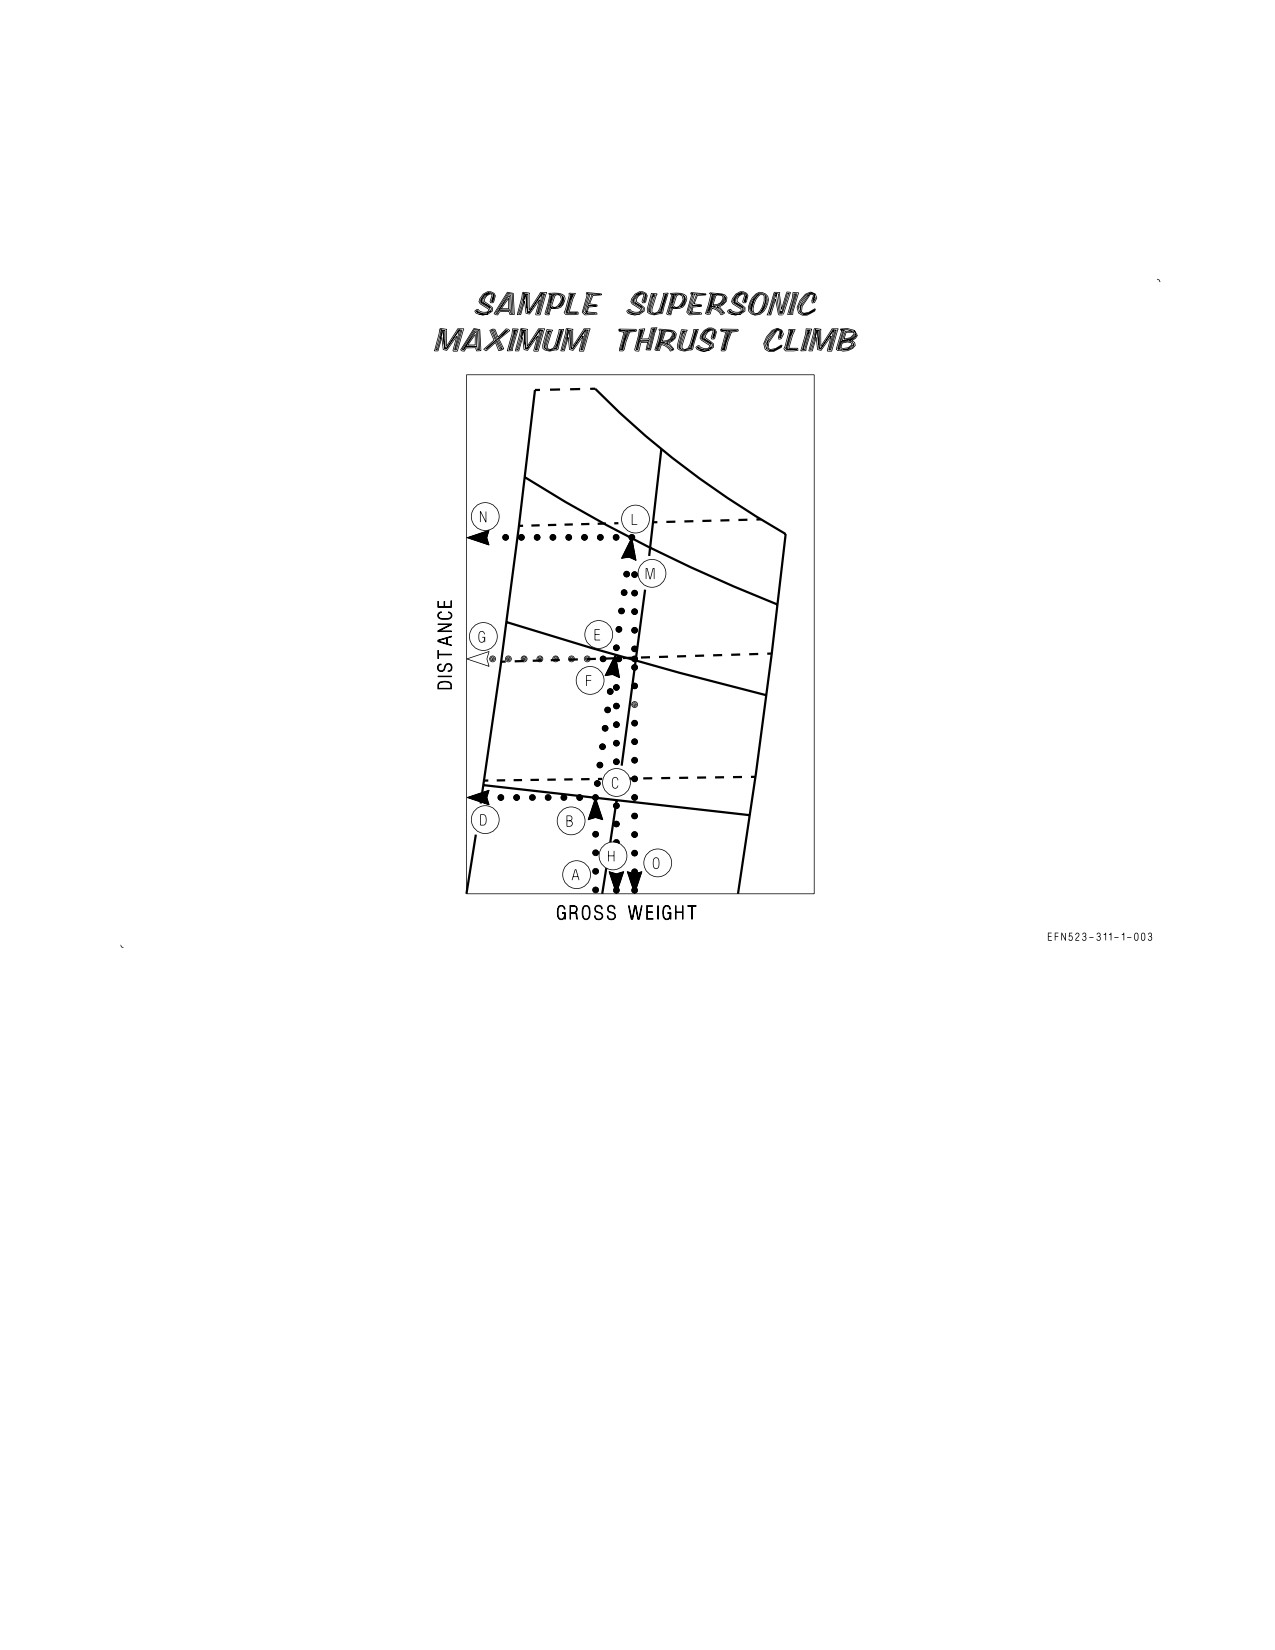
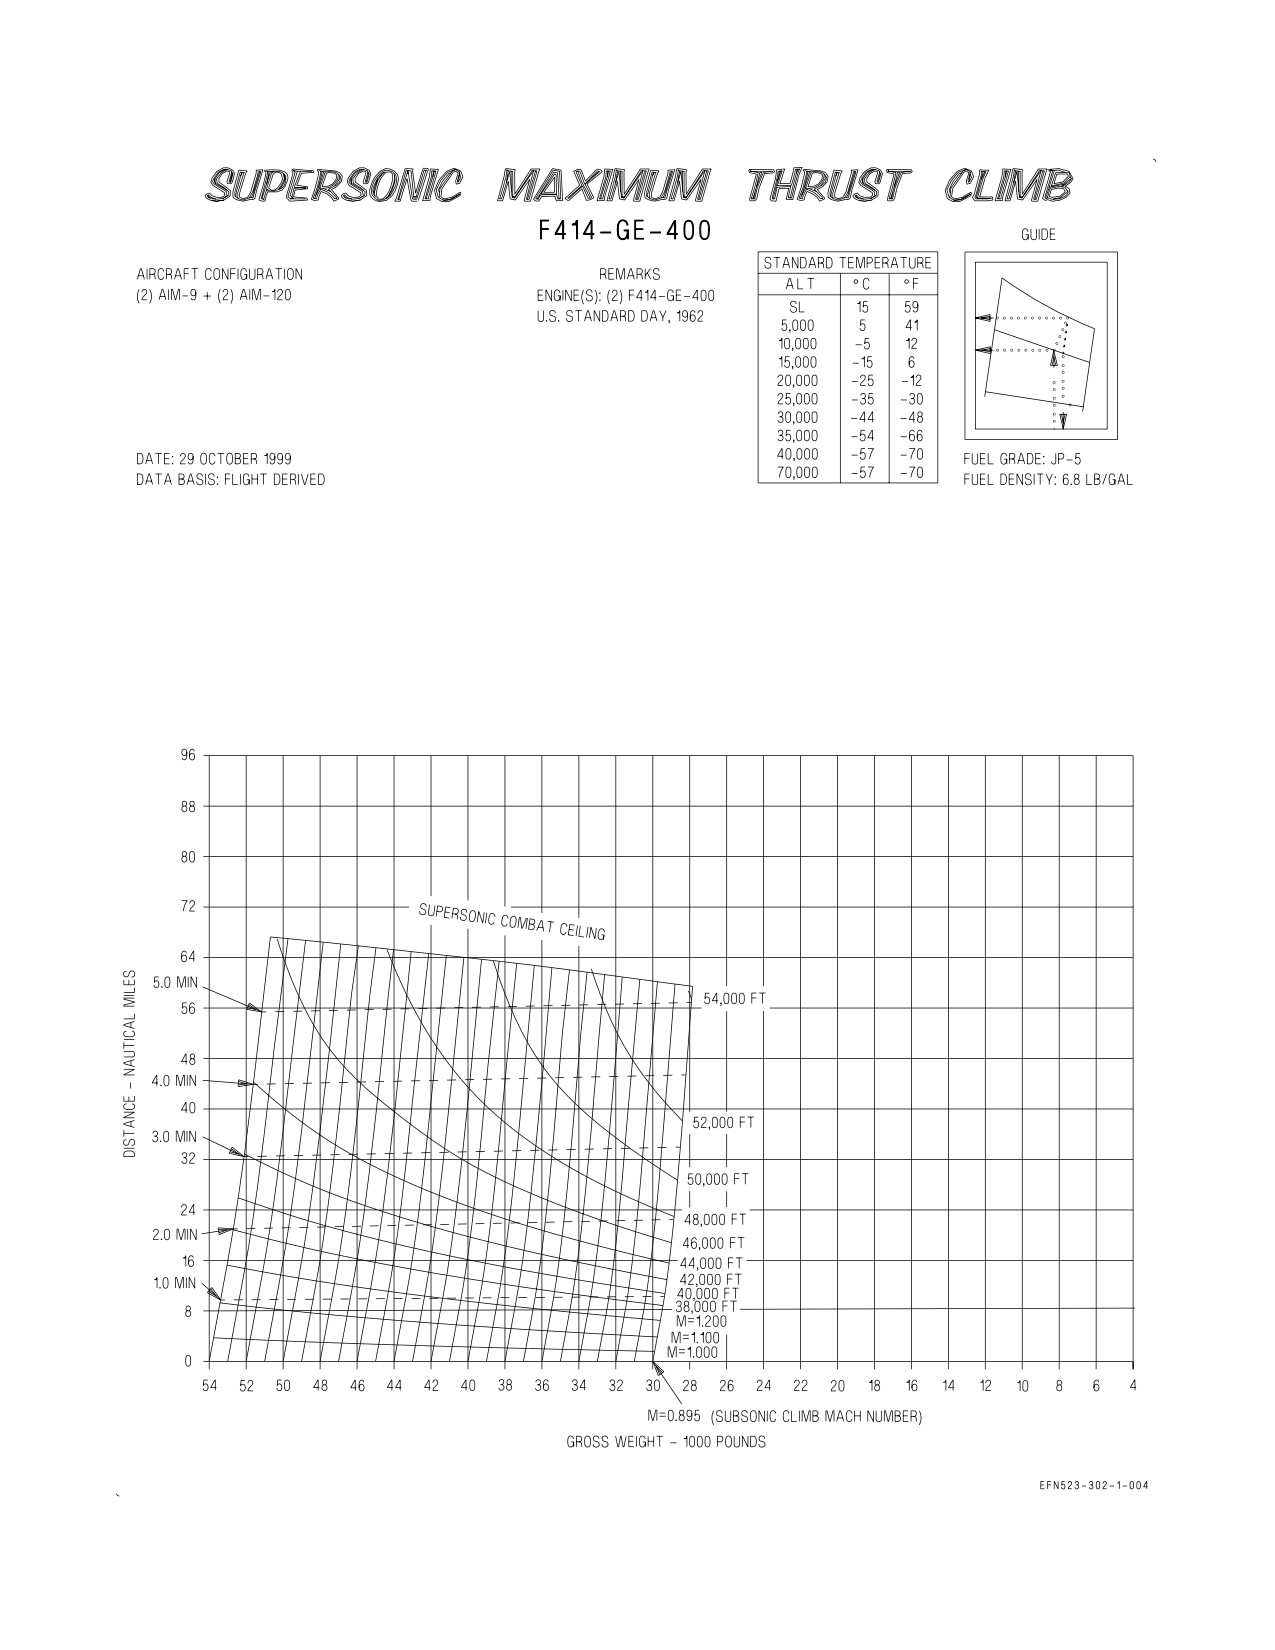
4.6 SUPERSONIC MAXIMUM THRUST CLIMB CHARTS
These charts (figure 4-11) are plotted for supersonic maximum thrust climb from 35,000 feet to the
supersonic combat ceiling. Distance traveled in the climb is plotted against gross weight, with
guidelines provided to show the weight reduction as the climb progresses. The time to distance/altitude
relationship is superimposed on the plot. Level flight acceleration data are provided which includes
time, fuel used (gross weight change), and distance required to accelerate from the subsonic to the
supersonic climb Mach number at 35,000 feet. If supersonic climb is contemplated, acceleration at
35,000 feet followed by the climb is recommended, since acceleration to supersonic Mach numbers at
this altitude provides for the optimum performance capability.
4.6.1 Use. Enter the chart with the gross weight and proceed vertically to the initial Mach number
and note the corresponding distance and time. Proceed parallel to the guidelines to the desired
supersonic climb Mach number (end of acceleration). Project both vertically downward and horizon-
tally to the left from this point to read gross weight and distance traveled, also note the time. From
these values, subtract the distance, weight, and time corresponding to the initial Mach number to
determine the distance, fuel, and time required to accelerate. From the climb Mach number gross
weight intersection (start of climb), proceed parallel along the guidelines to the desired altitude. Obtain
the distance, gross weight, and time for this starting point. Subtract from this data the corresponding
values at the start of climb to obtain the distance traveled, the weight change (fuel used), and the time
required to complete the climb. If total distance, fuel and time
are
desired,
add the climb and
acceleration values together.
4.6.2 Sample Problem. Configuration - (2)AIM-9 +(2)AIM-120.
A. Initial gross weight
42,000 Lb.
B. Initial Mach number
1.1
C. Time corresponding to initial
Mach number
0.6 Min.
D. Distance corresponding to initial
Mach number
6.1 NM
E. Climb Mach number
1.2
F. Time at end of acceleration
1.0 Min.
G. Distance at end of acceleration
10.1 NM
H. Gross weight at end of acceleration
41,740 Lb.
I. Time required for acceleration
(F-C)
0.4 Min.
J. Fuel required for acceleration
(A-H)
260 Lb.
K. Distance required for acceleration
(G-D)
4.0 NM
L. Altitude at end of climb
46,000 Ft.
M. Time at end of climb
3.0 Min.
N. Distance at end of climb
32.7 NM
O. Gross weight at end of climb
40,670 Lb.
P. Time required for climb (M-F)
2.0 Min.
Q. Distance required for climb (N-G)
22.6 NM
R. Fuel required for climb (H-O)
1070 Lb.
S. Total time required to accelerate
and climb (I+P)
2.4 Min.
XI-4-8
ORIGINAL
A1-F18EA-NFM-200
T. Total distance required to accelerate
and climb (K+Q)
26.6 NM
U. Total fuel required to accelerate
and climb (J+R)
1330 Lb.
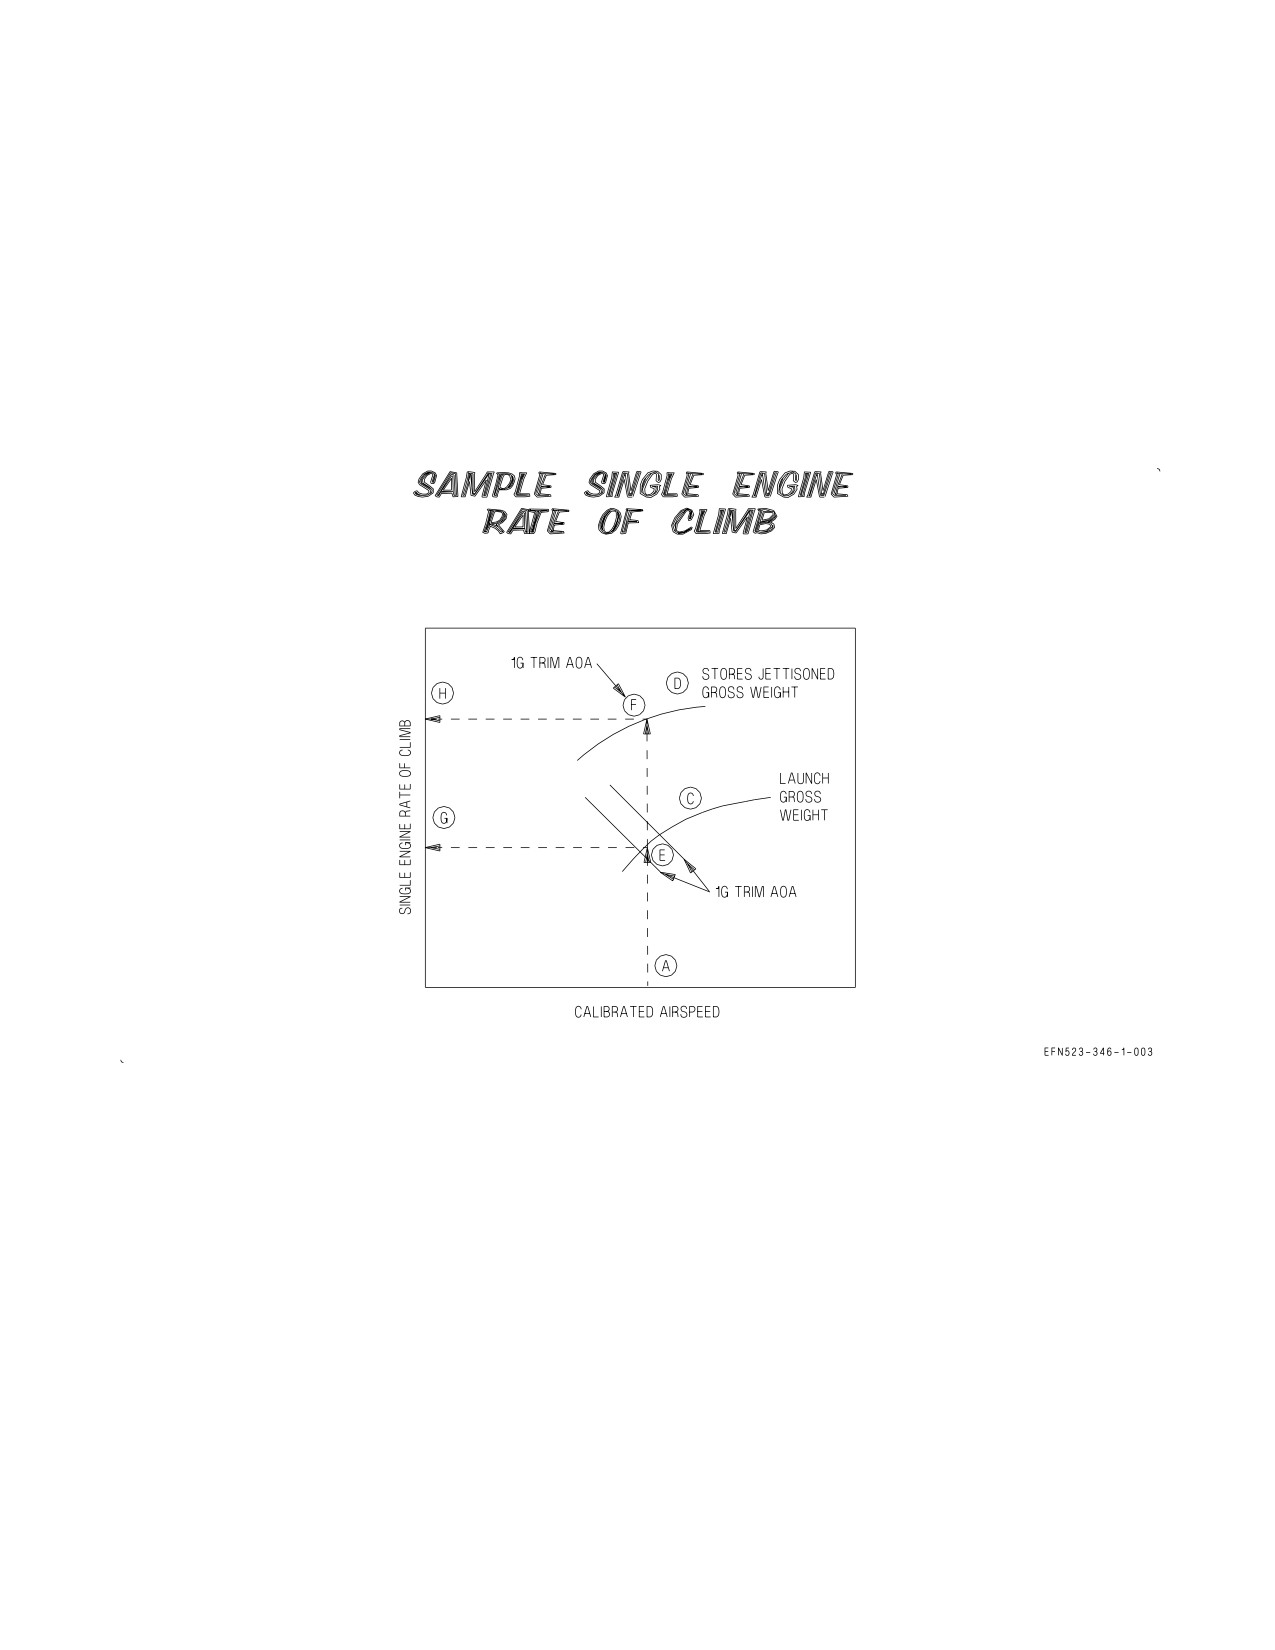
4.7 SINGLE ENGINE RATE OF CLIMB TAKEOFF CONFIGURATION CHARTS
These charts (figures 4-12 and 4-13) provide the single engine rate of climb capability in the field
takeoff (half flaps, gear down) and catapult launch (full flaps, gear down) configurations with
maximum afterburner thrust on the operating engine. Charts are provided for six different external
store loadings: three loadings with full external stores and three loadings with stores jettisoned. Single
engine rate of climb is presented as a function of temperature, gross weight, angle of attack, and
airspeed. Dual engine operational launch endspeeds and dual engine nose and main gear liftoff speeds
are provided for reference on the catapult launch and field takeoff charts, respectively.
4.7.1 Use. Enter the chart representing the applicable air temperature at the desired airspeed and
project vertically upward until intersecting the appropriate gross weight curve. From this intersection,
read the angle of attack required to maintain 1g, unaccelerated flight at this condition and then project
horizontally left to obtain the corresponding single engine rate of climb. For air temperatures between
the values listed at the top of each chart, linear interpolation between the two applicable charts must
be used.
XI-4-9
ORIGINAL
A1-F18EA-NFM-200
4.7.2 Sample Problem. Launch SEROC (figure 4-12, sheet 2).
A. Air temperature
59°F
B. Voperationalend -5 kt
149 kt
(from operational endspeed table at top of chart)
C. Launch weight
58,000 lb
D. Stores jettisoned weight
49,000 lb
E. Stores retained 1g trim AOA
13°
F. Stores jett 1g trim AOA
6.5°
G. Stores retained SEROC
400 FPM
H. Stores jett SEROC
2000 FPM
XI-4-10
ORIGINAL
A1-F18EA-NFM-200
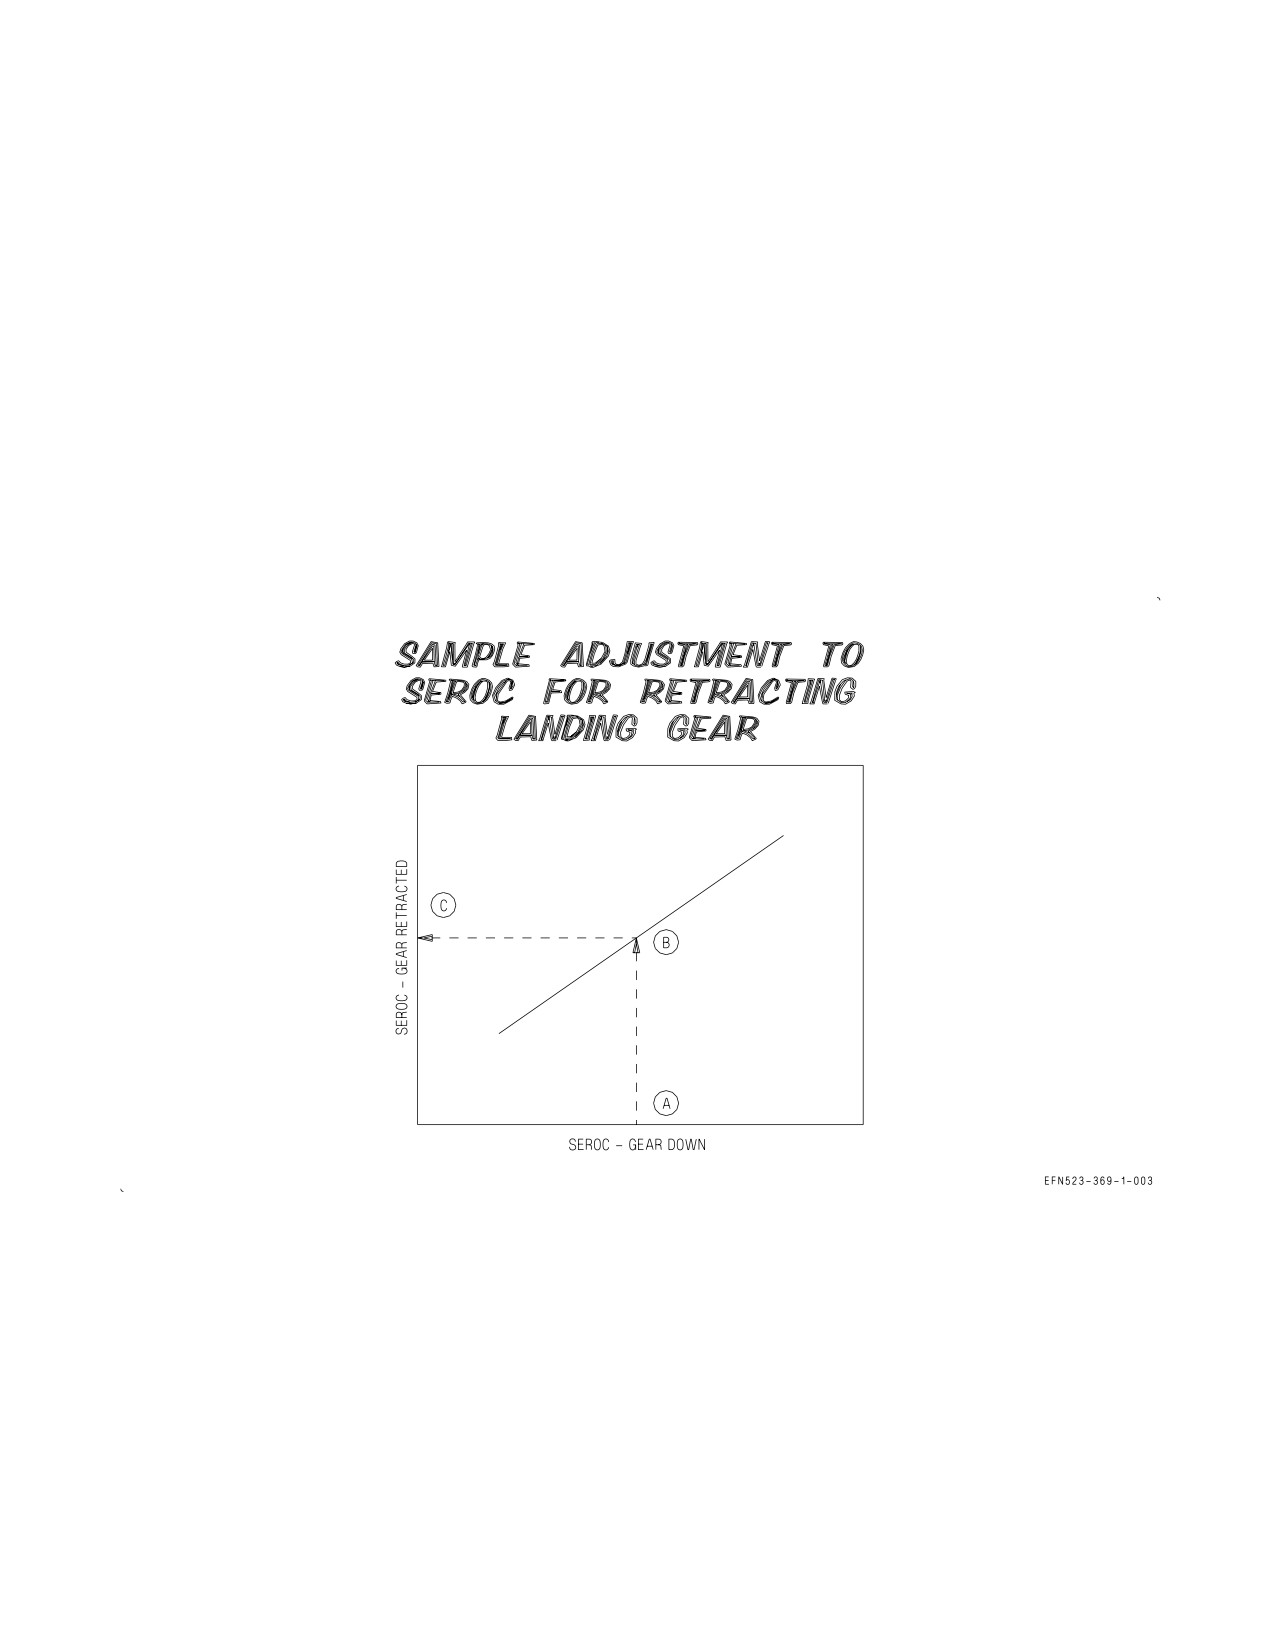
4.8 ADJUSTMENT TO SEROC FOR RETRACTING LANDING GEAR CHART
This chart (figure 4-14) provides the effect of raising the landing gear on single engine rate of climb
capability in the catapult launch (full flaps, gear down) and field takeoff (half flaps, gear down)
configurations with maximum afterburner thrust on the operating engine. Gear up single engine rate
of climb is presented as a function of gear down single engine rate of climb and the angle of attack
required to maintain 1g, unaccelerated flight as determined from figure 4-12 and 4-13.
4.8.1 Use. Enter the chart with the gear down single engine rate of climb established using figure 4-14
and project vertically upward to the appropriate angle of attack. From this intersection, project
horizontally left to obtain the corresponding gear up single engine rate of climb.
4.8.2 Sample Problem.
A. Gear down SEROC
2000 FPM
B. 1g trim AOA
6.5°
C. Gear up SEROC
2400 FPM
XI-4-11
ORIGINAL

A1-F18EA-NFM-200
TAKEOFF ALLOWANCES AND
ACCELERATION TO CLIMB SPEED
F414-GE-400
AIRCRAFT CONFIGURATION
REMARKS
VARIOUS DRAG INDEXES
ENGINE(S): (2) F414-GE-400
U.S. STANDARD DAY, 1962
DATE: 29 OCTOBER 1999
FUEL GRADE: JP-5
DATA BASIS: FLIGHT DERIVED
FUEL DENSITY: 6.8 LB/GAL
START E 10 LB /ENG
TAXI AT IDLE E 15 LB /MIN /ENG
ENGINE RUNUP, 30 SEC AT MIL E 90 LB /ENG OR 30 SEC AT MAXE 290 LB/ENG
BRAKE RELEASE TO CLIMB SPEED (NOMINAL VALUES)
MIL TAKEOFF
MIL TAKEOFF
MAX TAKEOFF
MAX TAKEOFF
MIL ACCEL TO 350
MIL ACCEL TO MIL
MIL ACCEL TO MIL
MAX ACCEL TO
KNOTS
CLIMB SPEED
CLIMB SPEED
MAX CLIMB SPEED
TIME (MIN)
0.9
1.1
1.1
1.0
FUEL (LB)
350
460
870
1300
DIST (NM)
2.3
4.3
4.1
3.3
TIME (MIN)
1.2
1.2
1.1
1.0
FUEL (LB)
440
480
870
1350
DIST (NM)
3.5
4.1
3.8
3.4
Figure 4-1. Takeoff Allowances and Acceleration to Climb Speed
XI-4-12
ORIGINAL
A1-F18EA-NFM-200
CLIMB SPEED SCHEDULE
F414-GE-400
MILITARY THRUST
AIRCRAFT CONFIGURATION
REMARKS
VARIOUS DRAG INDEXES
ENGINE(S): (2) F414-GE-400
ALL GROSS WEIGHTS
U.S. STANDARD DAY, 1962
DATE: 29 OCTOBER 1999
FUEL GRADE: JP-5
DATA BASIS: FLIGHT DERIVED
FUEL DENSITY: 6.8 LB/GAL
AIRCRAFT DRAG INDEX
PRESSURE
ALTITUDE
0
25
50
75
100
125
150
(feet)
KCAS
MACH
KCAS
MACH
KCAS
MACH
KCAS
MACH
KCAS
MACH
KCAS
MACH
KCAS
MACH
Sea Level
515
0.78
500
0.76
490
0.74
475
0.72
475
0.72
460
0.70
420
0.63
5000
515
0.84
500
0.82
490
0.80
475
0.78
475
0.78
460
0.75
420
0.69
10,000
478
0.85
478
0.85
466
0.83
460
0.82
460
0.82
449
0.80
420
0.75
15,000
437
0.85
437
0.85
426
0.83
421
0.82
421
0.82
410
0.80
405
0.79
20,000
398
0.85
398
0.85
388
0.83
383
0.82
383
0.82
373
0.80
368
0.79
25,000
361
0.85
361
0.85
351
0.83
347
0.82
347
0.82
338
0.80
333
0.79
30,000
325
0.85
325
0.85
316
0.83
312
0.82
312
0.82
304
0.80
300
0.79
35,000
291
0.85
291
0.85
283
0.83
279
0.82
279
0.82
272
0.80
268
0.79
40,000
259
0.85
259
0.85
252
0.83
249
0.82
249
0.82
242
0.80
239
0.79
AIRCRAFT DRAG INDEX
PRESSURE
ALTITUDE
175
200
225
250
275
300
(feet)
KCAS
MACH
KCAS
MACH
KCAS
MACH
KCAS
MACH
KCAS
MACH
KCAS
MACH
Sea Level
400
0.60
380
0.57
360
0.54
330
0.50
300
0.45
300
0.45
5000
400
0.66
380
0.62
360
0.59
330
0.54
300
0.49
300
0.49
10,000
400
0.72
380
0.68
360
0.65
330
0.59
300
0.54
300
0.54
15,000
389
0.76
380
0.74
360
0.71
330
0.65
300
0.59
300
0.59
20,000
353
0.76
353
0.76
353
0.76
330
0.71
300
0.65
300
0.65
25,000
319
0.76
319
0.76
319
0.76
319
0.76
300
0.72
297
0.71
30,000
287
0.76
287
0.76
287
0.76
287
0.76
279
0.74
267
0.71
35,000
257
0.76
257
0.76
257
0.76
257
0.76
250
0.74
239
0.71
40,000
229
0.76
229
0.76
229
0.76
229
0.76
222
0.74
212
0.71
NOTE
FUEL ALLOWANCE FOR TAKEOFF AND ACCELERATION
TO CLIMB SPEED IS 1200 POUNDS, AND IS BASED ON
START, 20 MINUTES AT IDLE, 30 SECONDS RUNUP
AT MIL, AND A MIL POWER TAKEOFF.
Figure 4-2. Military Thrust Climb (Sheet 1 of 6)
XI-4-13
ORIGINAL
A1-F18EA-NFM-200
Figure 4-2. Military Thrust Climb (Sheet 2 of 6)
XI-4-14
ORIGINAL
A1-F18EA-NFM-200
Figure 4-2. Military Thrust Climb (Sheet 3 of 6)
XI-4-15
ORIGINAL
A1-F18EA-NFM-200
Figure 4-2. Military Thrust Climb (Sheet 4 of 6)
XI-4-16
CHANGE 2
A1-F18EA-NFM-200
Figure 4-2. Military Thrust Climb (Sheet 5 of 6)
XI-4-17
CHANGE 2
A1-F18EA-NFM-200
Figure 4-2. Military Thrust Climb (Sheet 6 of 6)
XI-4-18
CHANGE 2

A1-F18EA-NFM-200
CLIMB SPEED SCHEDULE
F414-GE-400
MILITARY THRUST
AIRCRAFT CONFIGURATION
REMARKS
VARIOUS DRAG INDEXES
ENGINE: (1) F414-GE-400
ALL GROSS WEIGHTS
U.S. STANDARD DAY, 1962
ONE ENGINE OPERATING
INOPERATIVE ENGINE WINDMILLING
DATE: 29 OCTOBER 1999
FUEL GRADE: JP-5
DATA BASIS: FLIGHT DERIVED
FUEL DENSITY: 6.8 LB/GAL
AIRCRAFT DRAG INDEX
PRESSURE
ALTITUDE
0
25
50
100
(feet)
KCAS
MACH
KCAS
MACH
KCAS
MACH
KCAS
MACH
Sea Level
320
0.48
315
0.48
310
0.47
280
0.42
5000
320
0.53
315
0.52
310
0.51
280
0.46
10,000
320
0.58
315
0.57
310
0.56
280
0.51
15,000
320
0.63
315
0.62
310
0.61
280
0.55
20,000
320
0.69
315
0.68
310
0.67
280
0.61
25,000
320
0.76
310
0.74
292
0.70
280
0.67
30,000
304
0.80
279
0.74
263
0.70
263
0.70
35,000
272
0.80
250
0.74
235
0.70
235
0.70
40,000
242
0.80
222
0.74
209
0.70
209
0.70
AIRCRAFT DRAG INDEX
PRESSURE
ALTITUDE
150
200
250
300
(feet)
KCAS
MACH
KCAS
MACH
KCAS
MACH
KCAS
MACH
Sea Level
270
0.41
260
0.39
250
0.38
250
0.38
5000
270
0.45
260
0.43
250
0.41
250
0.41
10,000
270
0.49
260
0.47
250
0.45
250
0.45
15,000
270
0.54
260
0.52
250
0.50
250
0.50
20,000
270
0.59
260
0.57
250
0.55
250
0.55
25,000
270
0.65
260
0.63
250
0.60
250
0.60
30,000
263
0.70
260
0.69
250
0.67
250
0.67
35,000
235
0.70
235
0.70
235
0.70
235
0.70
40,000
209
0.70
209
0.70
209
0.70
209
0.70
NOTE
FUEL ALLOWANCE FOR TAKEOFF AND ACCELERATION
TO CLIMB SPEED IS 1200 POUNDS, AND IS BASED ON
START, 20 MINUTES AT IDLE, 30 SECONDS RUNUP
AT MIL, AND A MIL POWER TAKEOFF.
Figure 4-3. Single Engine Military Thrust Climb (Sheet 1 of 6)
XI-4-19
ORIGINAL
A1-F18EA-NFM-200
Figure 4-3. Single Engine Military Thrust Climb (Sheet 2 of 6)
XI-4-20
ORIGINAL
A1-F18EA-NFM-200
Figure 4-3. Single Engine Military Thrust Climb (Sheet 3 of 6)
XI-4-21
ORIGINAL
A1-F18EA-NFM-200
Figure 4-3. Single Engine Military Thrust Climb (Sheet 4 of 6)
XI-4-22
CHANGE 2
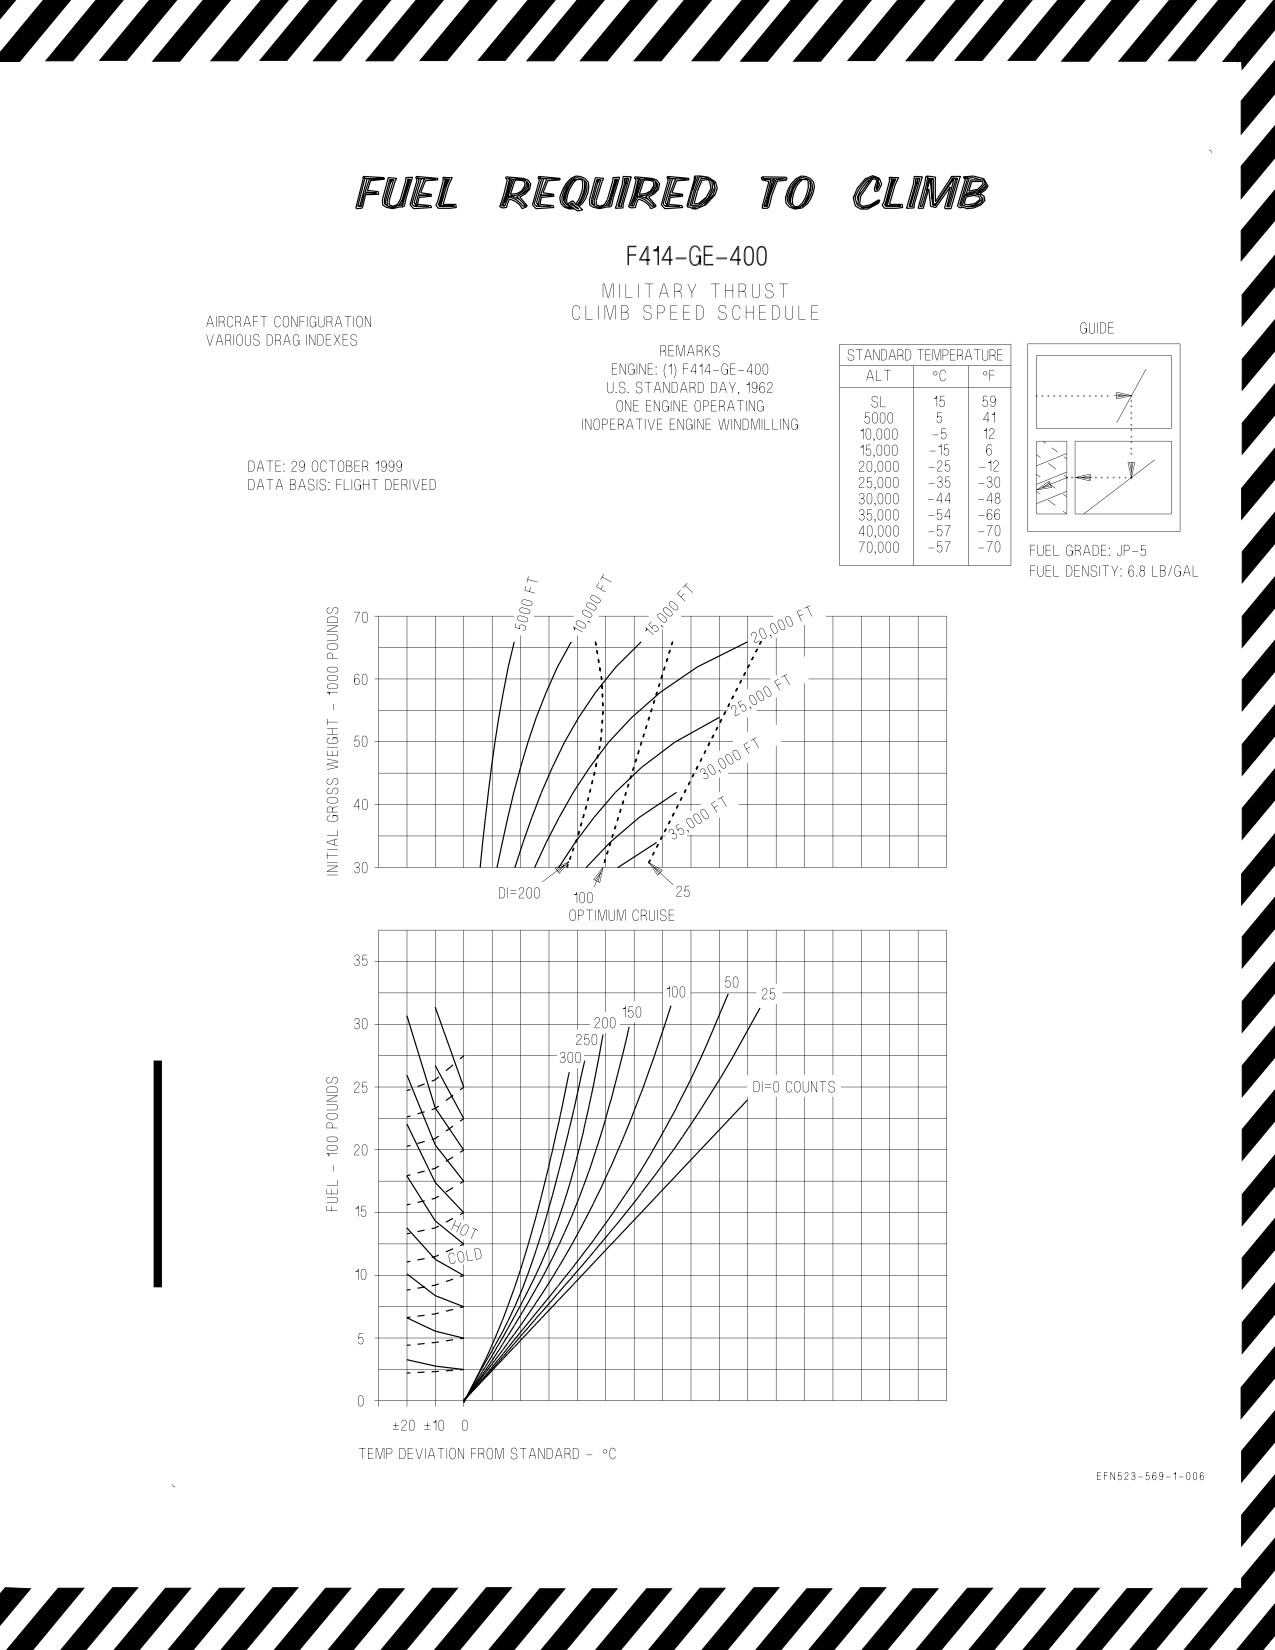
A1-F18EA-NFM-200
Figure 4-3. Single Engine Military Thrust Climb (Sheet 5 of 6)
XI-4-23
CHANGE 2
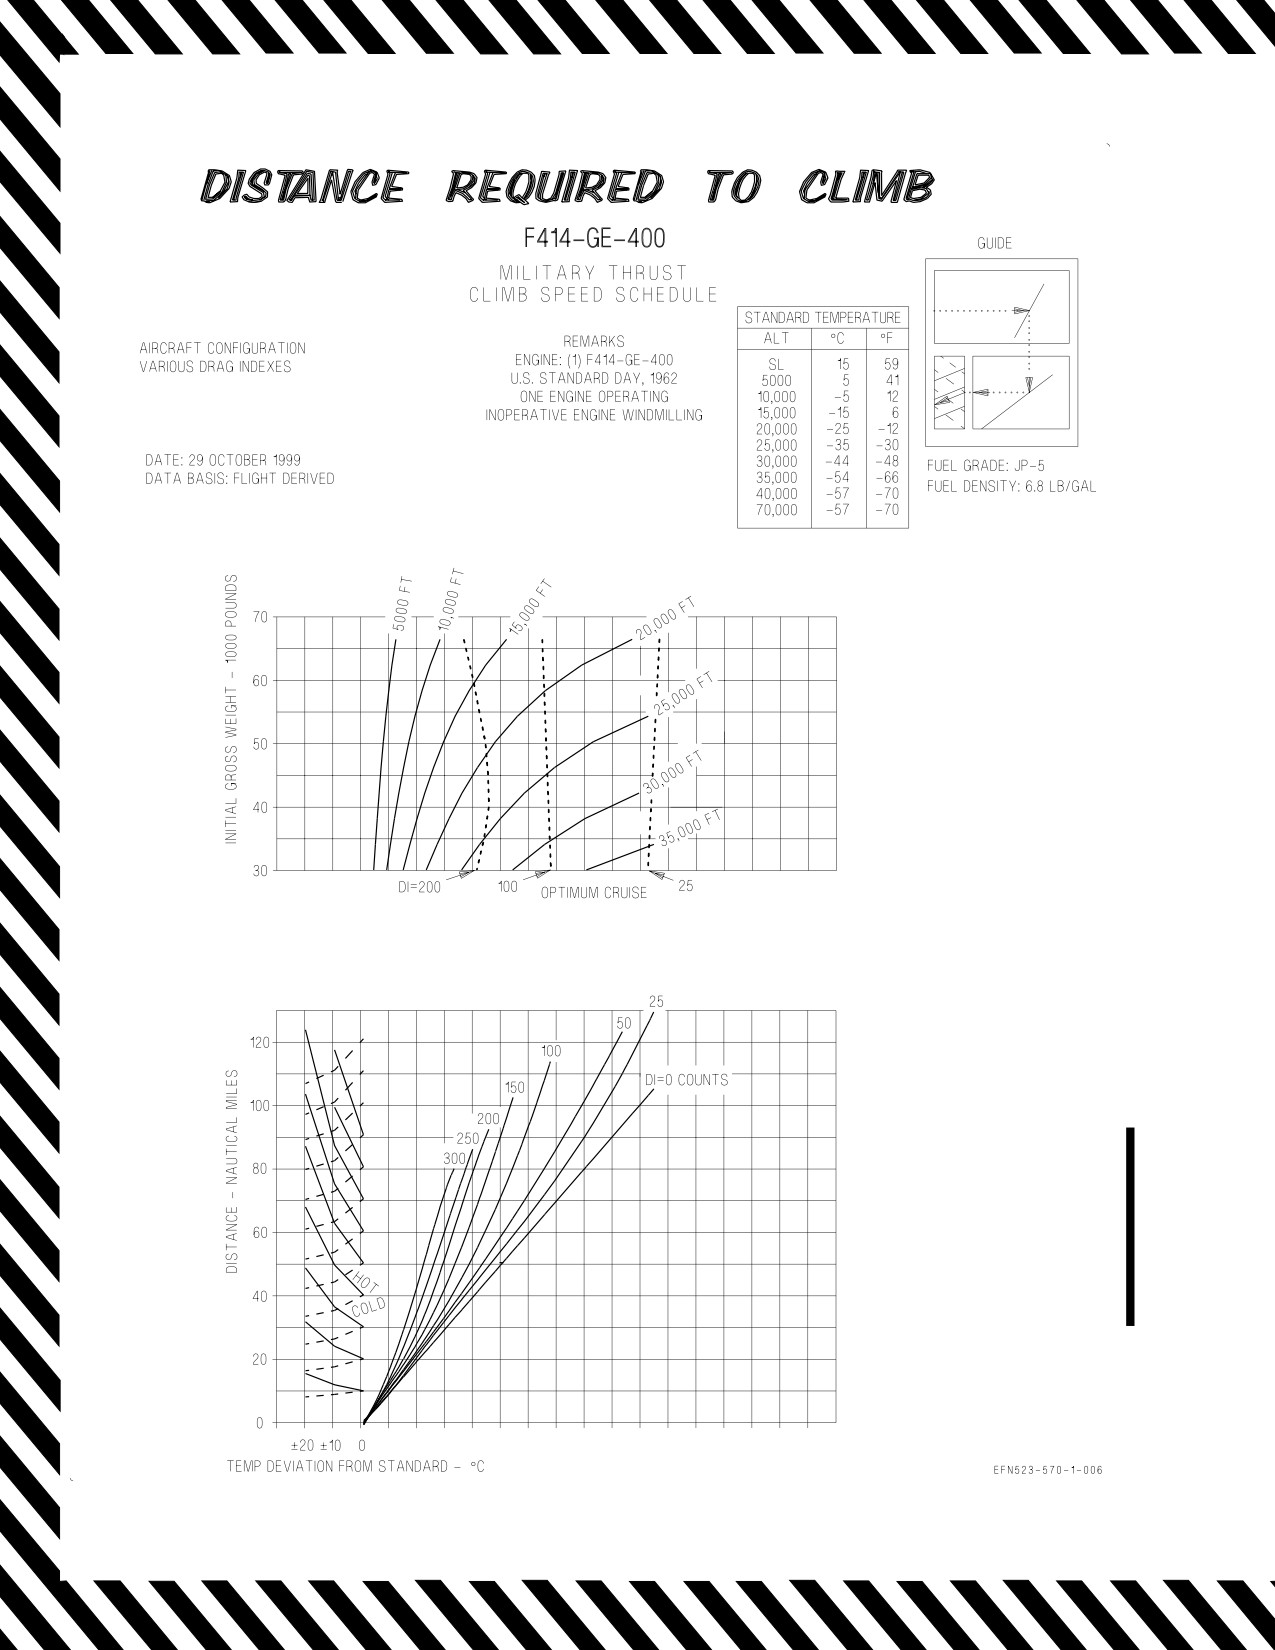
A1-F18EA-NFM-200
Figure 4-3. Single Engine Military Thrust Climb (Sheet 6 of 6)
XI-4-24
CHANGE 2
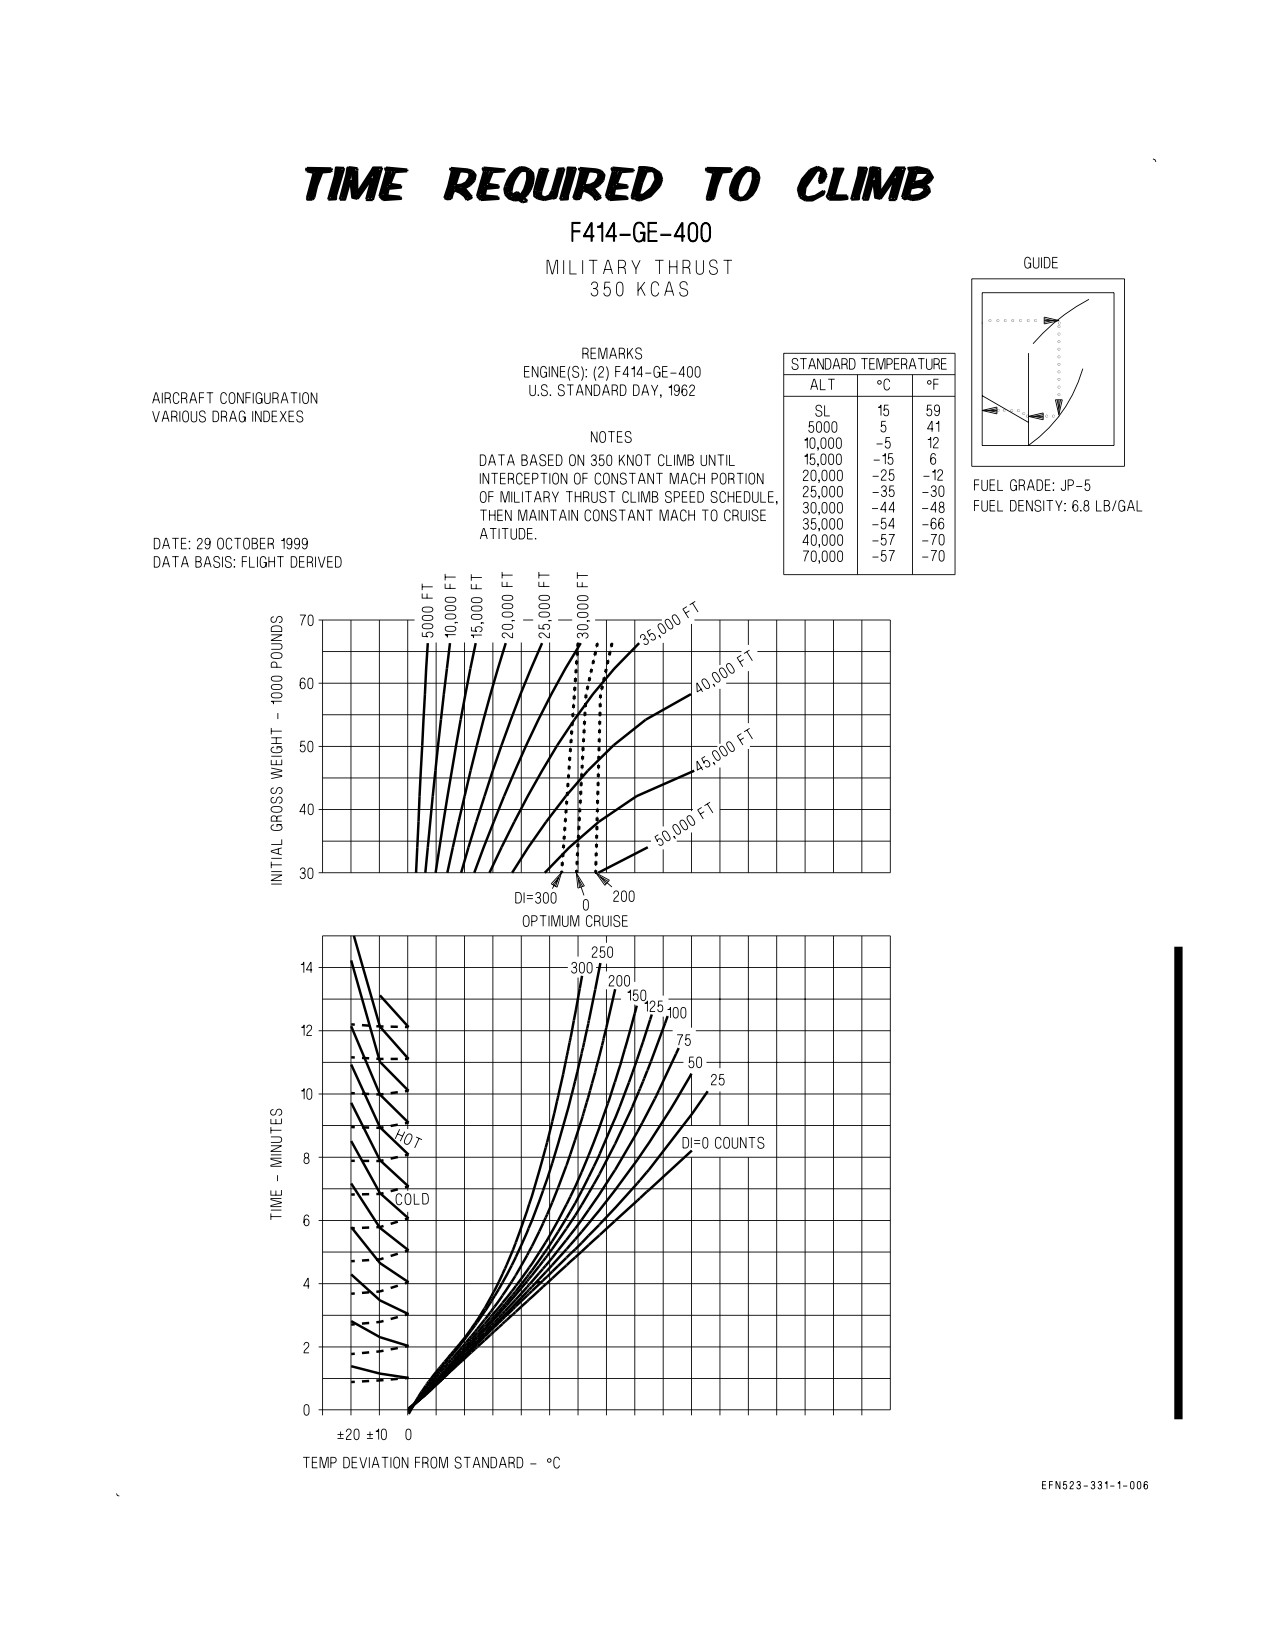
A1-F18EA-NFM-200
Figure 4-4. Time Required to Climb - 350 KCAS
XI-4-25
CHANGE 2
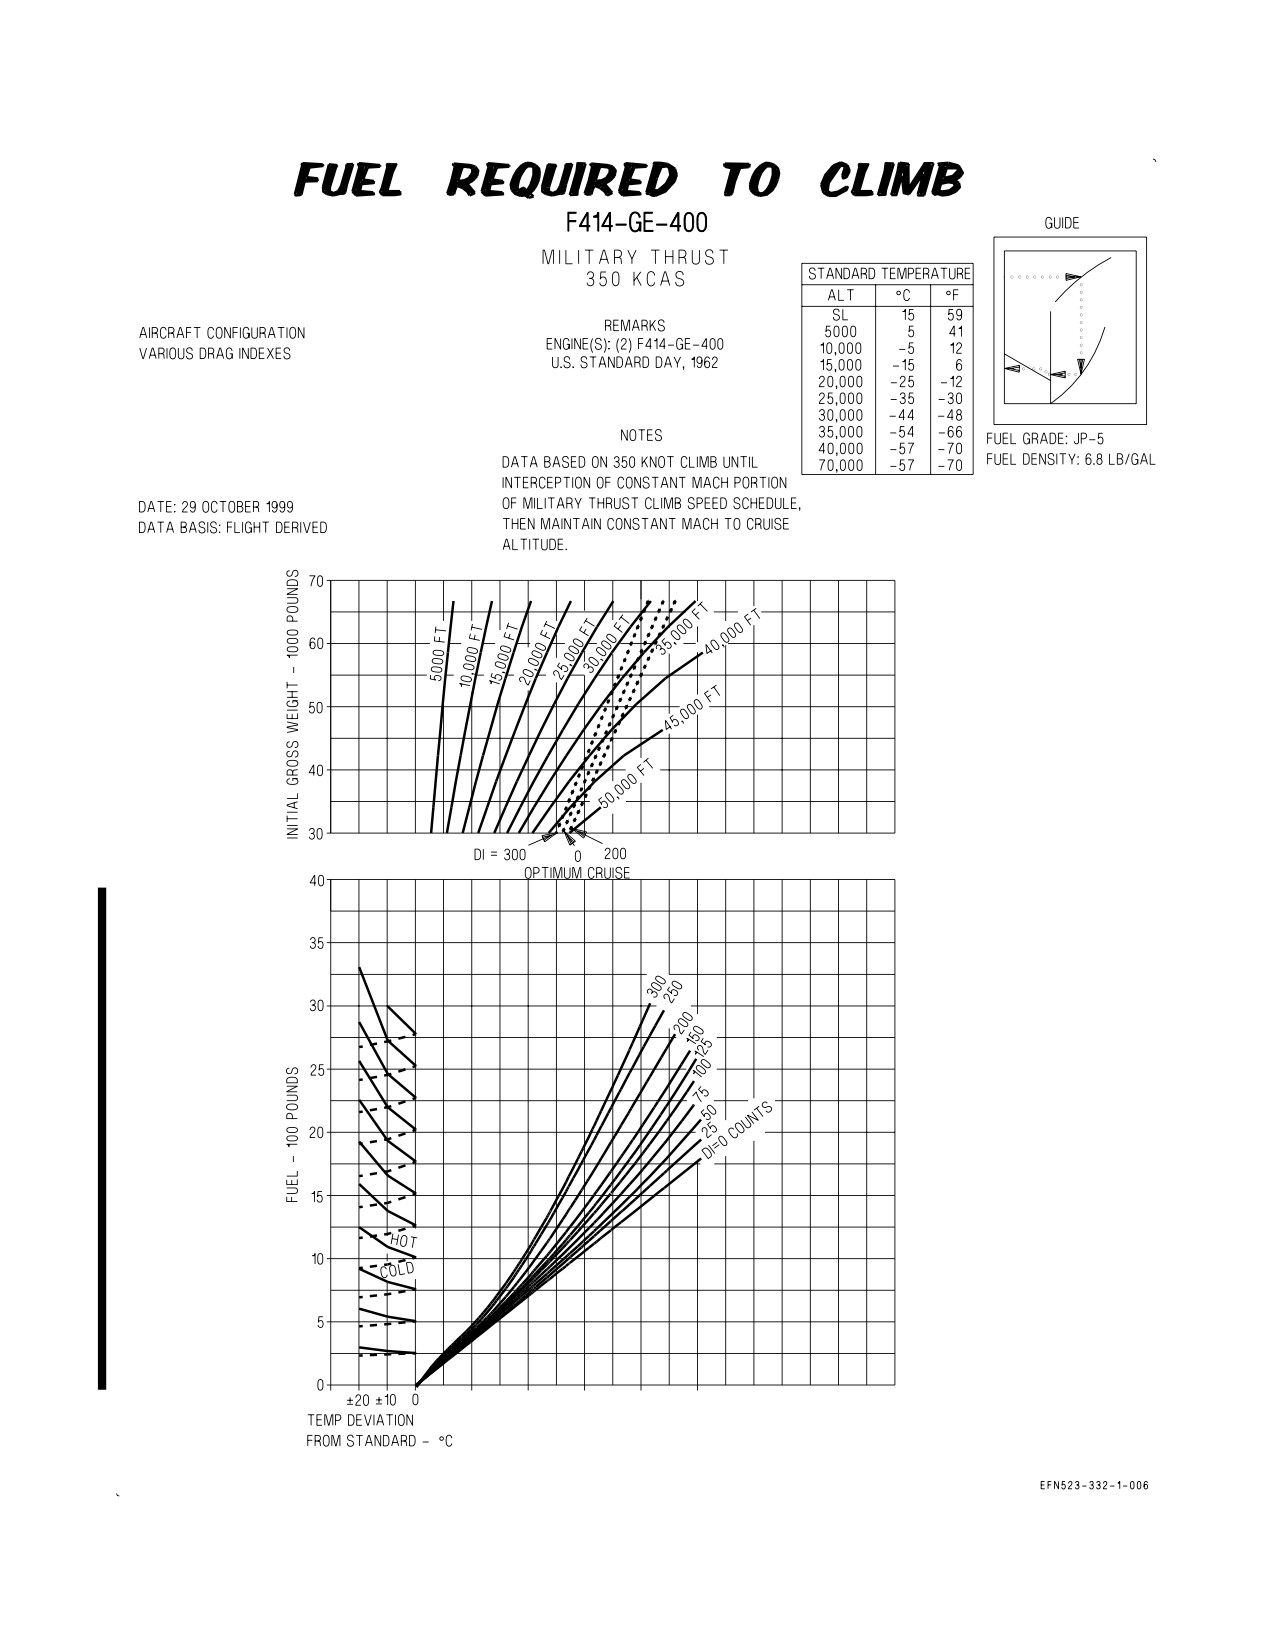
A1-F18EA-NFM-200
Figure 4-5. Fuel Required to Climb - 350 KCAS
XI-4-26
CHANGE 2
A1-F18EA-NFM-200
Figure 4-6. Distance Required to Climb - 350 KCAS
XI-4-27
CHANGE 2
A1-F18EA-NFM-200
Figure 4-7. Peak Rate of Climb - Military Thrust (Sheet 1 of 4)
XI-4-28
ORIGINAL
A1-F18EA-NFM-200
Figure 4-7. Peak Rate of Climb - Military Thrust (Sheet 2 of 4)
XI-4-29
CHANGE 2
A1-F18EA-NFM-200
Figure 4-7. Peak Rate of Climb - Military Thrust (Sheet 3 of 4)
XI-4-30
CHANGE 2
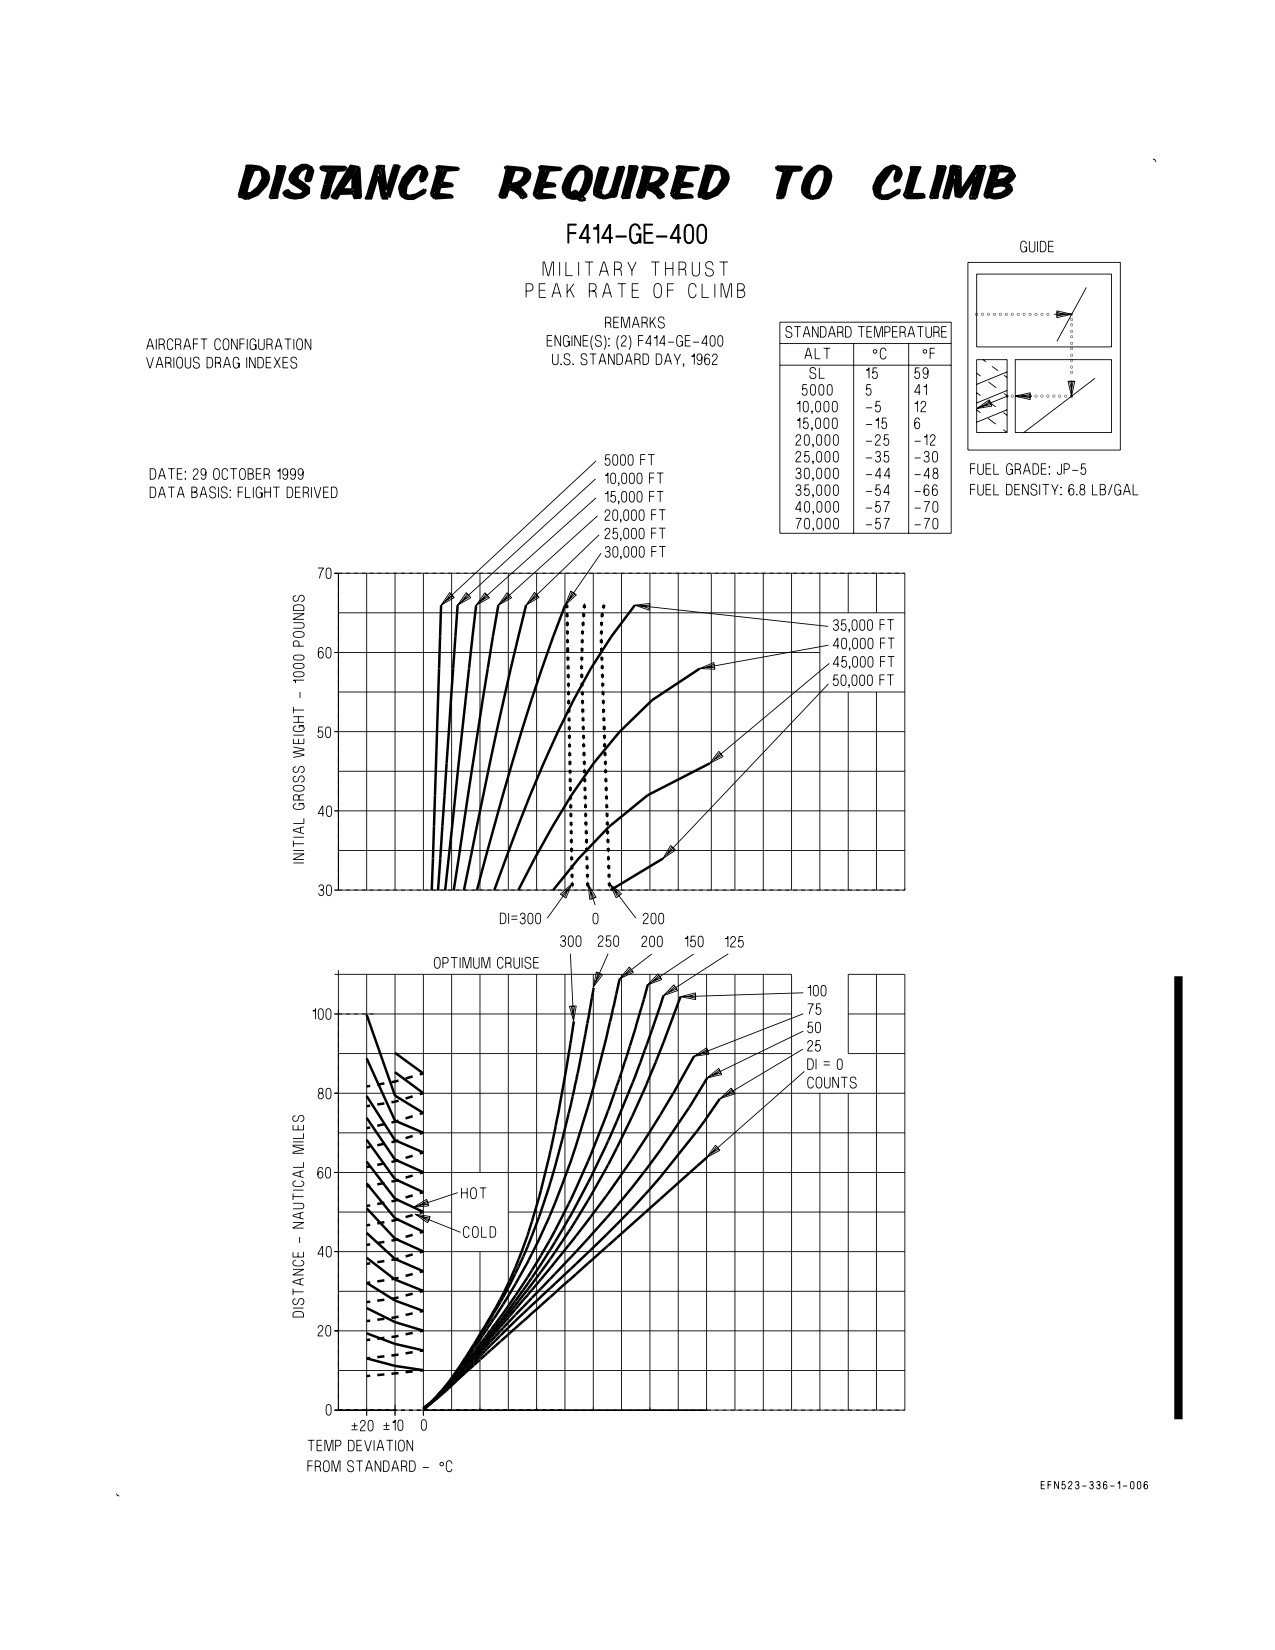
A1-F18EA-NFM-200
Figure 4-7. Peak Rate of Climb - Military Thrust (Sheet 4 of 4)
XI-4-31
CHANGE 2
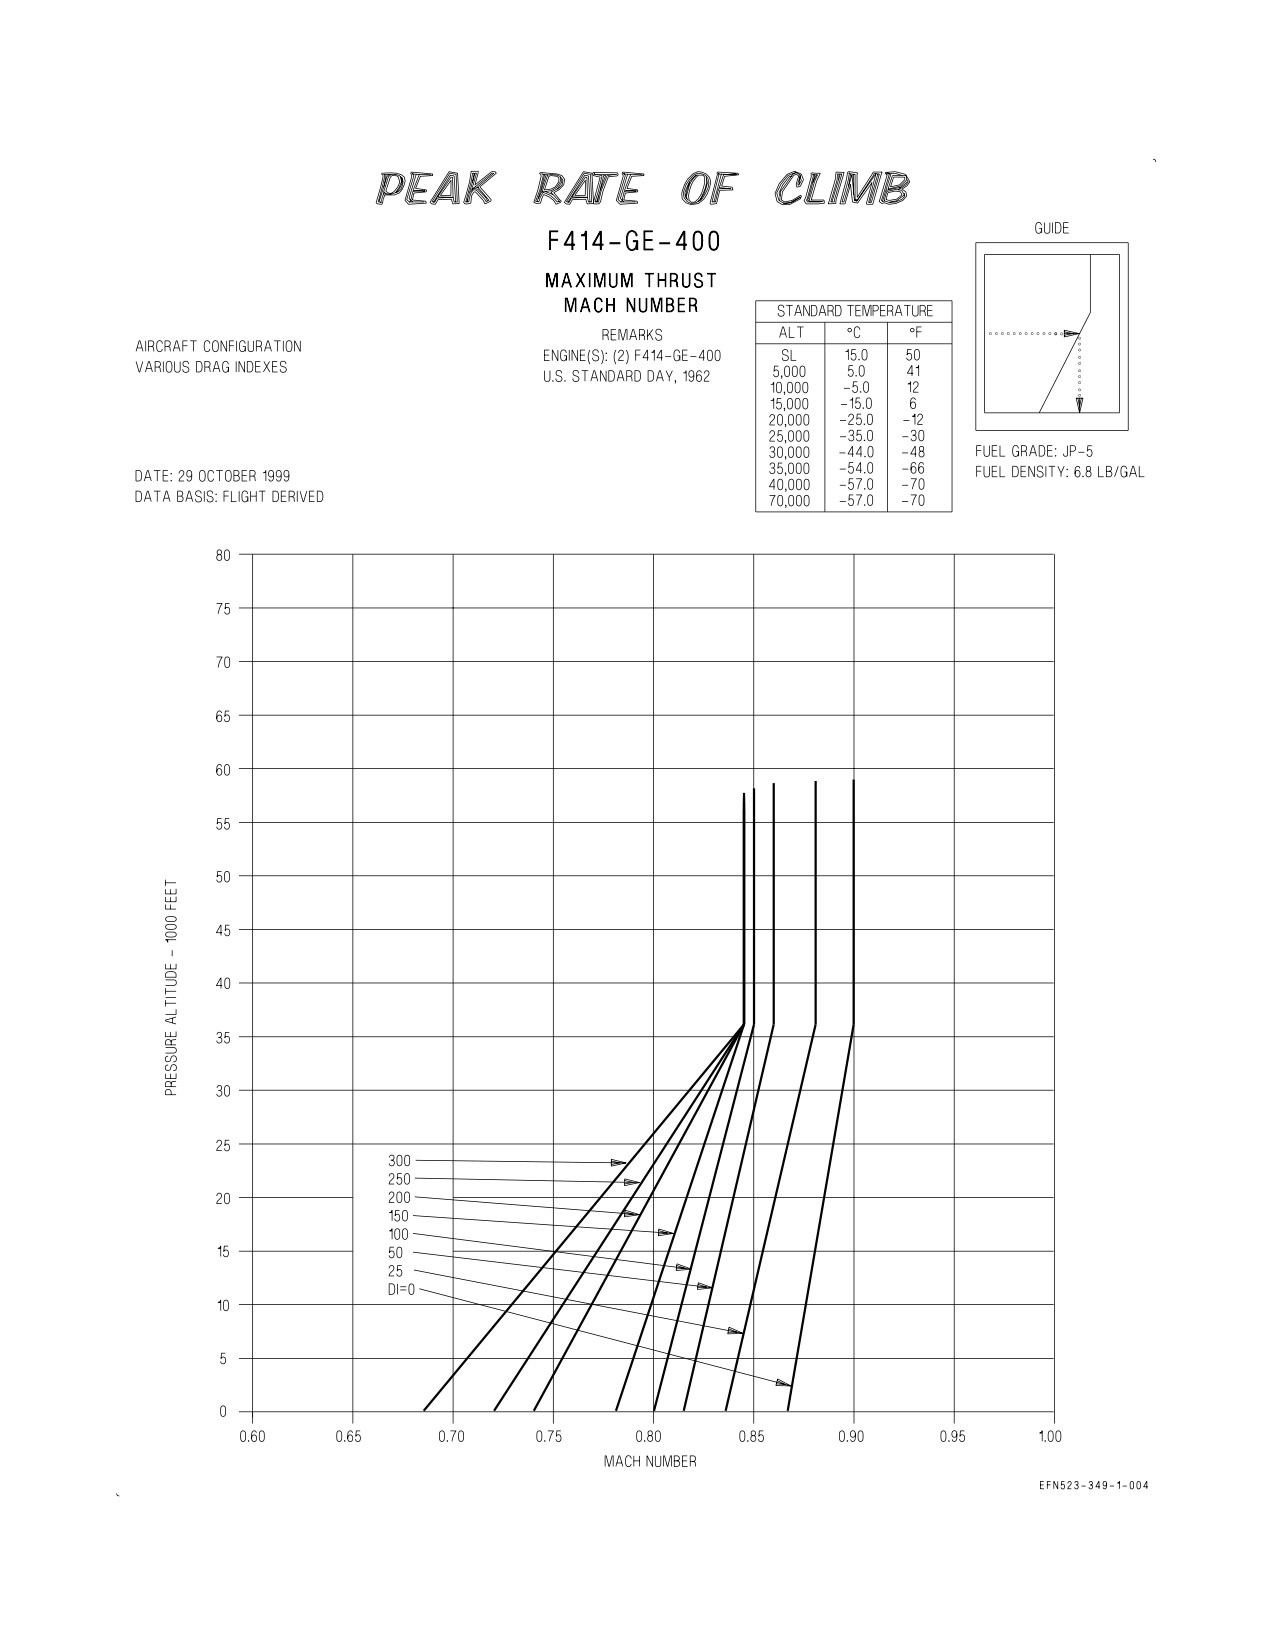
A1-F18EA-NFM-200
Figure 4-8. Peak Rate of Climb - Maximum Thrust (Sheet 1 of 5)
XI-4-32
ORIGINAL
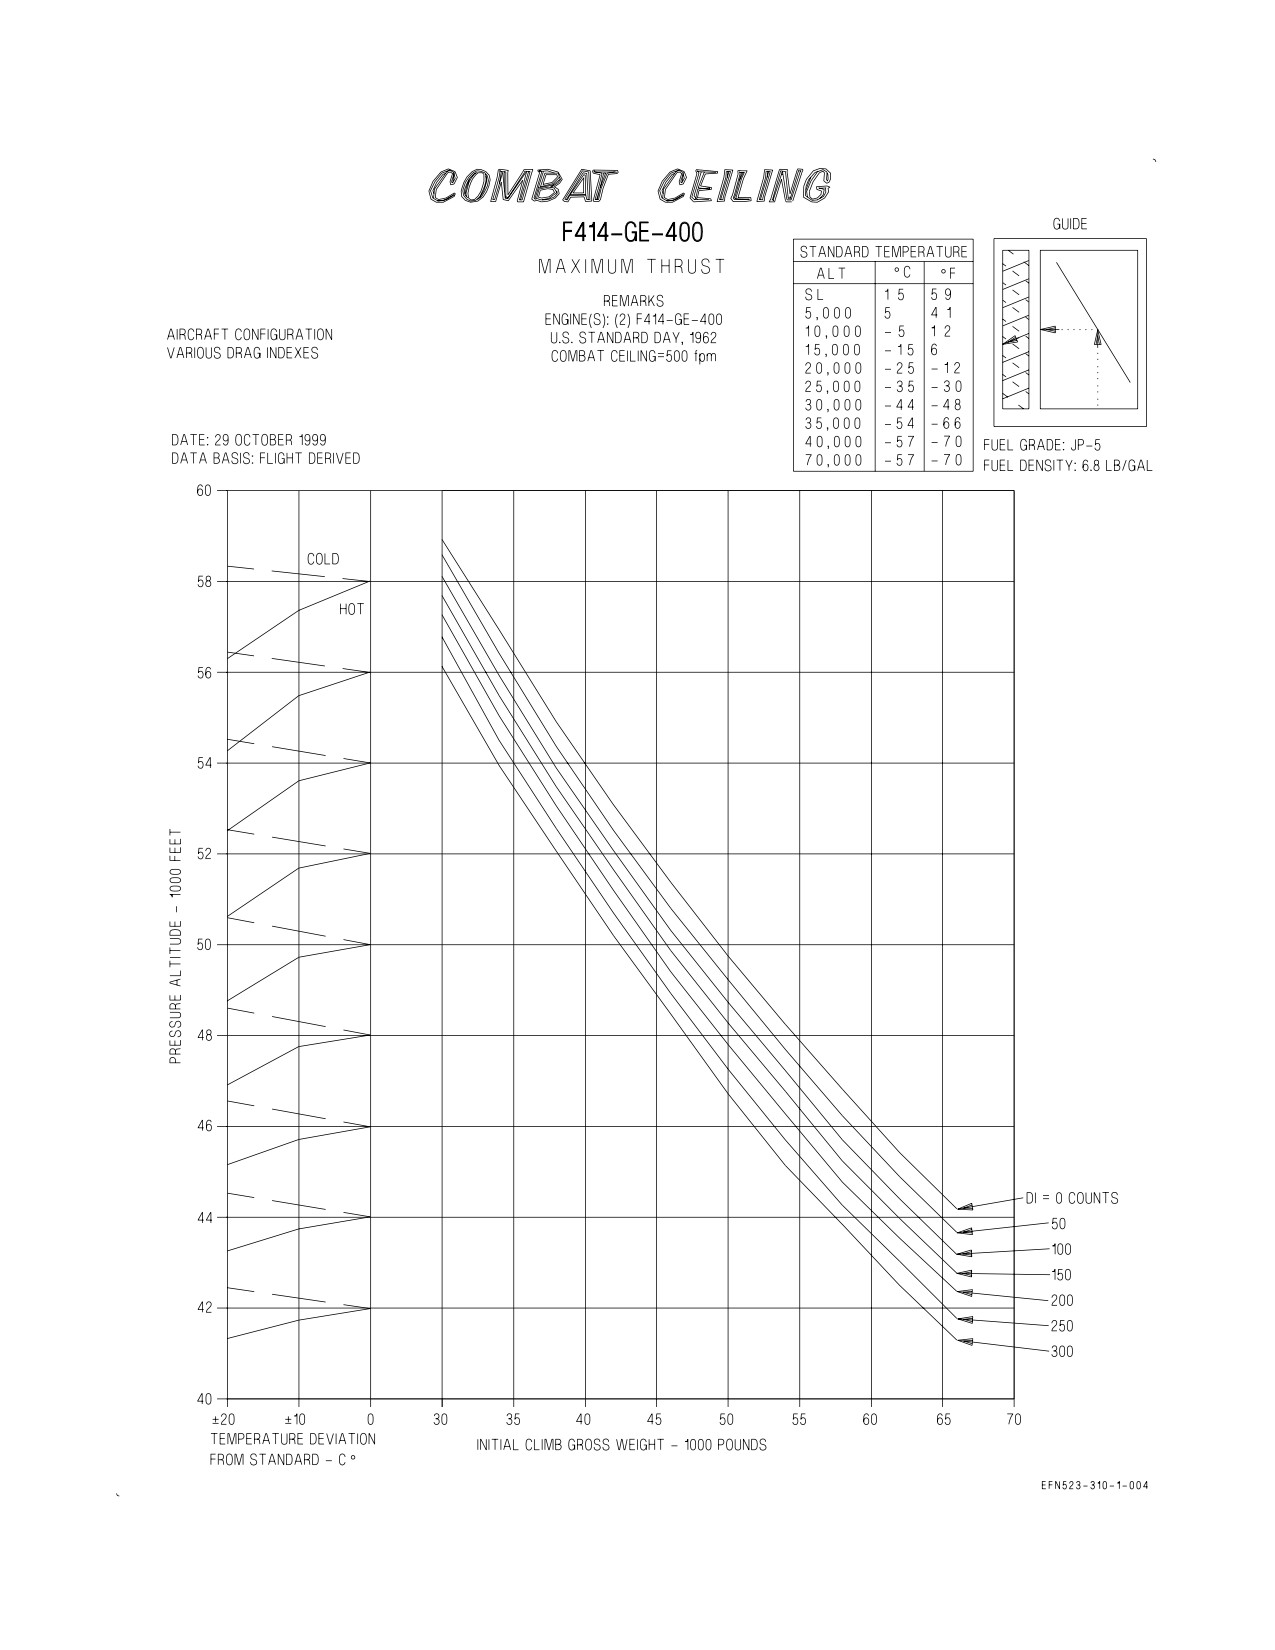
A1-F18EA-NFM-200
Figure 4-8. Peak Rate of Climb - Maximum Thrust (Sheet 2 of 5)
XI-4-33
ORIGINAL
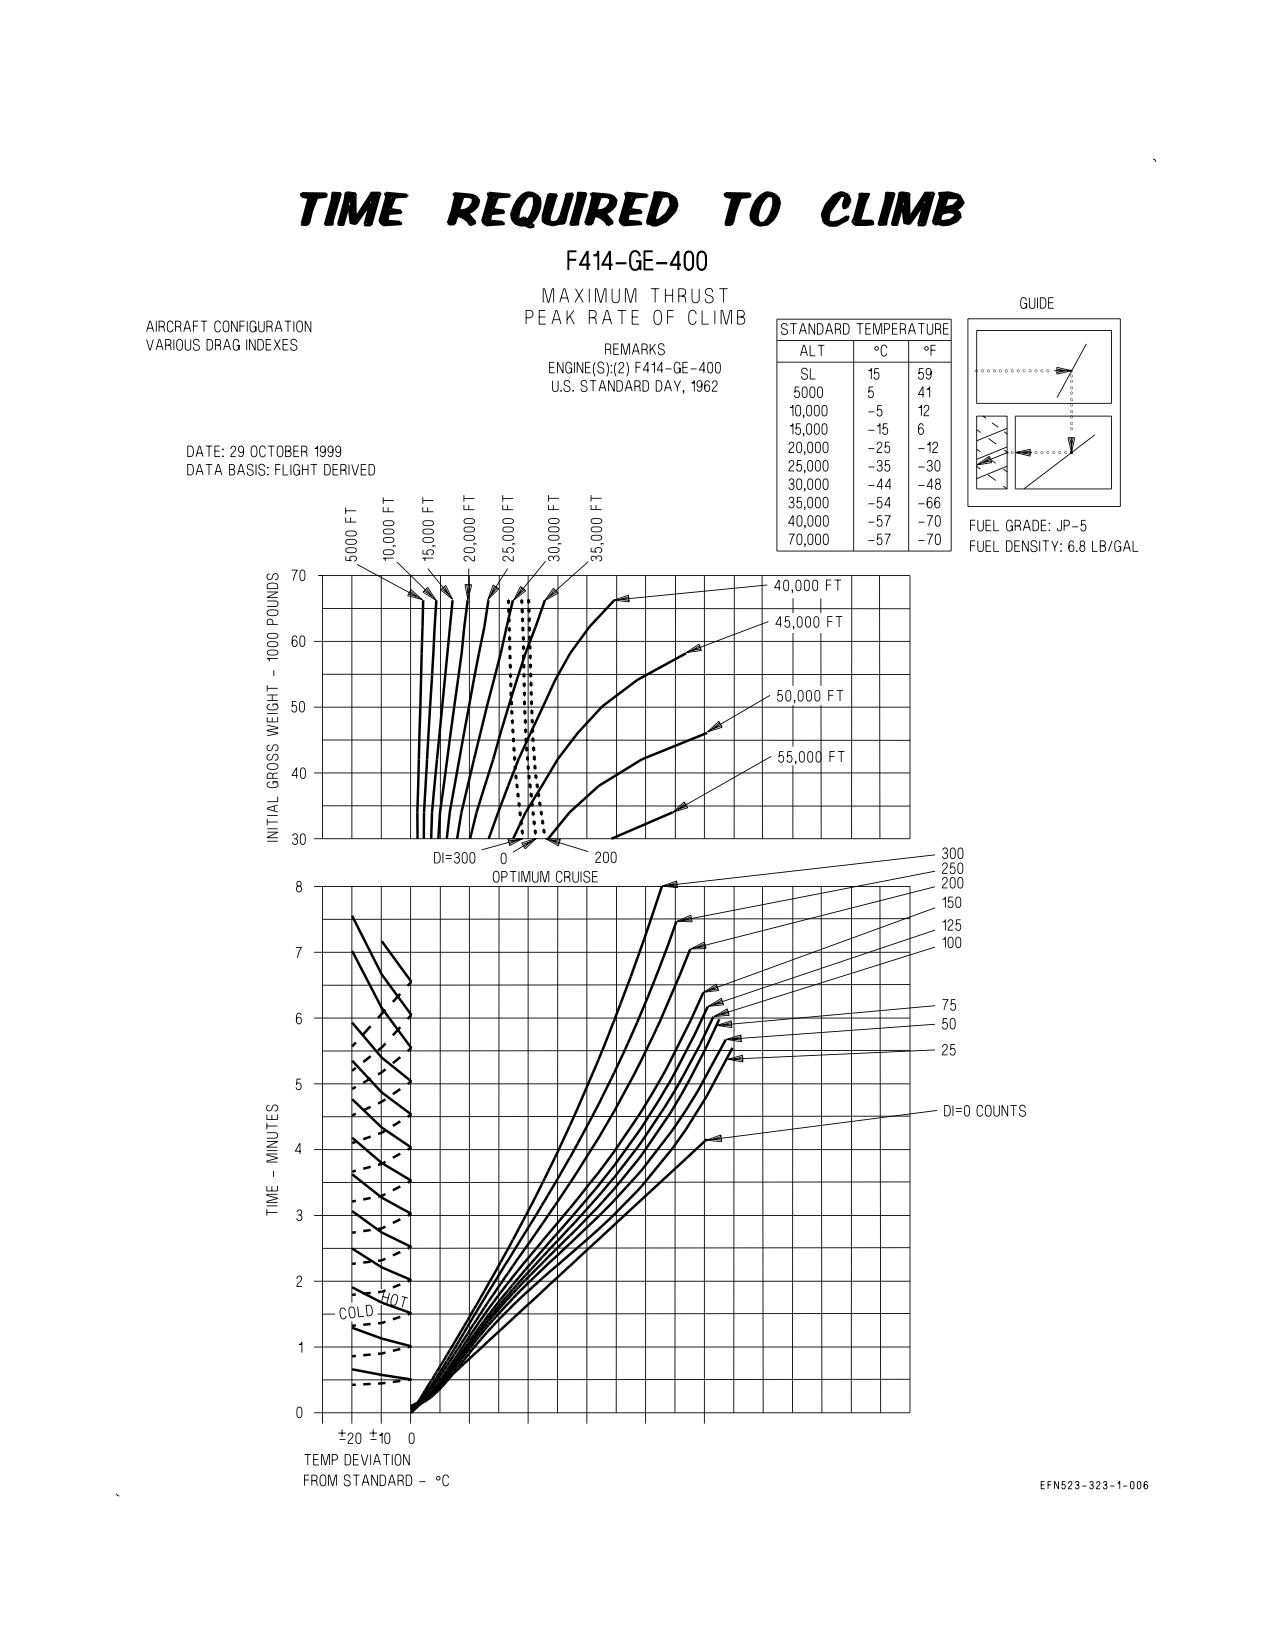
A1-F18EA-NFM-200
Figure 4-8. Peak Rate of Climb - Maximum Thrust (Sheet 3 of 5)
XI-4-34
CHANGE 2
A1-F18EA-NFM-200
Figure 4-8. Peak Rate of Climb - Maximum Thrust (Sheet 4 of 5)
XI-4-35
CHANGE 2
A1-F18EA-NFM-200
Figure 4-8. Peak Rate of Climb - Maximum Thrust (Sheet 5 of 5)
XI-4-36
CHANGE 2
A1-F18EA-NFM-200
Figure 4-9. Instantaneous Rate of Climb - Military Thrust
XI-4-37
ORIGINAL
A1-F18EA-NFM-200
Figure 4-10. Instantaneous Rate of Climb - Maximum Thrust
XI-4-38
ORIGINAL
A1-F18EA-NFM-200
Figure 4-11. Supersonic Maximum Thrust Climb (Sheet 1 of 4)
XI-4-39
ORIGINAL