HELICOPTER, ATTACK, AH-64D LONGBOW APACHE. TECHNICAL MANUAL (2002) - page 14
TM 1-1520-251-10
CRUISE
CRUISE
AH64D
PRESSURE ALTITUDE 10,000 FEET
T700GE701
101% NR RPM, 8 HELLFIRE CONFIGURATION, JP8 FUEL
FAT = 50°C
FAT = 40°C
INDICATED
TOTAL FUEL FLOW LB/HOUR
AIRSPEED
TOTAL FUEL FLOW LB/HOUR
KNOTS
600
800
1000
1200
600
800
1000
1200
170
∆Q %
∆Q %
∆ F = 10.0 SQ FT
∆ F = 10.0 SQ FT
180
0
10
20
0
10
20
160
180
170
150
170
160
160
140
150
V
NE
150
130
140
V
NE
140
120
130
130
MAX
110
MAX
120
RANGE
RANGE
120
100
110
110
90
100
100
80
90
90
MAX
80
70
MAX
R/C
80
R/C
OR
OR
MAX
70
60
MAX
END
70
END
60
50
60
50
40
50
40
40
30
30
30
20
20
20
10
0
30
40
50
60
70
80
90
100
30
40
50
60
70
80
90
100
INDICATED TORQUE PER ENGINE %
INDICATED TORQUE PER ENGINE %
DATA BASIS: DERIVED FROM FLIGHT TEST AND ENGINE MODEL SPEC NO. DARCOMCP22202701A, DATED 15 JANUARY 1987
LBA2486
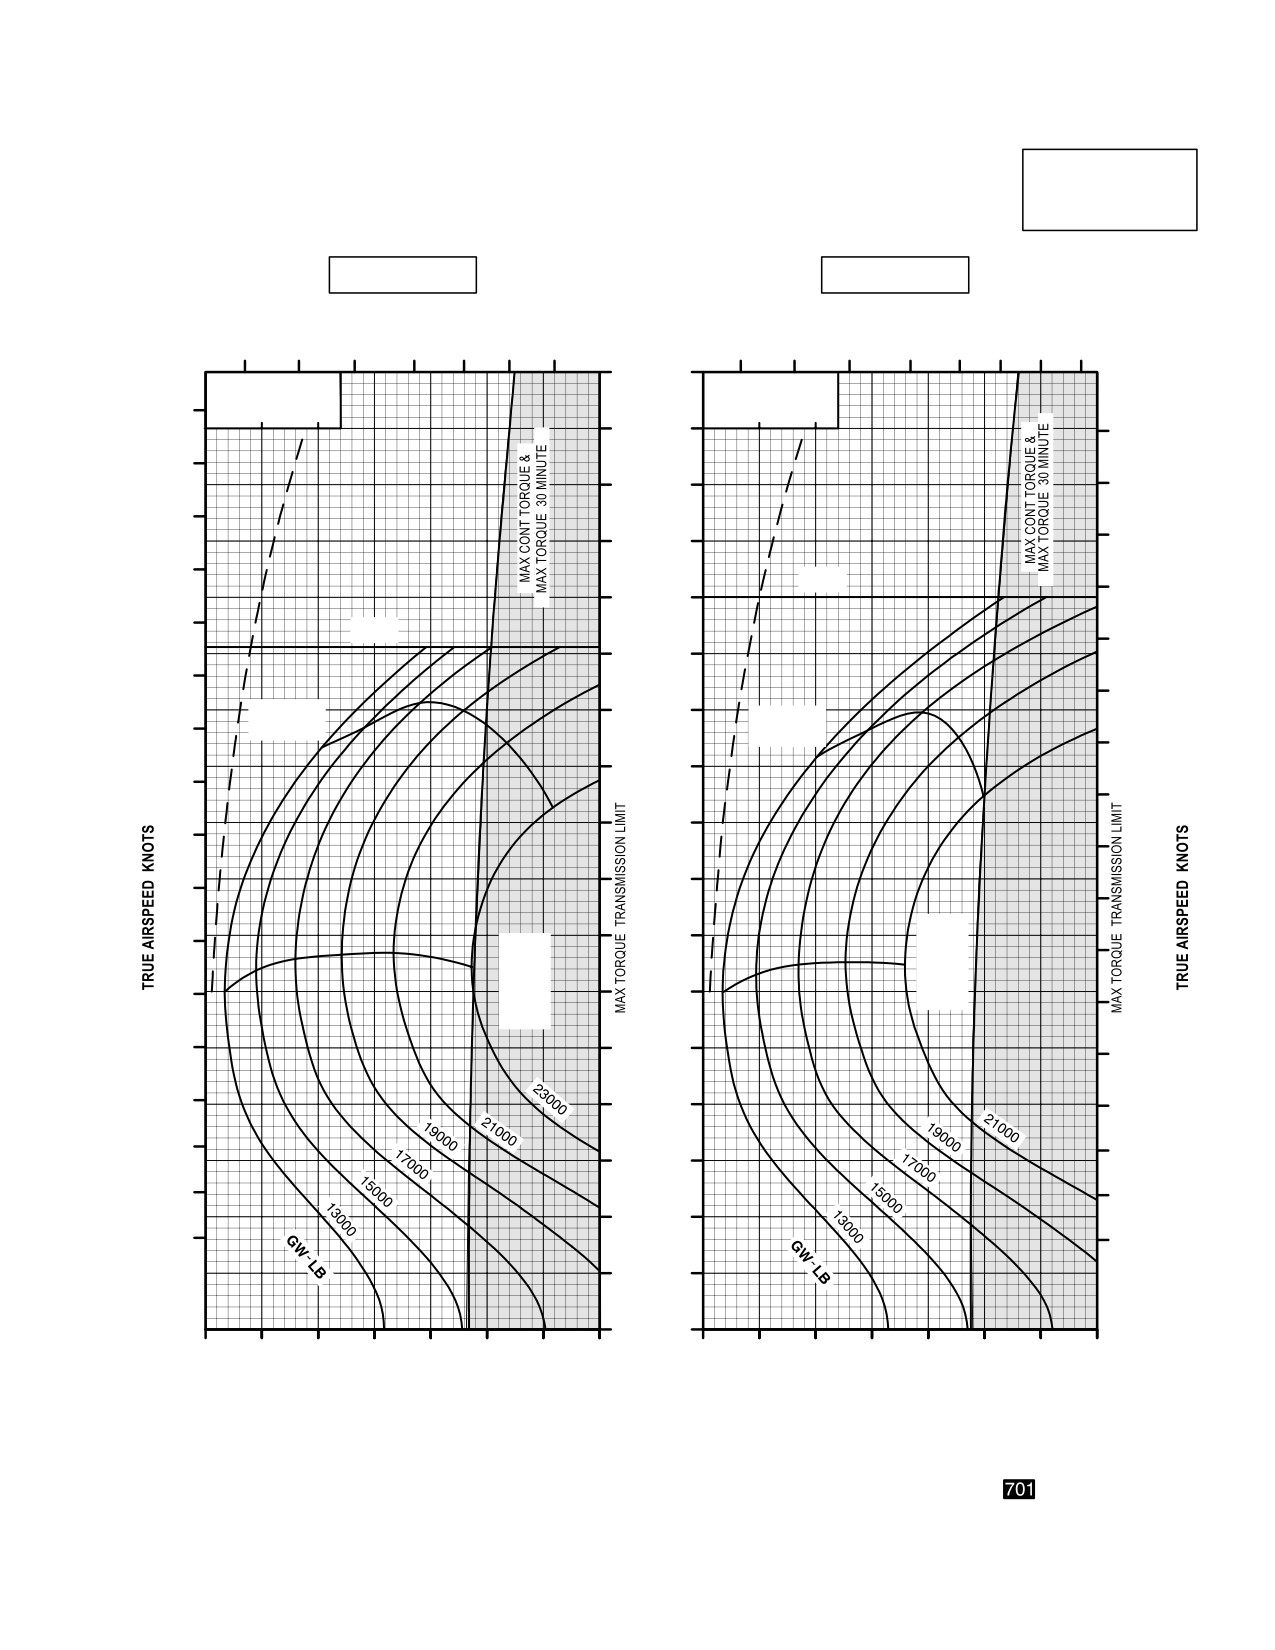
Figure 7-22. Cruise Chart, 10,000 Feet, - 50°C and - 40°C (sheet 1 of 5)
Use or disclosure of this information is subject to the restriction(s) on the title page of this document.
7-51
TM 1-1520-251-10
CRUISE
CRUISE
AH64D
PRESSURE ALTITUDE 10,000 FEET
T700GE701
101% NR RPM, 8 HELLFIRE CONFIGURATION, JP8 FUEL
FAT = 30°C
FAT = 20°C
INDICATED
TOTAL FUEL FLOW LB/HOUR
TOTAL FUEL FLOW LB/HOUR
AIRSPEED
KNOTS
600
800
1000
1200
600
800
1000
1200
170
∆Q %
∆Q %
∆ F = 10.0 SQ FT
∆ F = 10.0 SQ FT
0
10
20
0
10
20
160
180
180
150
170
170
140
160
160
150
130
150
140
120
140
130
MAX
110
MAX
130
RANGE
RANGE
120
100
120
110
110
90
100
100
80
90
90
70
80
MAX
80
MAX
R/C
R/C
60
OR
OR
70
MAX
MAX
70
END
END
50
60
60
50
40
50
40
40
30
30
30
20
20
20
10
0
30
40
50
60
70
80
90
100
30
40
50
60
70
80
90
100
INDICATED TORQUE PER ENGINE %
INDICATED TORQUE PER ENGINE %
DATA BASIS: DERIVED FROM FLIGHT TEST AND ENGINE MODEL SPEC NO. DARCOMCP22202701A, DATED 15 JANUARY 1987
LBA2487
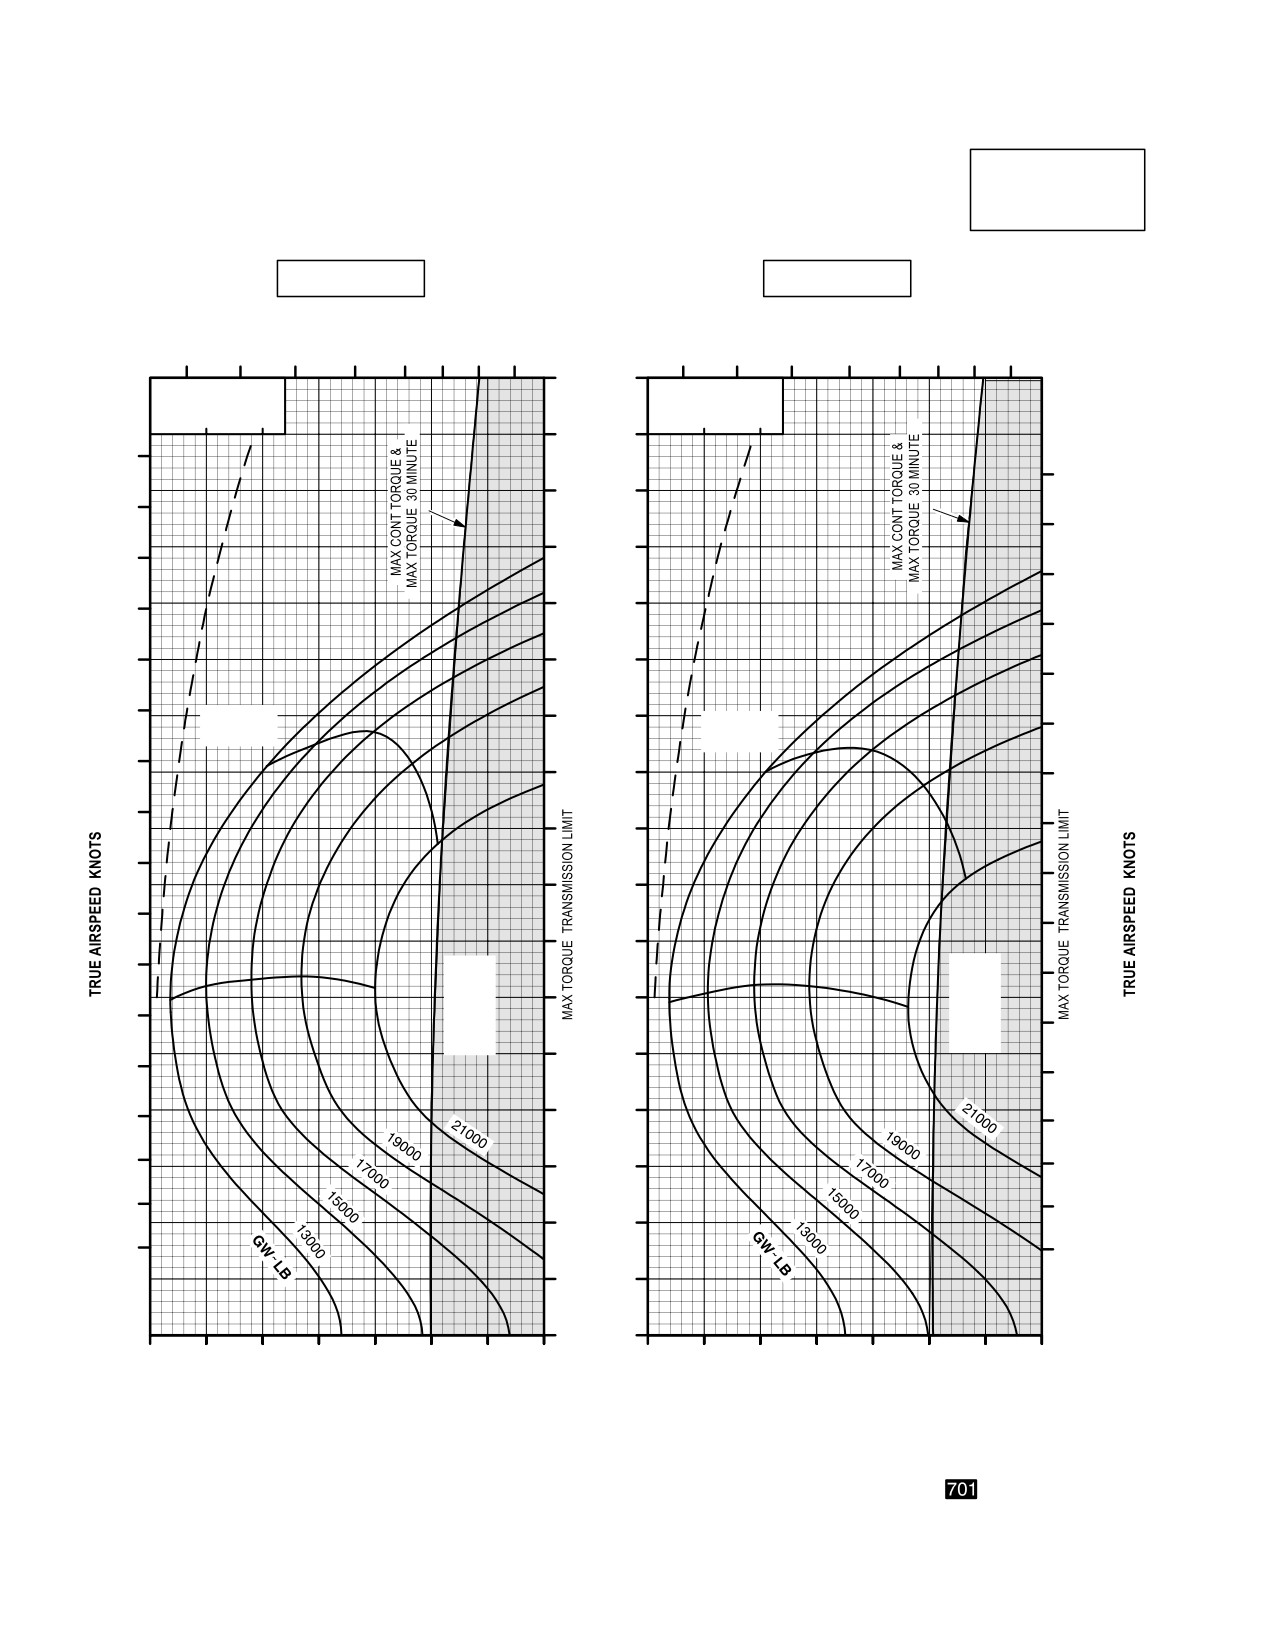
Figure 7-22. Cruise Chart, 10,000 Feet, - 30°C and - 20°C (sheet 2 of 5)
Use or disclosure of this information is subject to the restriction(s) on the title page of this document.
7-52
TM 1-1520-251-10
CRUISE
CRUISE
AH64D
PRESSURE ALTITUDE 10,000 FEET
T700GE701
101% NR RPM, 8 HELLFIRE CONFIGURATION, JP8 FUEL
FAT = 10°C
FAT = 0°C
INDICATED
TOTAL FUEL FLOW LB/HOUR
AIRSPEED
TOTAL FUEL FLOW LB/HOUR
KNOTS
600
800
1000
1200
600
800
1000
1200
170
∆Q %
∆Q %
∆ F = 10.0 SQ FT
∆ F = 10.0 SQ FT
0
10
20
0
10
20
160
180
150
180
170
140
170
160
130
160
150
150
120
140
140
110
130
MAX
MAX
130
RANGE
RANGE
100
120
120
90
110
110
100
80
100
MAX
90
90
70
R/C
MAX
OR
80
R/C
MAX
80
OR
60
END
MAX
70
END
70
50
60
60
40
50
50
40
30
40
30
30
20
20
20
10
0
30
40
50
60
70
80
90
100
30
40
50
60
70
80
90
100
INDICATED TORQUE PER ENGINE %
INDICATED TORQUE PER ENGINE %
DATA BASIS: DERIVED FROM FLIGHT TEST AND ENGINE MODEL SPEC NO. DARCOMCP22202701A, DATED 15 JANUARY 1987
LBA2488
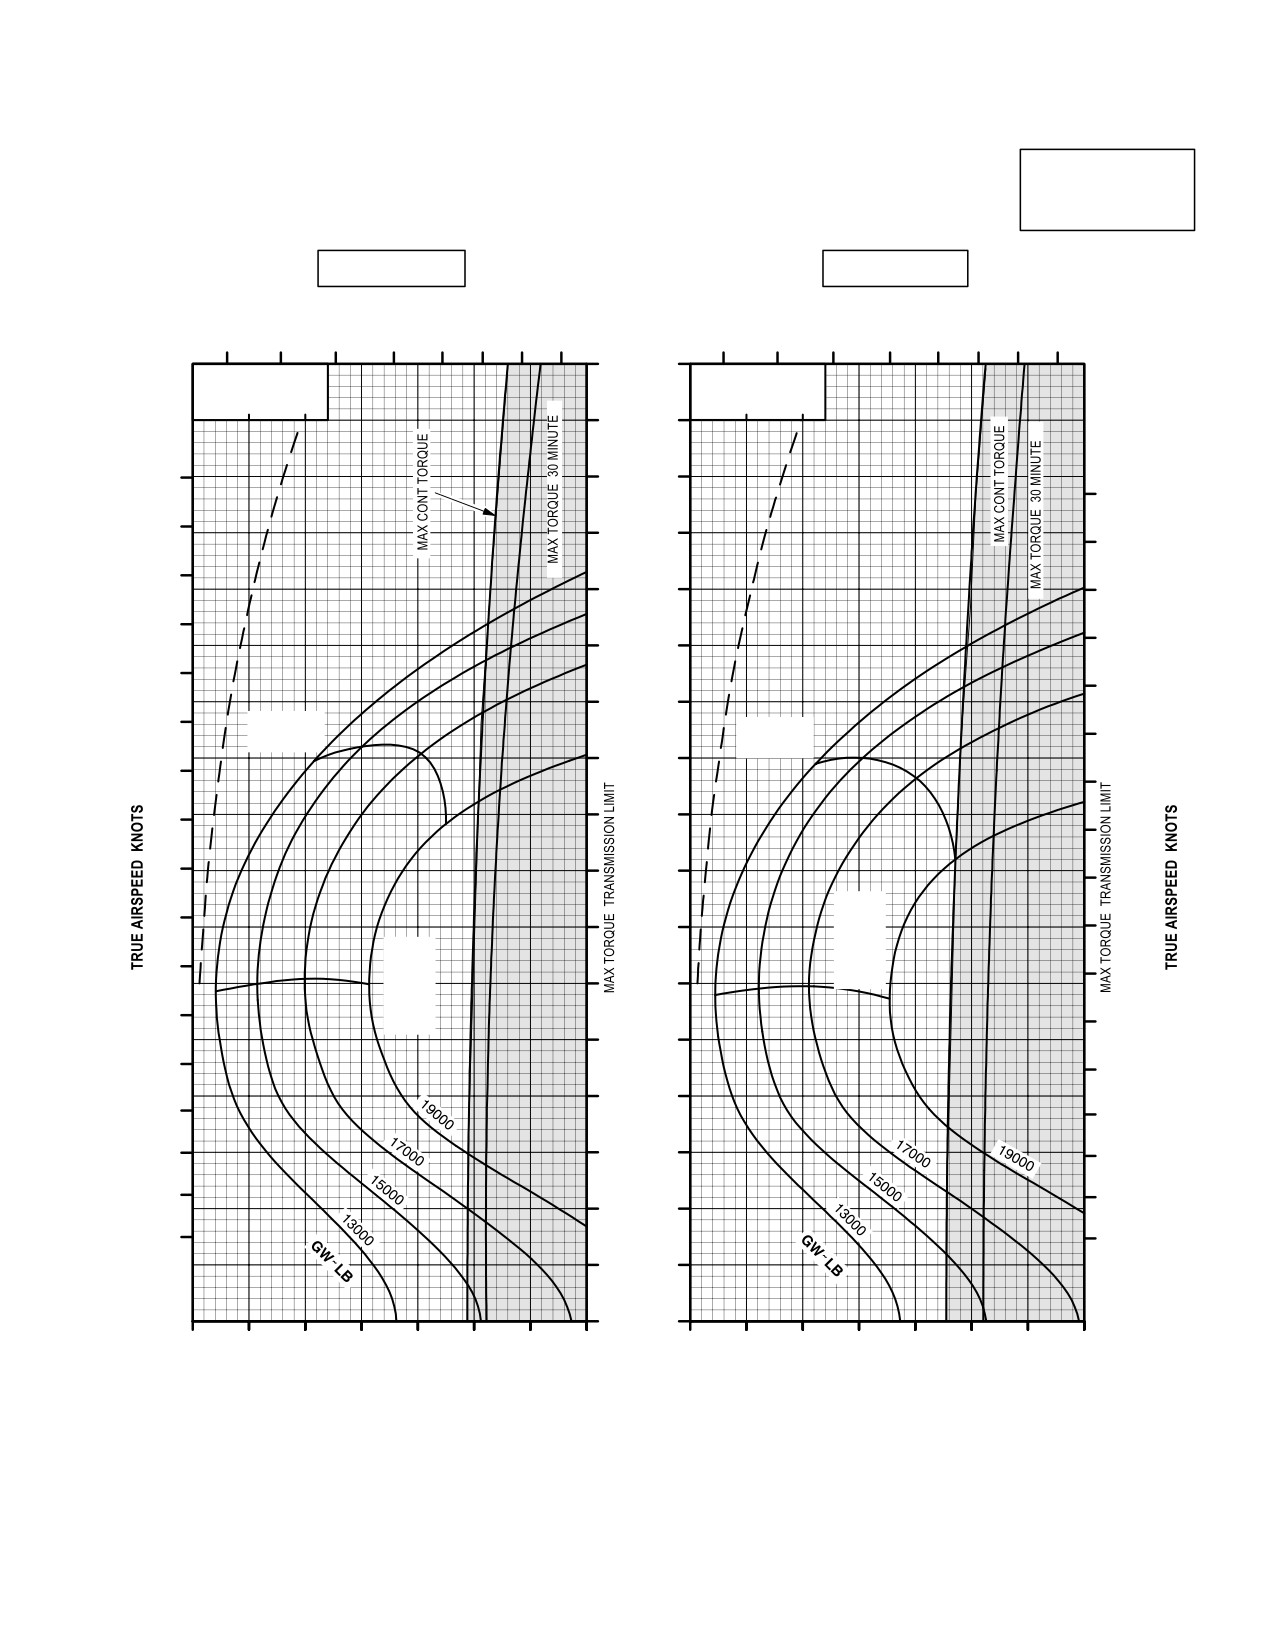
Figure 7-22. Cruise Chart, 10,000 Feet, - 10°C and 0°C (sheet 3 of 5)
Use or disclosure of this information is subject to the restriction(s) on the title page of this document.
7-53
TM 1-1520-251-10
CRUISE
CRUISE
AH64D
PRESSURE ALTITUDE 10,000 FEET
T700GE701
101% NR RPM, 8 HELLFIRE CONFIGURATION, JP8 FUEL
FAT = +10°C
FAT = +20°C
INDICATED
TOTAL FUEL FLOW LB/HOUR
TOTAL FUEL FLOW LB/HOUR
AIRSPEED
KNOTS
600
800
1000
1200
600
800
1000
1200
170
∆Q %
∆Q %
∆ F = 10.0 SQ FT
∆ F = 10.0 SQ FT
0
10
20
0
10
20
160
150
180
180
140
170
170
130
160
160
150
120
150
140
110
140
130
MAX
100
MAX
130
RANGE
RANGE
120
120
90
110
110
80
100
100
MAX
90
R/C
70
90
OR
MAX
MAX
80
R/C
END
60
80
OR
MAX
70
END
70
50
60
60
40
50
50
30
40
40
30
30
20
20
20
10
0
30
40
50
60
70
80
90
100
30
40
50
60
70
80
90
100
INDICATED TORQUE PER ENGINE %
INDICATED TORQUE PER ENGINE %
DATA BASIS: DERIVED FROM FLIGHT TEST AND ENGINE MODEL SPEC NO. DARCOMCP22202701A, DATED 15 JANUARY 1987
LBA2489
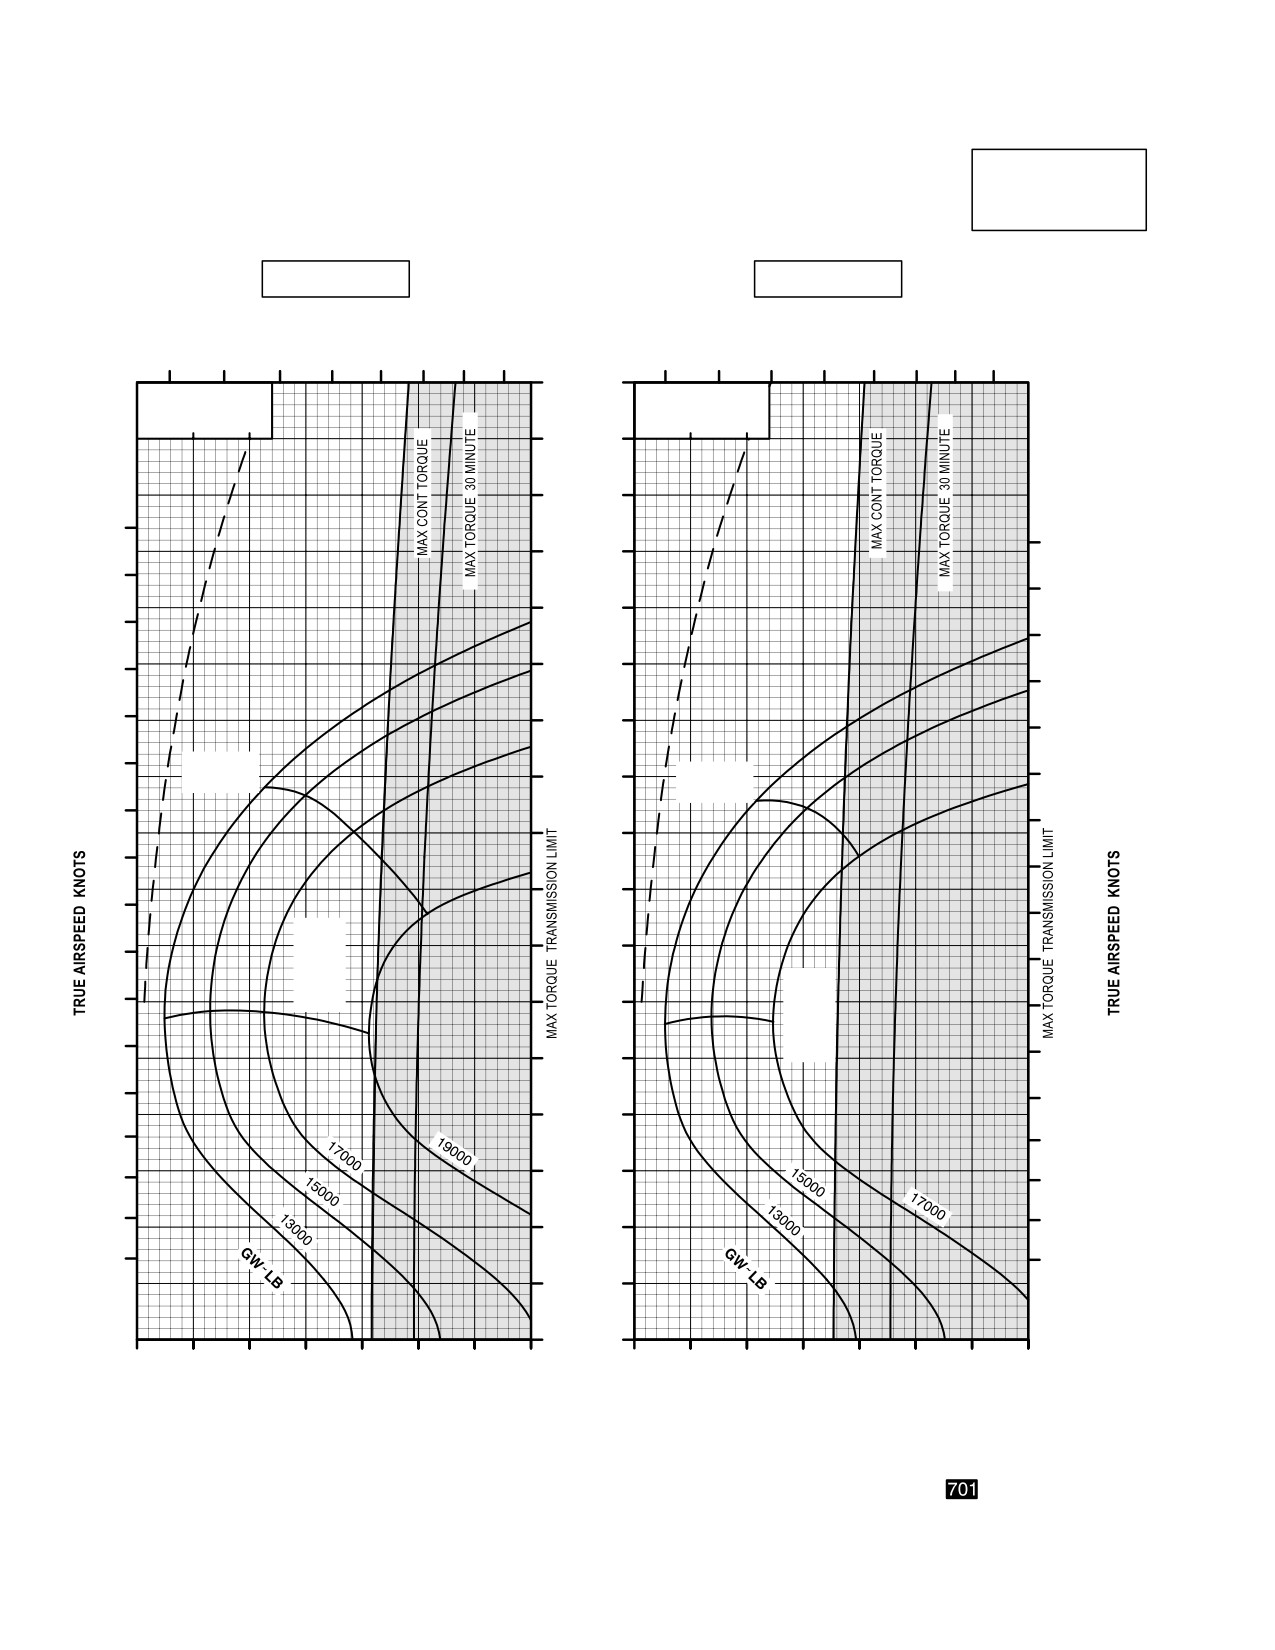
Figure 7-22. Cruise Chart, 10,000 Feet, +10°C and +20°C (sheet 4 of 5)
Use or disclosure of this information is subject to the restriction(s) on the title page of this document.
7-54
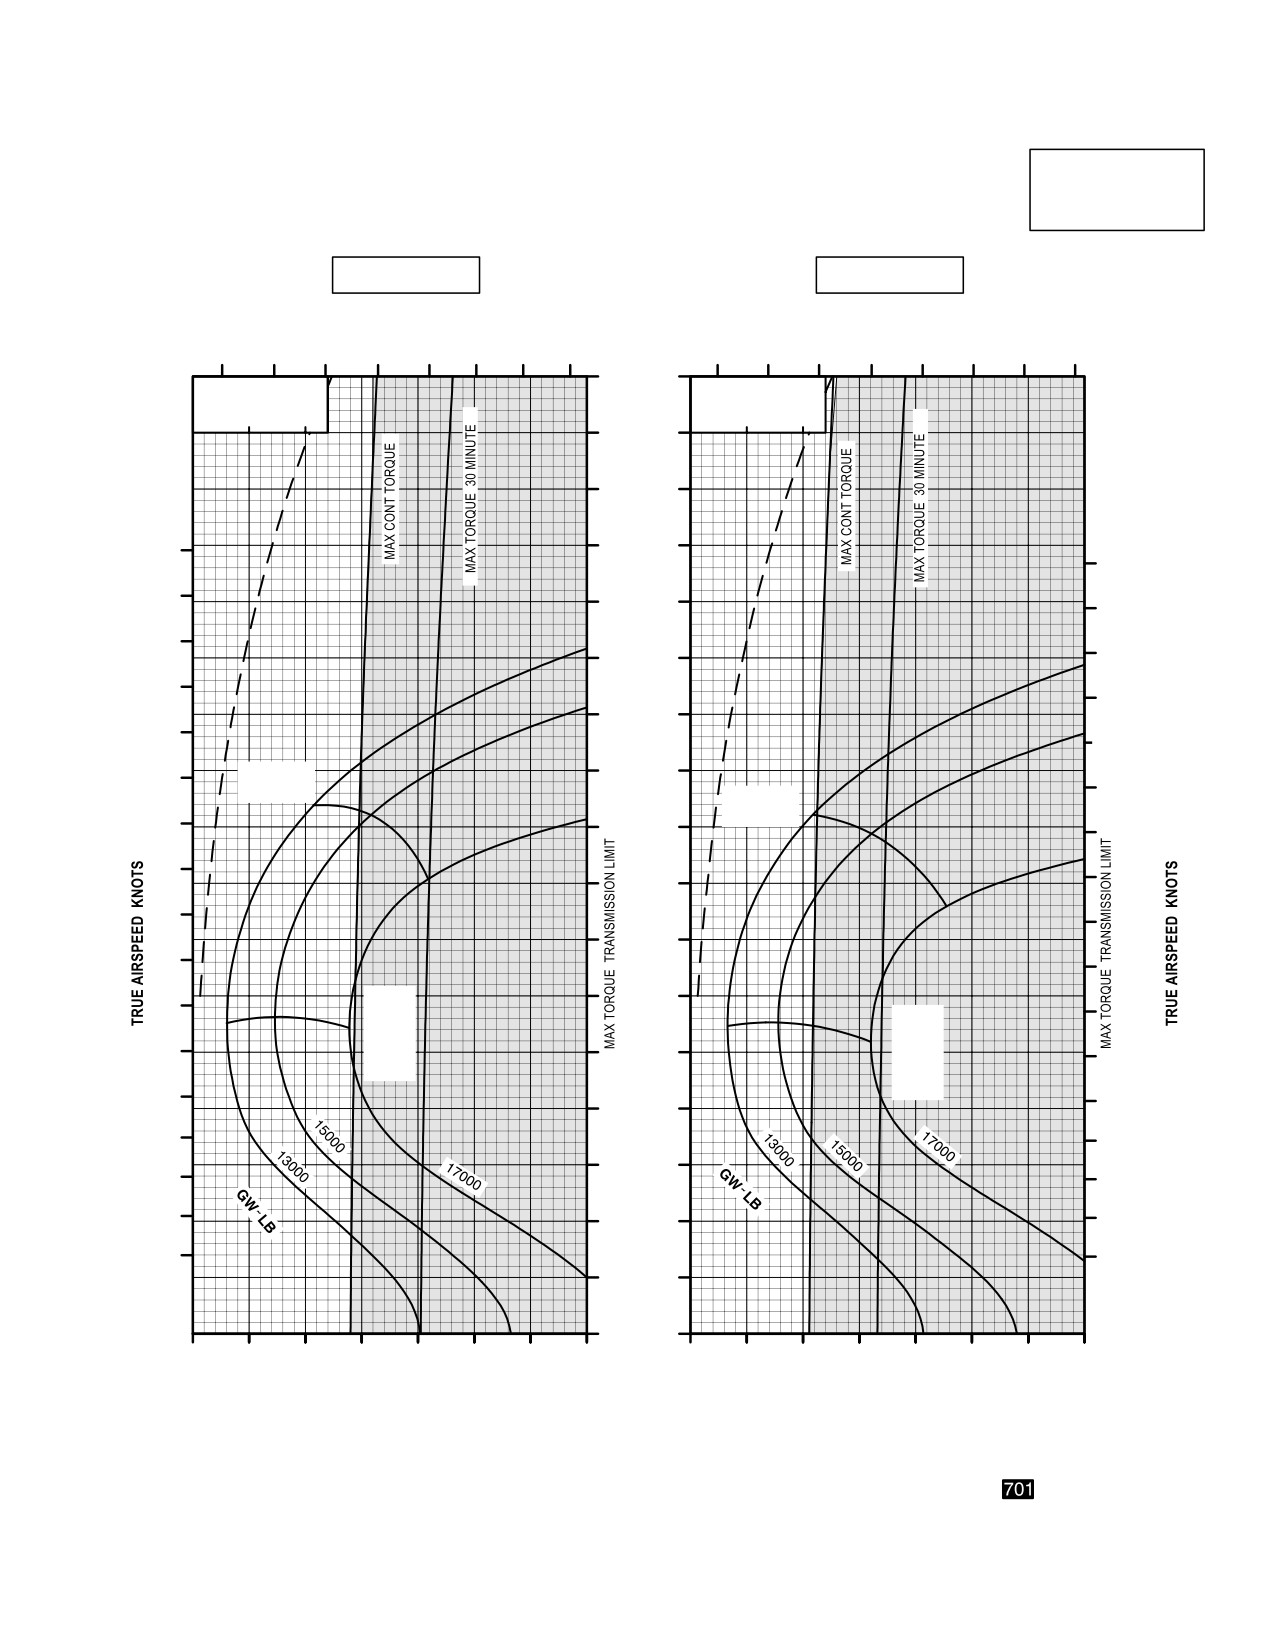
TM 1-1520-251-10
CRUISE
CRUISE
AH64D
PRESSURE ALTITUDE 10,000 FEET
T700GE701
101% NR RPM, 8 HELLFIRE CONFIGURATION, JP8 FUEL
FAT = +30°C
FAT = +40°C
INDICATED
TOTAL FUEL FLOW LB/HOUR
TOTAL FUEL FLOW LB/HOUR
AIRSPEED
KNOTS
600
800
1000
1200
600
800
1000
1200
170
∆Q %
∆Q %
∆ F = 10.0 SQ FT
∆ F = 10.0 SQ FT
0
10
20
0
10
20
160
150
180
140
180
170
130
170
160
160
120
150
150
110
140
140
MAX
100
130
RANGE
130
MAX
RANGE
120
90
120
110
110
80
100
100
70
90
90
MAX
60
80
80
R/C
MAX
OR
R/C
70
MAX
50
OR
70
END
MAX
60
END
60
40
50
50
30
40
40
30
30
20
20
20
10
0
30
40
50
60
70
80
90
100
30
40
50
60
70
80
90
100
INDICATED TORQUE PER ENGINE %
INDICATED TORQUE PER ENGINE %
DATA BASIS: DERIVED FROM FLIGHT TEST AND ENGINE MODEL SPEC NO. DARCOMCP22202701A, DATED 15 JANUARY 1987
LBA2490
Figure 7-22. Cruise Chart, 10,000 Feet, +30°C and +40°C (sheet 5 of 5)
Use or disclosure of this information is subject to the restriction(s) on the title page of this document.
7-55
TM 1-1520-251-10
CRUISE
CRUISE
AH64D
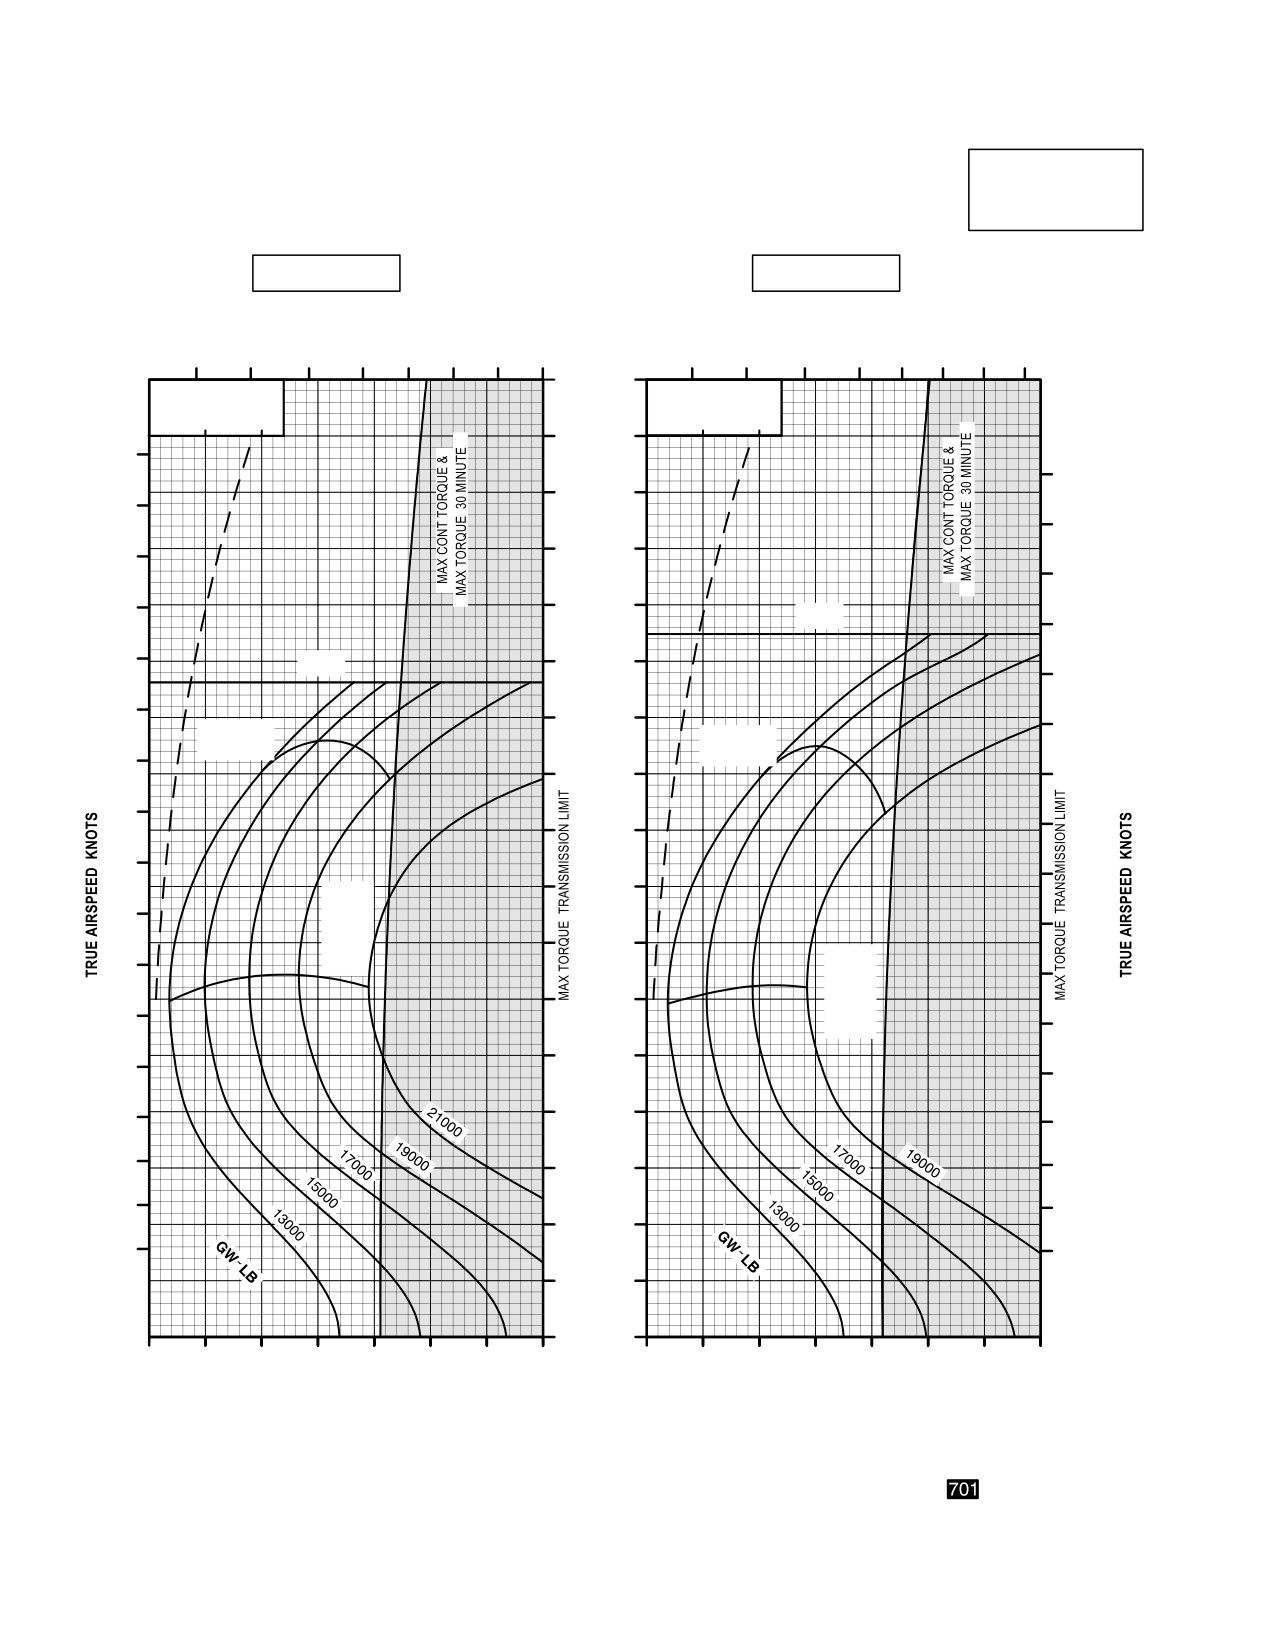
PRESSURE ALTITUDE 12,000 FEET
T700GE701
101% NR RPM, 8 HELLFIRE CONFIGURATION, JP8 FUEL
FAT = 50° C
FAT = 40° C
TOTAL FUEL FLOW LB/HOUR
INDICATED
TOTAL FUEL FLOW LB/HOUR
AIRSPEED
KNOTS
600
800
1000
1200
600
800
1000
1200
170
∆Q %
∆Q %
∆ F = 10.0 SQ FT
∆ F = 10.0 SQ FT
0
10
20
0
10
20
160
180
180
150
170
170
160
140
160
150
130
V
NE
150
140
120
V NE
140
130
110
130
MAX
MAX
RANGE
120
RANGE
100
120
110
110
90
100
100
80
MAX
90
R/C
90
OR
70
MAX
MAX
80
END
R/C
80
OR
60
70
MAX
70
END
50
60
60
50
40
50
40
30
40
30
30
20
20
20
10
0
30
40
50
60
70
80
90
100
30
40
50
60
70
80
90
100
INDICATED TORQUE PER ENGINE %
INDICATED TORQUE PER ENGINE %
DATA BASIS: DERIVED FROM FLIGHT TEST AND ENGINE MODEL SPEC NO. DARCOMCP22202701A, DATED 15 JANUARY 1987
LBA2491
Figure 7-23. Cruise Chart, 12,000 Feet, - 50°C and - 40°C (sheet 1 of 5)
Use or disclosure of this information is subject to the restriction(s) on the title page of this document.
7-56
TM 1-1520-251-10
CRUISE
CRUISE
AH64D
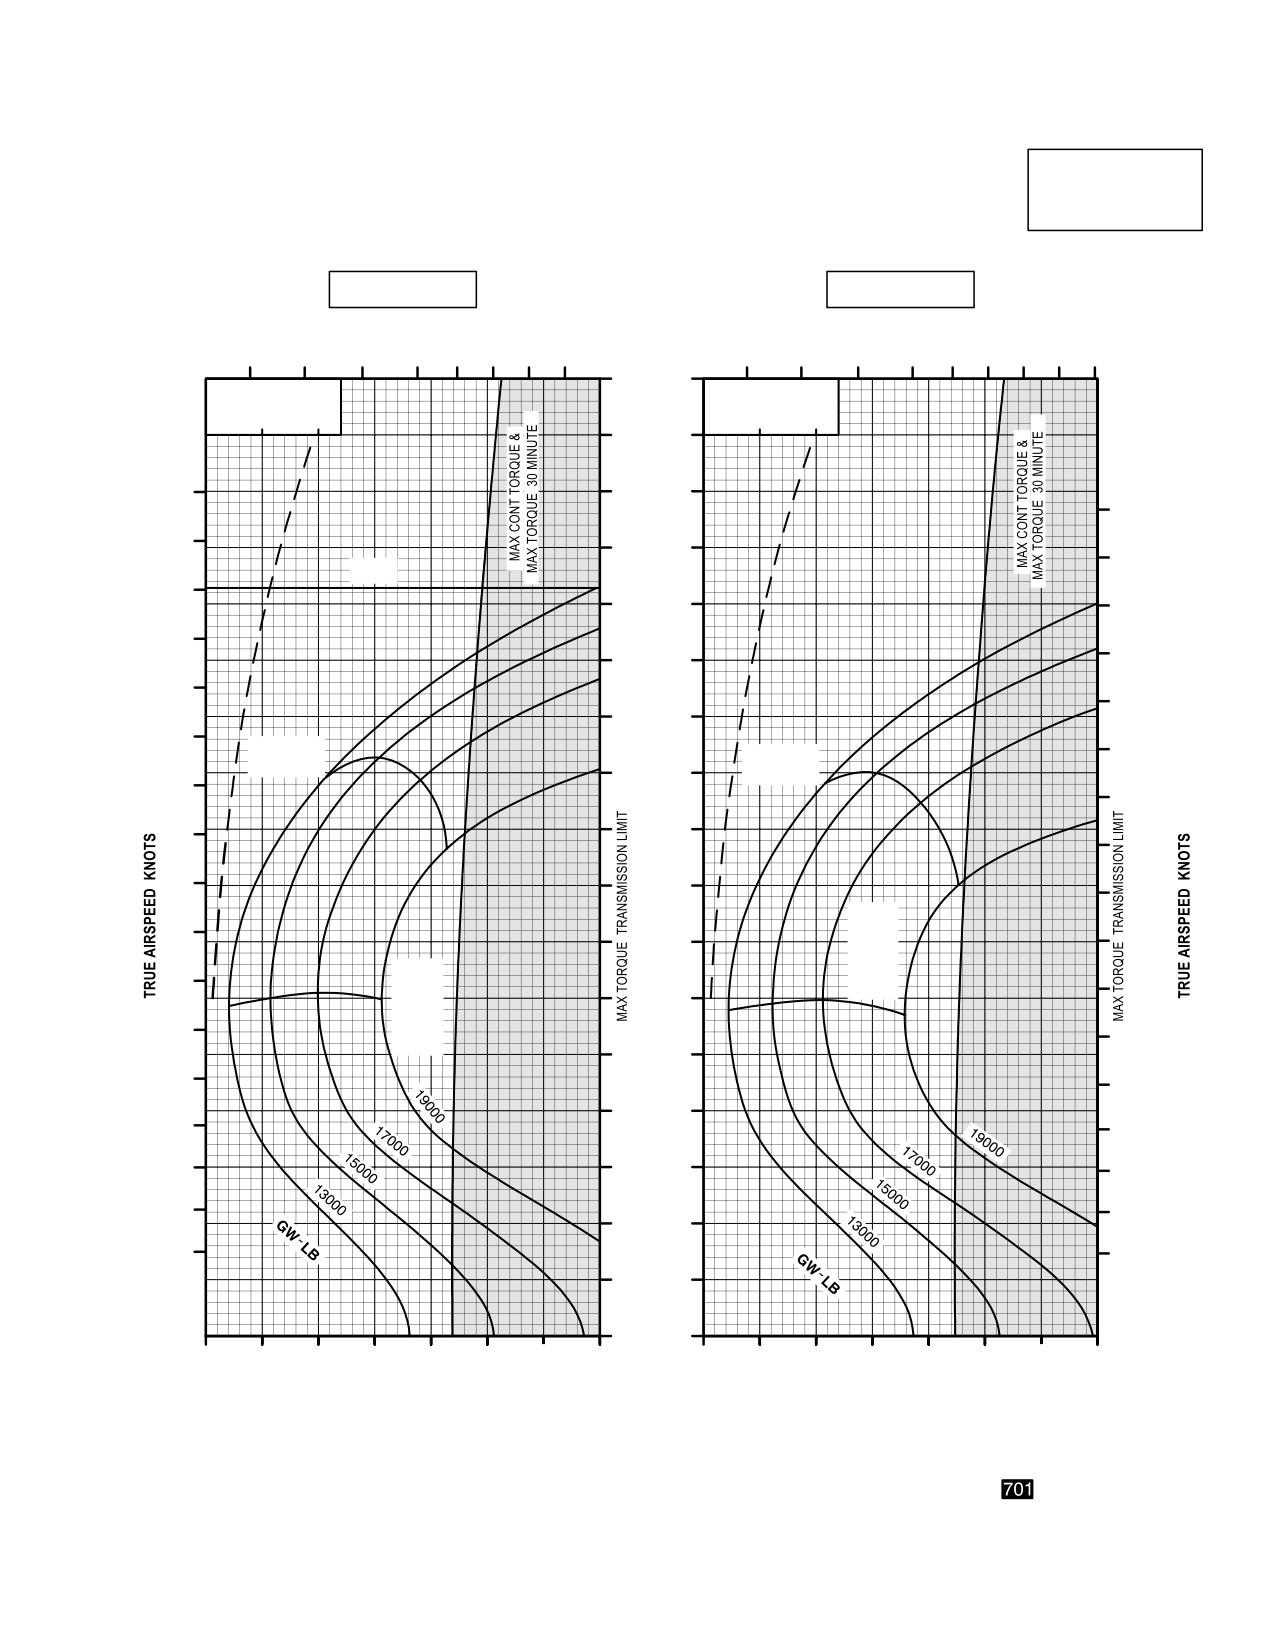
PRESSURE ALTITUDE 12,000 FEET
T700GE701
101% NR RPM, 8 HELLFIRE CONFIGURATION, JP8 FUEL
FAT = 30° C
FAT = 20° C
INDICATED
TOTAL FUEL FLOW LB/HOUR
AIRSPEED
TOTAL FUEL FLOW LB/HOUR
600
800
1000
1200
KNOTS
600
800
1000
1200
1400
170
∆Q %
∆Q %
∆ F = 10.0 SQ FT
∆ F = 10.0 SQ FT
0
10
20
0
10
20
160
180
150
180
170
140
170
V NE
160
130
160
150
150
120
140
140
110
130
MAX
130
MAX
RANGE
100
RANGE
120
120
90
110
110
100
80
100
MAX
90
R/C
70
90
OR
MAX
MAX
80
R/C
END
80
60
OR
70
MAX
70
END
50
60
60
40
50
50
40
30
40
30
30
20
20
20
10
0
30
40
50
60
70
80
90
100
30
40
50
60
70
80
90
100
INDICATED TORQUE PER ENGINE %
INDICATED TORQUE PER ENGINE %
DATA BASIS: DERIVED FROM FLIGHT TEST AND ENGINE MODEL SPEC NO. DARCOMCP22202701A, DATED 15 JANUARY 1987
LBA2492
Figure 7-23. Cruise Chart, 12,000 Feet, - 30°C and - 20°C (sheet 2 of 5)
Use or disclosure of this information is subject to the restriction(s) on the title page of this document.
7-57
TM 1-1520-251-10
CRUISE
CRUISE
AH64D
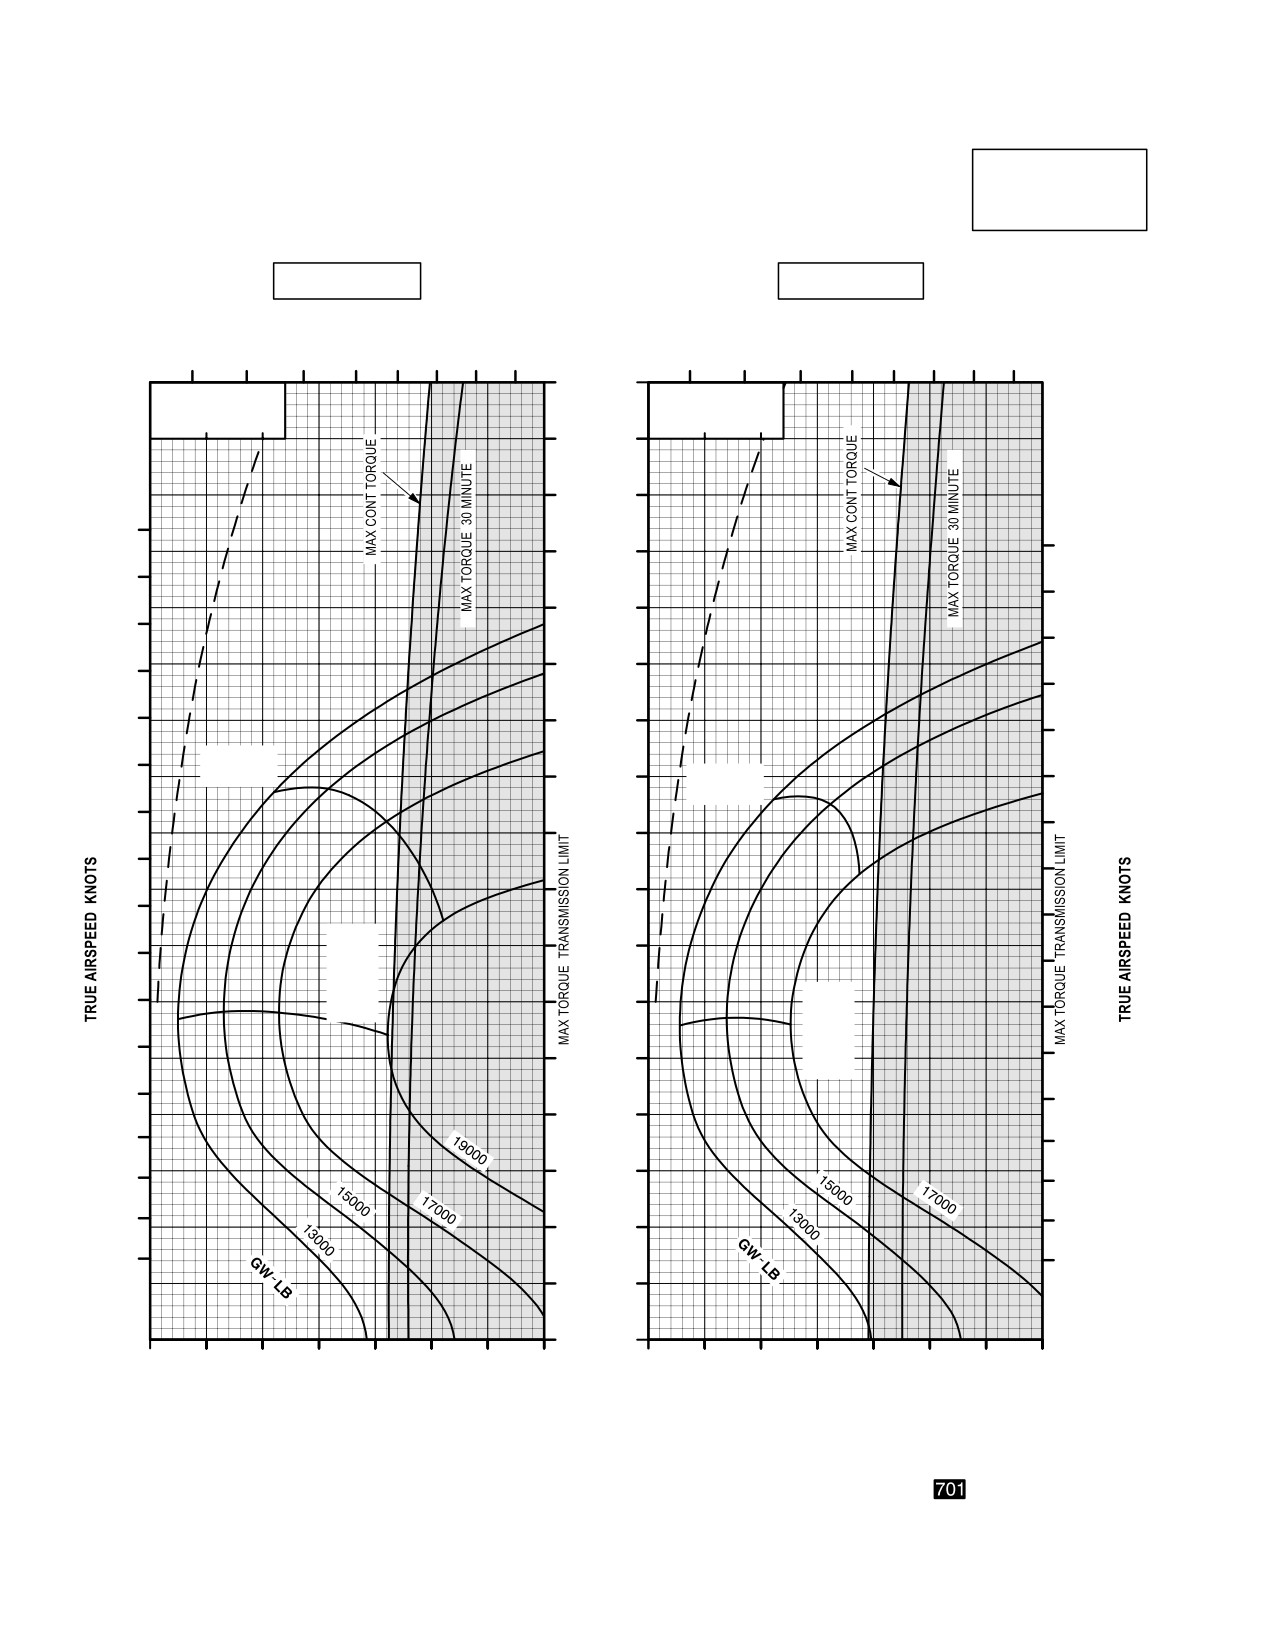
PRESSURE ALTITUDE 12,000 FEET
T700GE701
101% NR RPM, 8 HELLFIRE CONFIGURATION, JP8 FUEL
FAT = 10° C
FAT = 0° C
TOTAL FUEL FLOW LB/HOUR
INDICATED
TOTAL FUEL FLOW LB/HOUR
AIRSPEED
KNOTS
600
800
1000
1200
600
800
1000
1200
170
∆Q %
∆Q %
∆ F = 10.0 SQ FT
∆ F = 10.0 SQ FT
0
10
20
0
10
20
160
150
180
180
140
170
170
130
160
160
150
120
150
140
110
140
MAX
130
RANGE
100
MAX
130
RANGE
120
120
90
110
110
80
100
100
MAX
90
70
R/C
90
OR
80
MAX
MAX
60
80
END
R/C
OR
70
MAX
70
50
END
60
60
40
50
50
40
30
40
30
30
20
20
20
10
0
30
40
50
60
70
80
90
100
30
40
50
60
70
80
90
100
INDICATED TORQUE PER ENGINE %
INDICATED TORQUE PER ENGINE %
DATA BASIS: DERIVED FROM FLIGHT TEST AND ENGINE MODEL SPEC NO. DARCOMCP22202701A, DATED 15 JANUARY 1987
LBA2493
Figure 7-23. Cruise Chart, 12,000 Feet, - 10°C and 0°C (sheet 3 of 5)
Use or disclosure of this information is subject to the restriction(s) on the title page of this document.
7-58
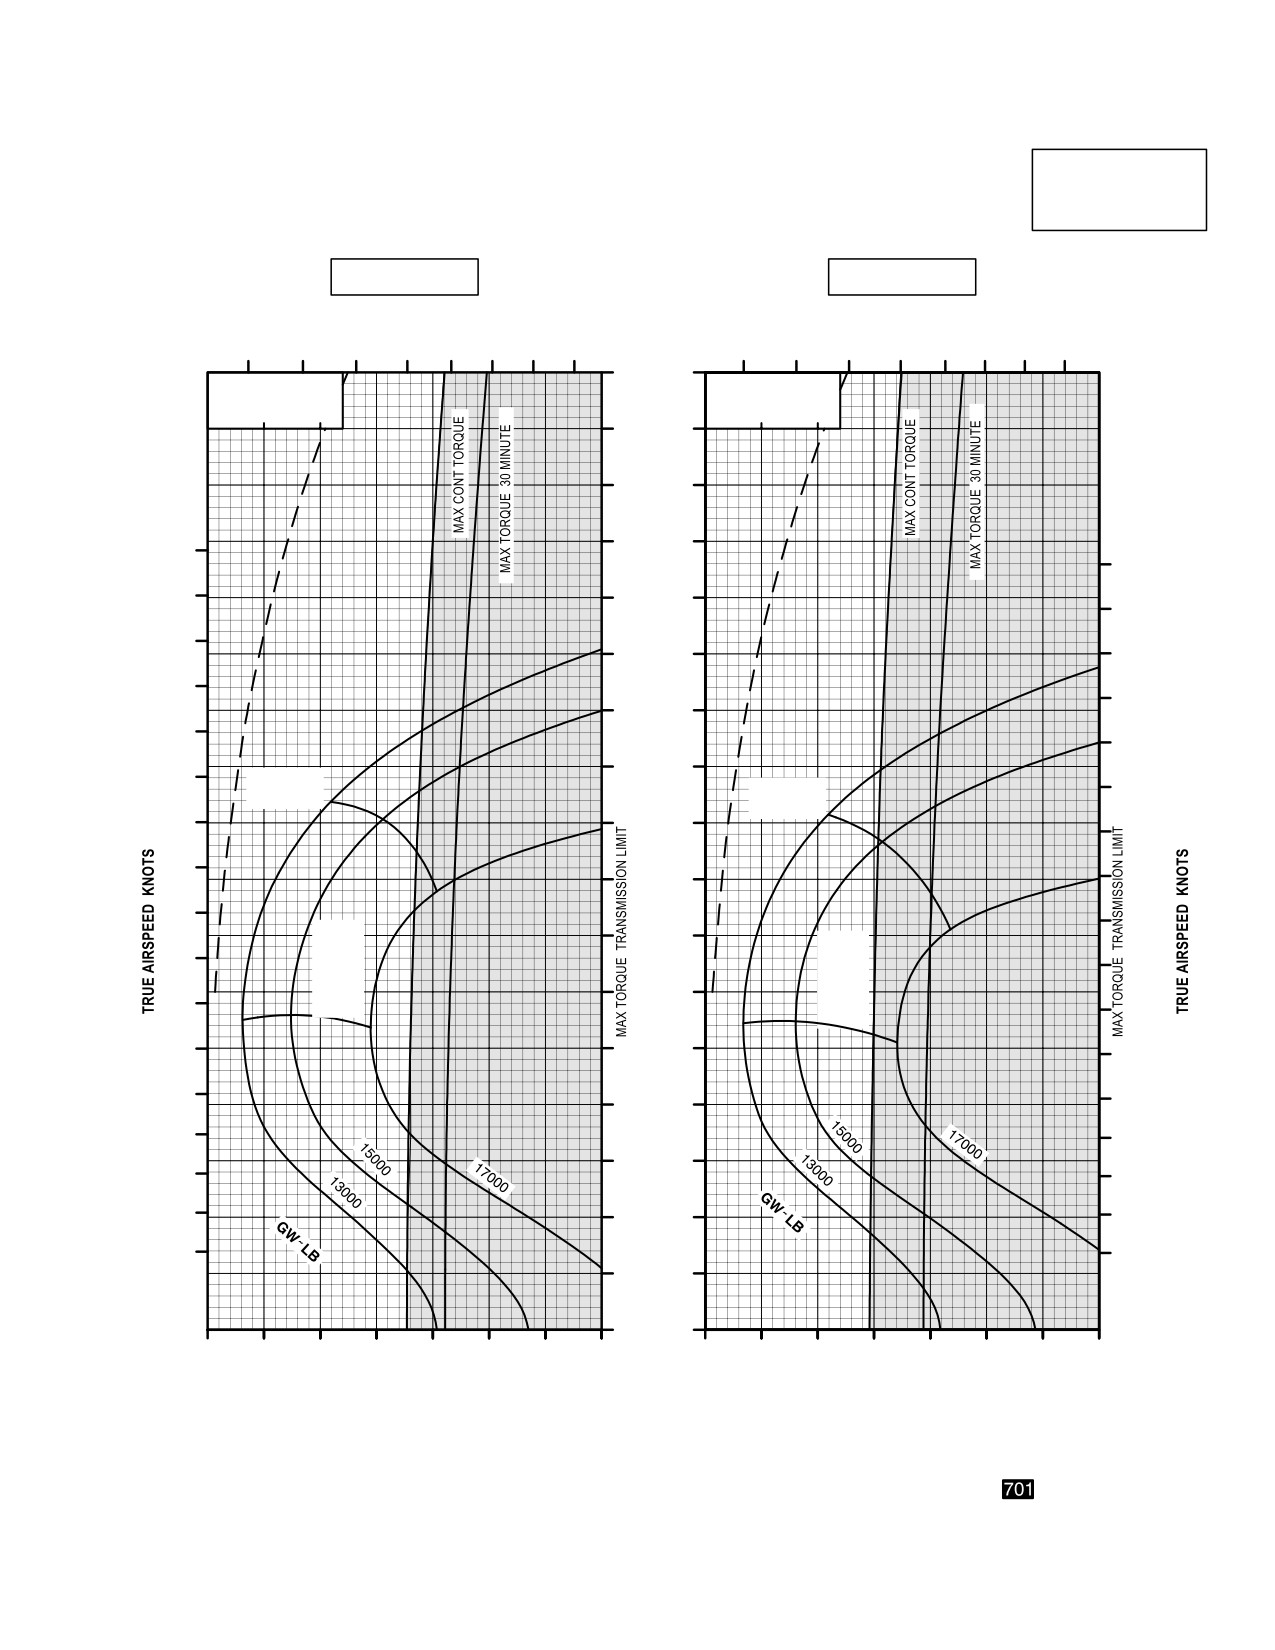
TM 1-1520-251-10
CRUISE
CRUISE
AH64D
PRESSURE ALTITUDE 12,000 FEET
T700GE701
101% NR RPM, 8 HELLFIRE CONFIGURATION, JP8 FUEL
FAT = +10° C
FAT = +20° C
INDICATED
TOTAL FUEL FLOW LB/HOUR
TOTAL FUEL FLOW LB/HOUR
AIRSPEED
600
800
1000
1200
KNOTS
600
800
1000
1200
170
∆Q %
∆Q %
∆ F = 10.0 SQ FT
∆ F = 10.0 SQ FT
0
10
20
0
10
20
160
150
140
180
180
170
130
170
160
120
160
150
150
110
140
140
100
130
MAX
MAX
130
RANGE
RANGE
120
90
120
110
80
110
100
100
MAX
70
MAX
90
R/C
R/C
90
OR
OR
MAX
60
80
MAX
END
80
END
70
50
70
60
60
40
50
50
30
40
40
30
20
30
20
20
10
0
30
40
50
60
70
80
90
100
30
40
50
60
70
80
90
100
INDICATED TORQUE PER ENGINE %
INDICATED TORQUE PER ENGINE %
DATA BASIS: DERIVED FROM FLIGHT TEST AND ENGINE MODEL SPEC NO. DARCOMCP22202701A, DATED 15 JANUARY 1987
LBA2494
Figure 7-23. Cruise Chart, 12,000 Feet, +10°C and +20°C (sheet 4 of 5)
Use or disclosure of this information is subject to the restriction(s) on the title page of this document.
7-59
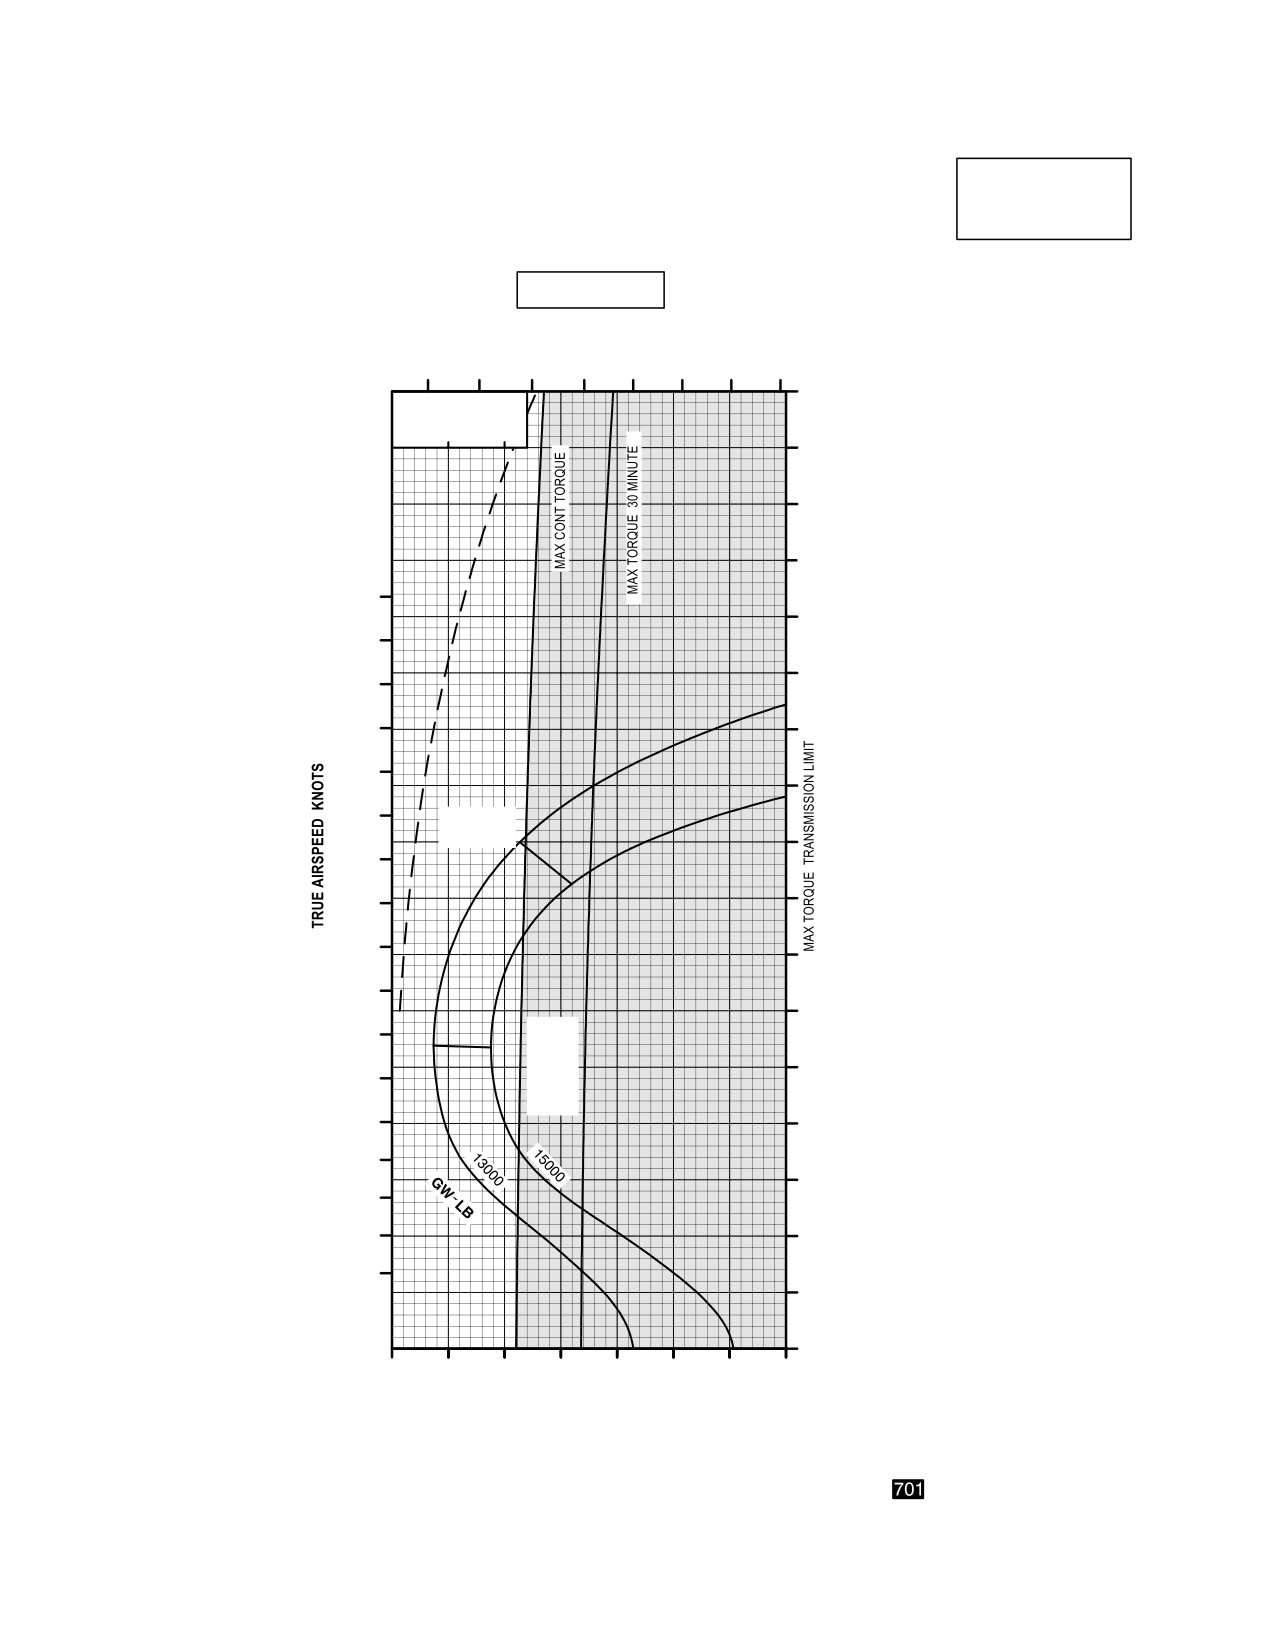
TM 1-1520-251-10
CRUISE
CRUISE
AH64D
PRESSURE ALTITUDE 12,000 FEET
T700GE701
101% NR RPM, 8 HELLFIRE CONFIGURATION, JP8 FUEL
FAT = +30 °C
TOTAL FUEL FLOW LB/HOUR
INDICATED
AIRSPEED
600
800
1000
1200
KNOTS
170
∆Q %
∆ F = 10.0 SQ FT
0
10
20
160
150
140
180
130
170
120
160
150
110
140
100
130
MAX
RANGE
90
120
110
80
100
70
90
60
80
MAX
R/C
OR
50
70
MAX
END
60
40
50
30
40
30
20
20
10
0
30
40
50
60
70
80
90
100
INDICATED TORQUE PER ENGINE %
DATA BASIS: DERIVED FROM FLIGHT TEST AND ENGINE MODEL SPEC NO. DARCOMCP22202701A, DATED 15 JANUARY 1987
LBA2495
Figure 7-23. Cruise Chart, 12,000 Feet, +30°C (sheet 5 of 5)
Use or disclosure of this information is subject to the restriction(s) on the title page of this document.
7-60
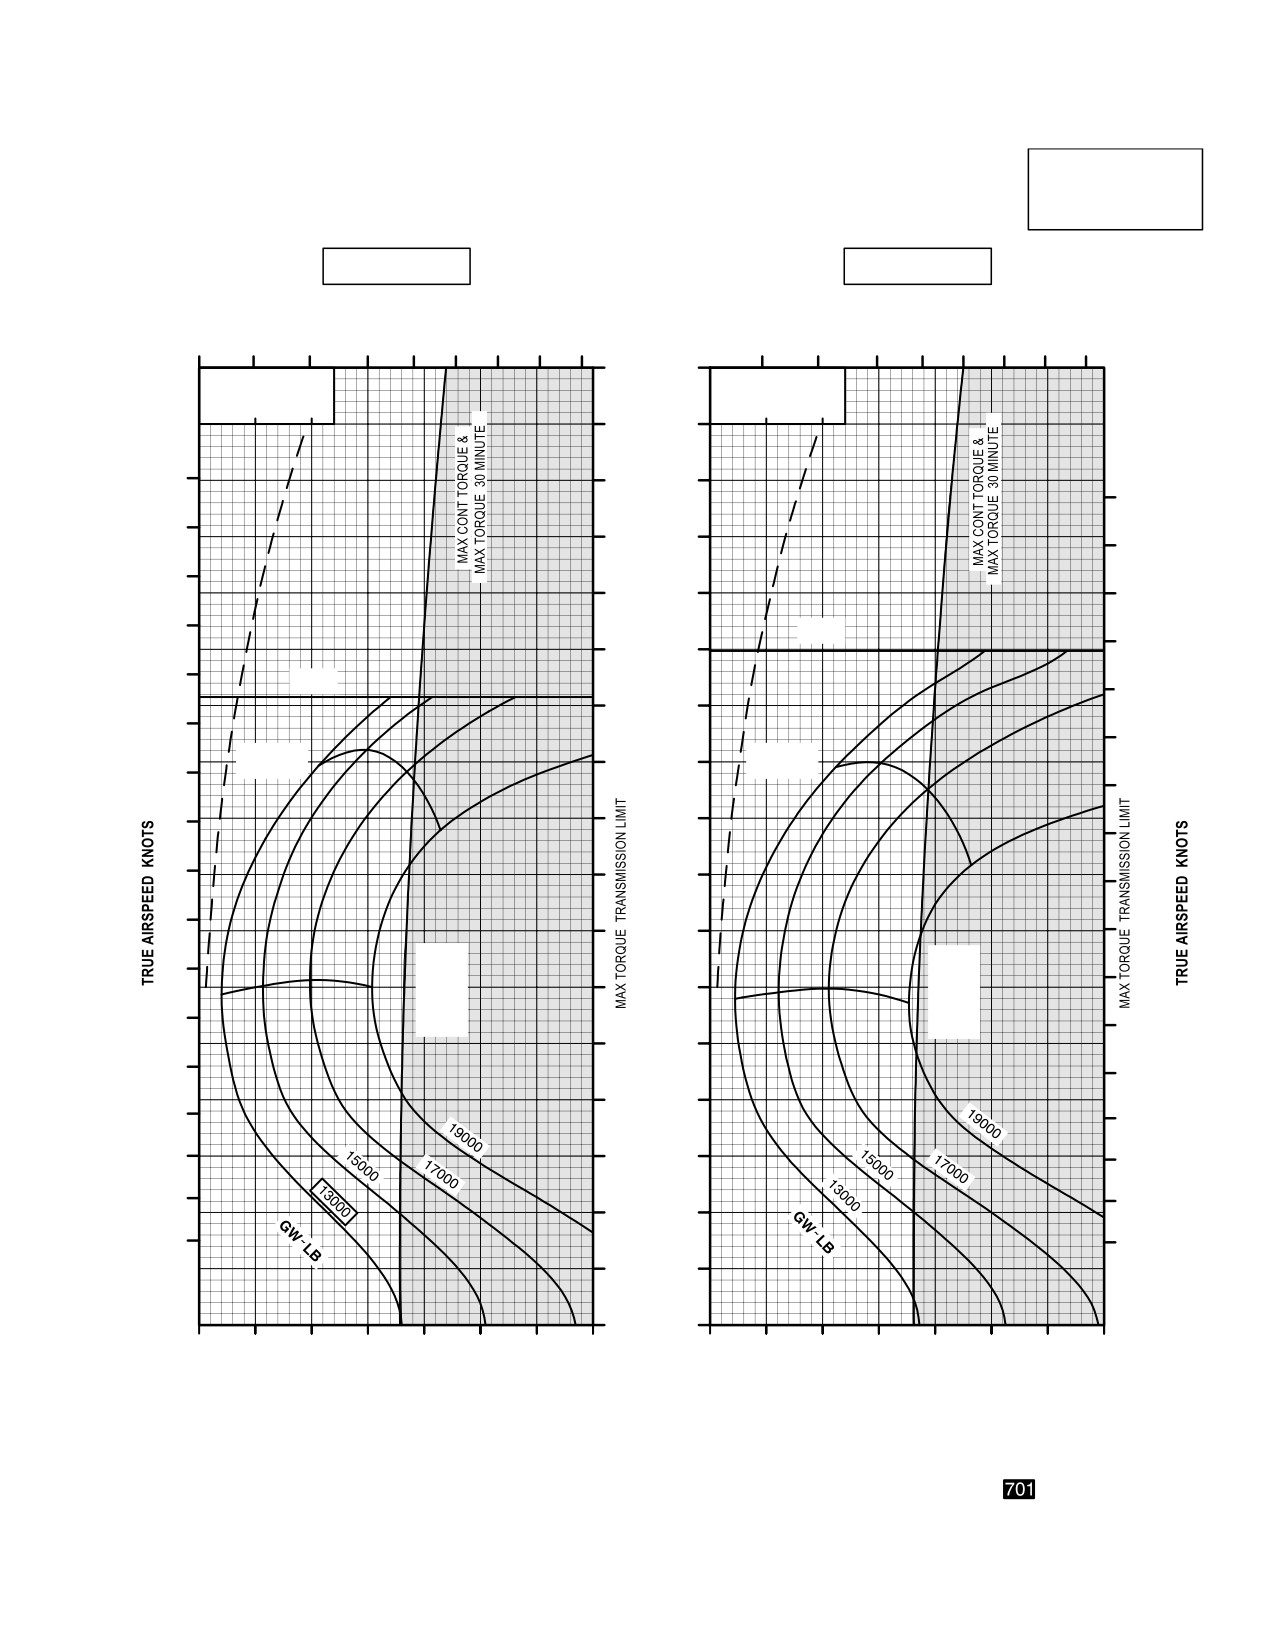
TM 1-1520-251-10
CRUISE
CRUISE
AH64D
PRESSURE ALTITUDE 14,000 FEET
T700GE701
101% NR RPM, 8 HELLFIRE CONFIGURATION, JP8 FUEL
FAT = 50°C
FAT = 40°C
TOTAL FUEL FLOW LB/HOUR
INDICATED
TOTAL FUEL FLOW LB/HOUR
AIRSPEED
KNOTS
500
700
900
1100
1300
600
800
1000
1200
170
∆Q %
∆Q %
∆ F = 10.0 SQ FT
∆ F = 10.0 SQ FT
0
10
20
0
10
20
160
180
150
180
170
140
170
160
130
160
150
V
NE
150
120
140
V
NE
140
110
130
130
MAX
MAX
100
120
RANGE
RANGE
120
110
90
110
100
80
100
90
70
90
MAX
MAX
80
R/C
R/C
80
60
OR
OR
70
MAX
MAX
70
END
END
50
60
60
40
50
50
40
30
40
30
30
20
20
20
10
0
30
40
50
60
70
80
90
100
30
40
50
60
70
80
90
100
INDICATED TORQUE PER ENGINE %
INDICATED TORQUE PER ENGINE %
DATA BASIS: DERIVED FROM FLIGHT TEST AND ENGINE MODEL SPEC NO. DARCOMCP22202701A, DATED 15 JANUARY 1987
LBA2496
Figure 7-24. Cruise Chart, 14,000 Feet, - 50°C and - 40°C (sheet 1 of 5)
Use or disclosure of this information is subject to the restriction(s) on the title page of this document.
7-61
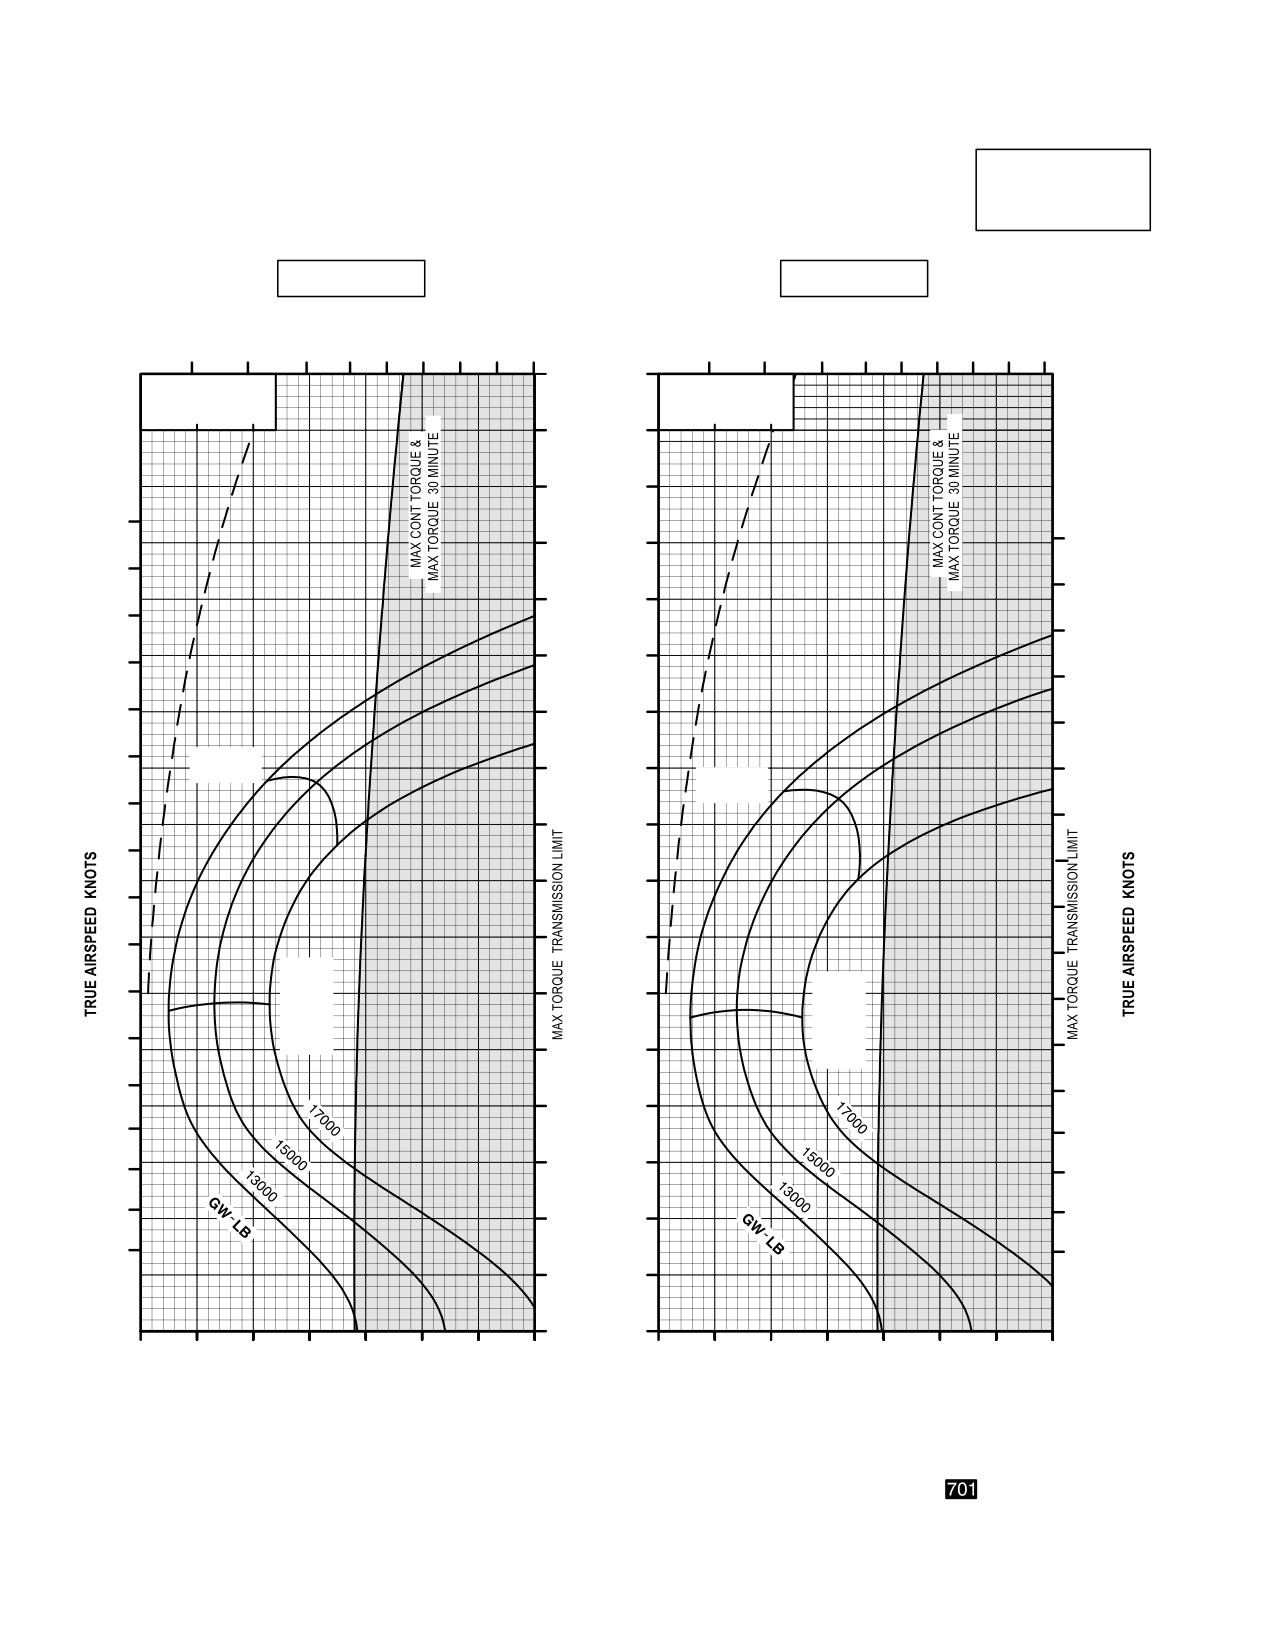
TM 1-1520-251-10
CRUISE
CRUISE
AH64D
PRESSURE ALTITUDE 14,000 FEET
T700GE701
101% NR RPM, 8 HELLFIRE CONFIGURATION, JP8 FUEL
FAT = 30°C
FAT = 20°C
INDICATED
TOTAL FUEL FLOW LB/HOUR
TOTAL FUEL FLOW LB/HOUR
AIRSPEED
KNOTS
600
800
1000
1200
1400
600
800
1000
1200
1400
170
∆Q %
∆Q %
∆ F = 10.0 SQ FT
∆ F = 10.0 SQ FT
0
10
20
0
10
20
160
150
180
180
140
170
170
130
160
160
120
150
150
140
110
140
130
MAX
100
130
RANGE
MAX
RANGE
120
120
90
110
110
80
100
100
90
70
90
MAX
MAX
80
R/C
80
60
R/C
OR
OR
MAX
70
MAX
70
END
50
END
60
60
40
50
50
40
30
40
30
30
20
20
20
10
0
30
40
50
60
70
80
90
100
30
40
50
60
70
80
90
100
INDICATED TORQUE PER ENGINE %
INDICATED TORQUE PER ENGINE %
DATA BASIS: DERIVED FROM FLIGHT TEST AND ENGINE MODEL SPEC NO. DARCOMCP22202701A, DATED 15 JANUARY 1987
LBA2497
Figure 7-24. Cruise Chart, 14,000 Feet, - 30°C and - 20°C (sheet 2 of 5)
Use or disclosure of this information is subject to the restriction(s) on the title page of this document.
7-62
TM 1-1520-251-10
CRUISE
CRUISE
AH64D
PRESSURE ALTITUDE 14,000 FEET
T700GE701
101% NR RPM, 8 HELLFIRE CONFIGURATION, JP8 FUEL
FAT = 10°C
FAT = 0°C
INDICATED
TOTAL FUEL FLOW LB/HOUR
TOTAL FUEL FLOW LB/HOUR
AIRSPEED
KNOTS
600
800
1000
1200
600
800
1000
1200
170
∆Q %
∆Q %
∆ F = 10.0 SQ FT
∆ F = 10.0 SQ FT
0
10
20
0
10
20
160
150
140
180
180
170
130
170
160
120
160
150
150
110
140
140
100
130
MAX
MAX
130
RANGE
RANGE
120
90
120
110
80
110
100
100
MAX
70
MAX
90
R/C
R/C
90
OR
OR
MAX
60
80
MAX
END
80
END
70
50
70
60
60
40
50
50
30
40
40
30
20
30
20
20
10
0
30
40
50
60
70
80
90
100
30
40
50
60
70
80
90
100
INDICATED TORQUE PER ENGINE %
INDICATED TORQUE PER ENGINE %
DATA BASIS: DERIVED FROM FLIGHT TEST AND ENGINE MODEL SPEC NO. DARCOMCP22202701A, DATED 15 JANUARY 1987
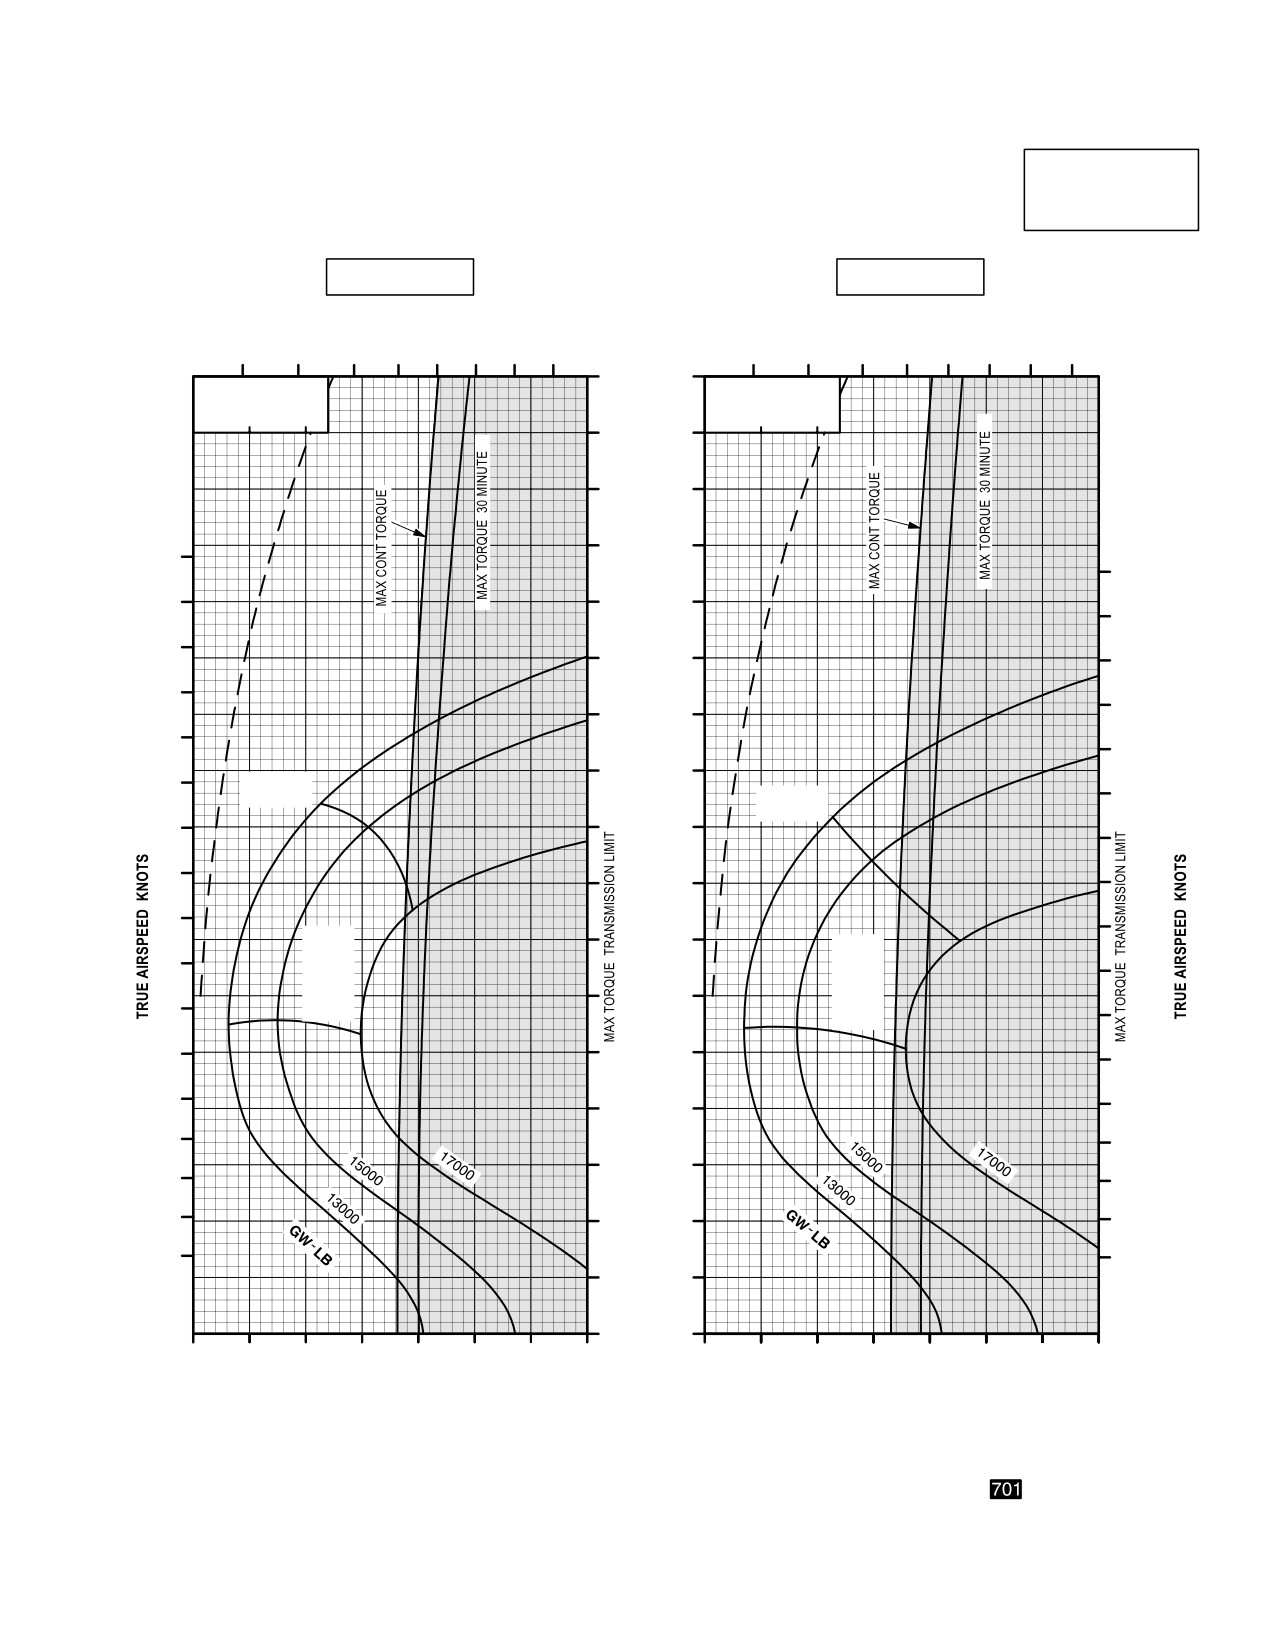
LBA5276
Figure 7-24. Cruise Chart, 14,000 Feet, - 10°C and 0°C (sheet 3 of 5)
Use or disclosure of this information is subject to the restriction(s) on the title page of this document.
7-63
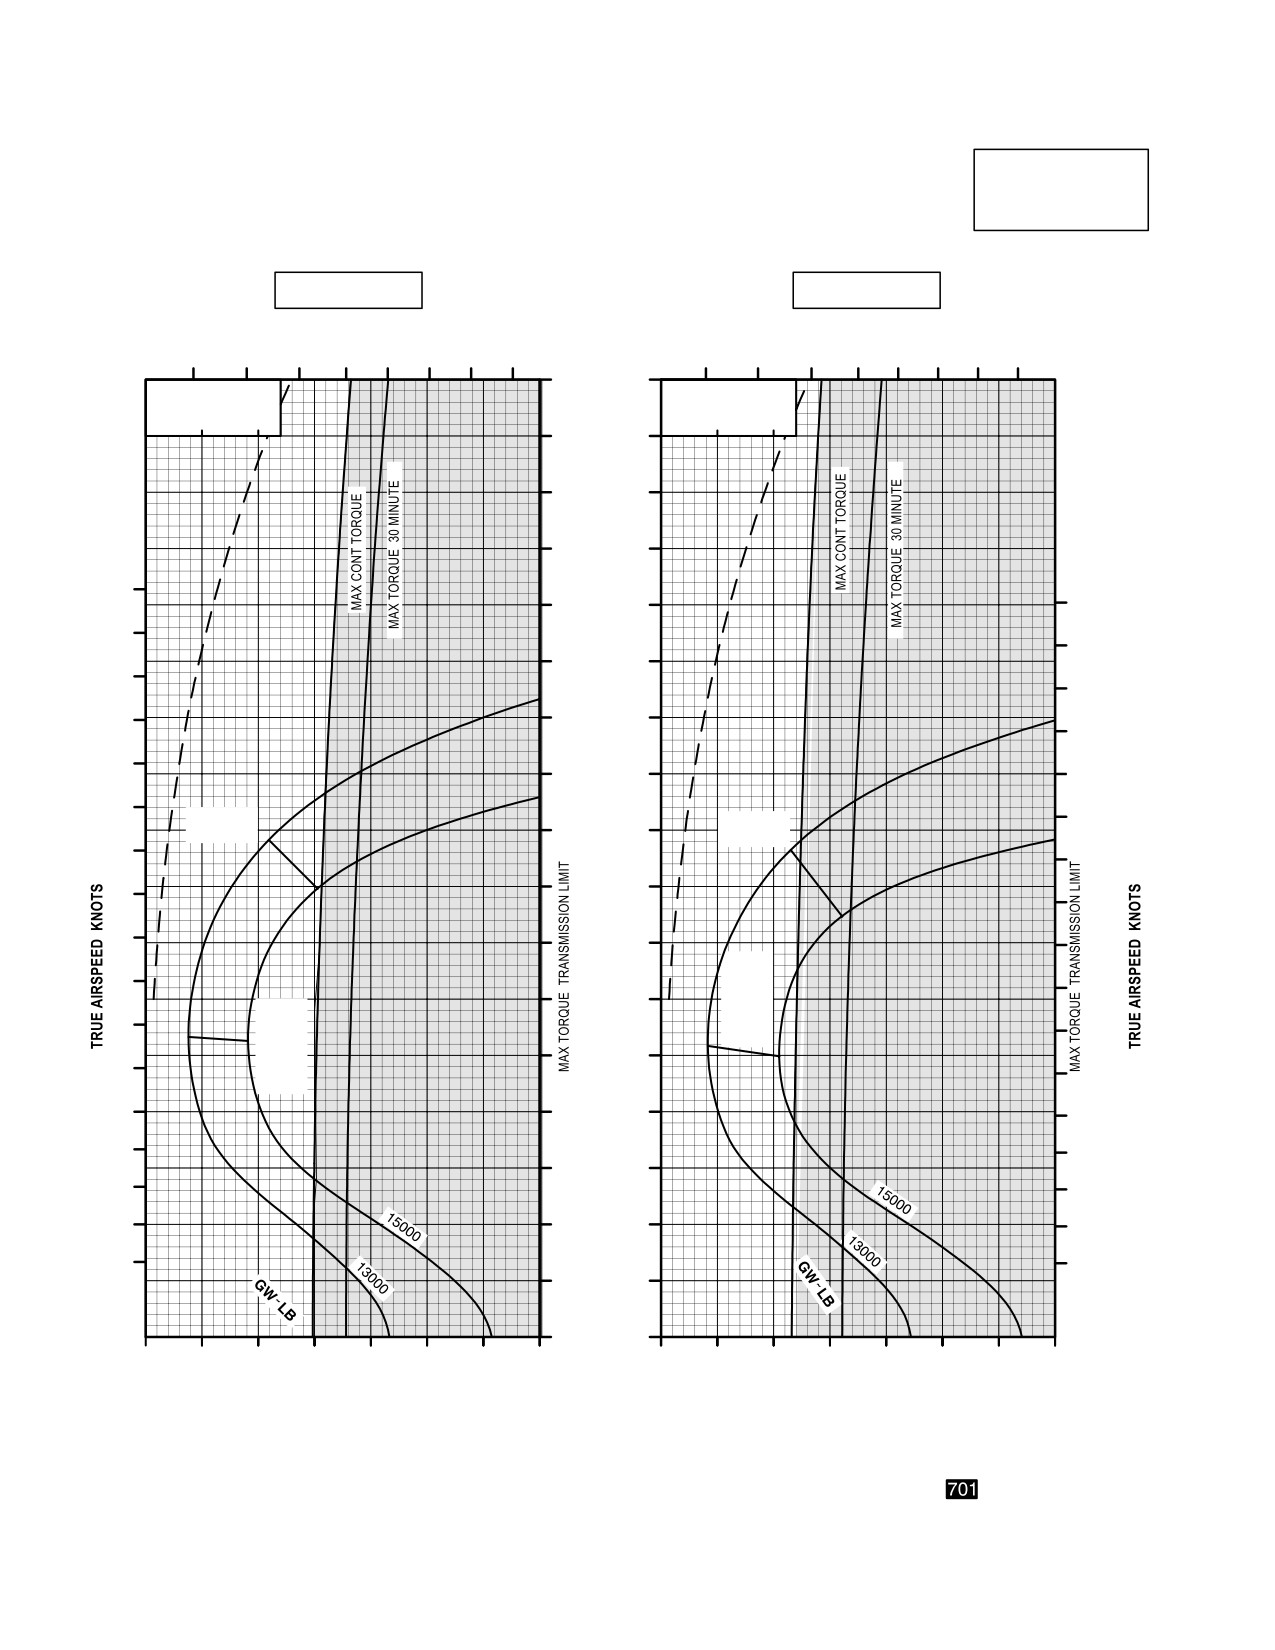
TM 1-1520-251-10
CRUISE
CRUISE
AH64D
PRESSURE ALTITUDE 14,000 FEET
T700GE701
101% NR RPM, 8 HELLFIRE CONFIGURATION, JP8 FUEL
FAT = +10°C
INDICATED
FAT = +20°C
AIRSPEED
TOTAL FUEL FLOW LB/HOUR
KNOTS
TOTAL FUEL FLOW LB/HOUR
600
800
1000
1200
600
800
1000
1200
170
∆Q %
∆Q %
∆ F = 10.0 SQ FT
∆ F = 10.0 SQ FT
0
10
20
0
10
20
160
150
140
180
130
180
170
170
120
160
160
150
110
150
140
100
140
130
MAX
MAX
130
RANGE
90
RANGE
120
120
80
110
110
100
70
100
MAX
90
R/C
90
60
OR
MAX
80
MAX
R/C
80
END
OR
50
70
MAX
70
END
60
40
60
50
50
30
40
40
30
20
30
20
20
10
0
30
40
50
60
70
80
90
100
30
40
50
60
70
80
90
100
INDICATED TORQUE PER ENGINE %
INDICATED TORQUE PER ENGINE %
DATA BASIS: DERIVED FROM FLIGHT TEST AND ENGINE MODEL SPEC NO. DARCOMCP22202701A, DATED 15 JANUARY 1987
LBA5278
Figure 7-24. Cruise Chart, 14,000 Feet, +10°C and +20°C (sheet 4 of 5)
Use or disclosure of this information is subject to the restriction(s) on the title page of this document.
7-64
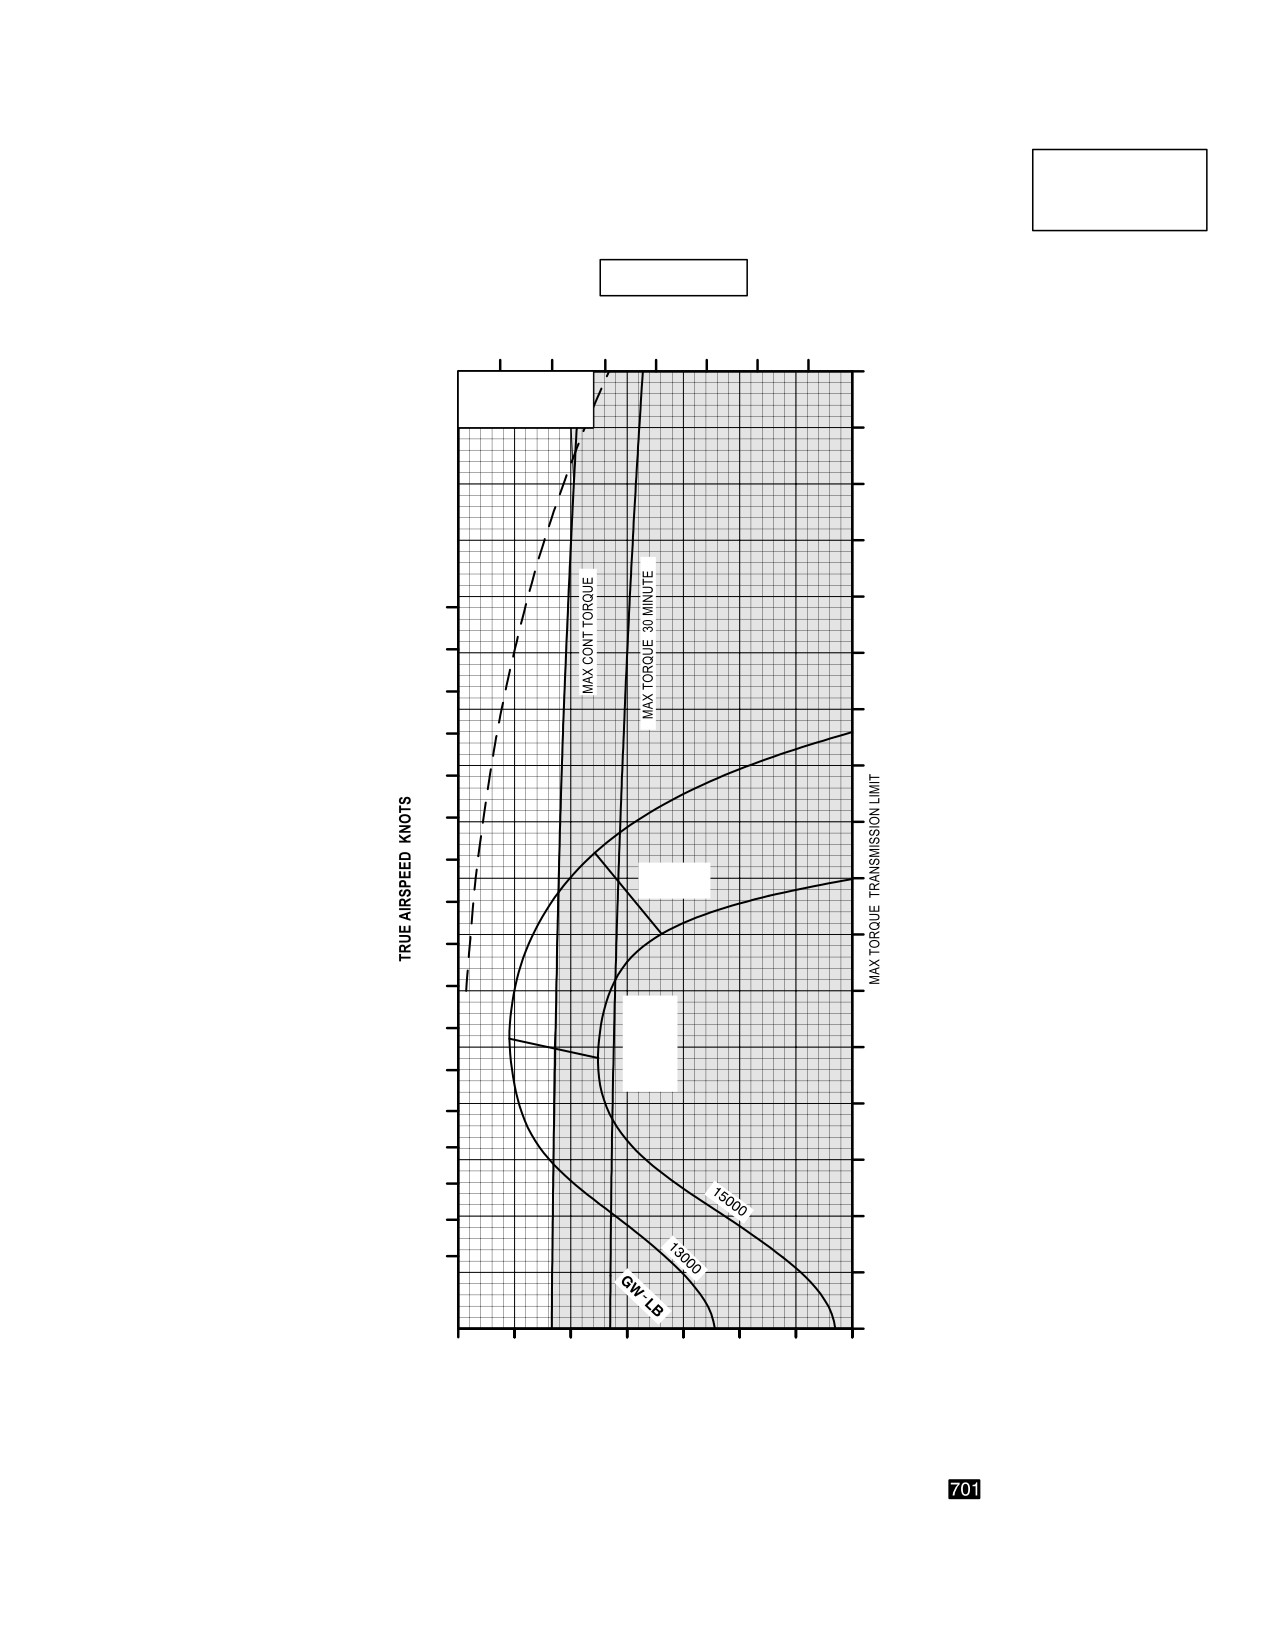
TM 1-1520-251-10
CRUISE
CRUISE
AH64D
PRESSURE ALTITUDE 14,000 FEET
T700GE701
101% NR RPM, 8 HELLFIRE CONFIGURATION, JP8 FUEL
FAT = +30°C
INDICATED
TOTAL FUEL FLOW LB/HOUR
AIRSPEED
KNOTS
600
800
1000
1200
170
∆Q %
∆ F = 10.0 SQ FT
0
10
20
160
150
140
130
180
170
120
160
110
150
100
140
130
90
120
MAX
80
RANGE
110
70
100
90
60
MAX
80
R/C
OR
50
70
MAX
END
40
60
50
30
40
30
20
20
10
0
30
40
50
60
70
80
90
100
INDICATED TORQUE PER ENGINE %
DATA BASIS: DERIVED FROM FLIGHT TEST AND ENGINE MODEL SPEC NO. DARCOMCP22202701A, DATED 15 JANUARY 1987
LBA5279
Figure 7-24. Cruise Chart, 14,000 Feet, +30°C (sheet 5 of 5)
Use or disclosure of this information is subject to the restriction(s) on the title page of this document.
7-65
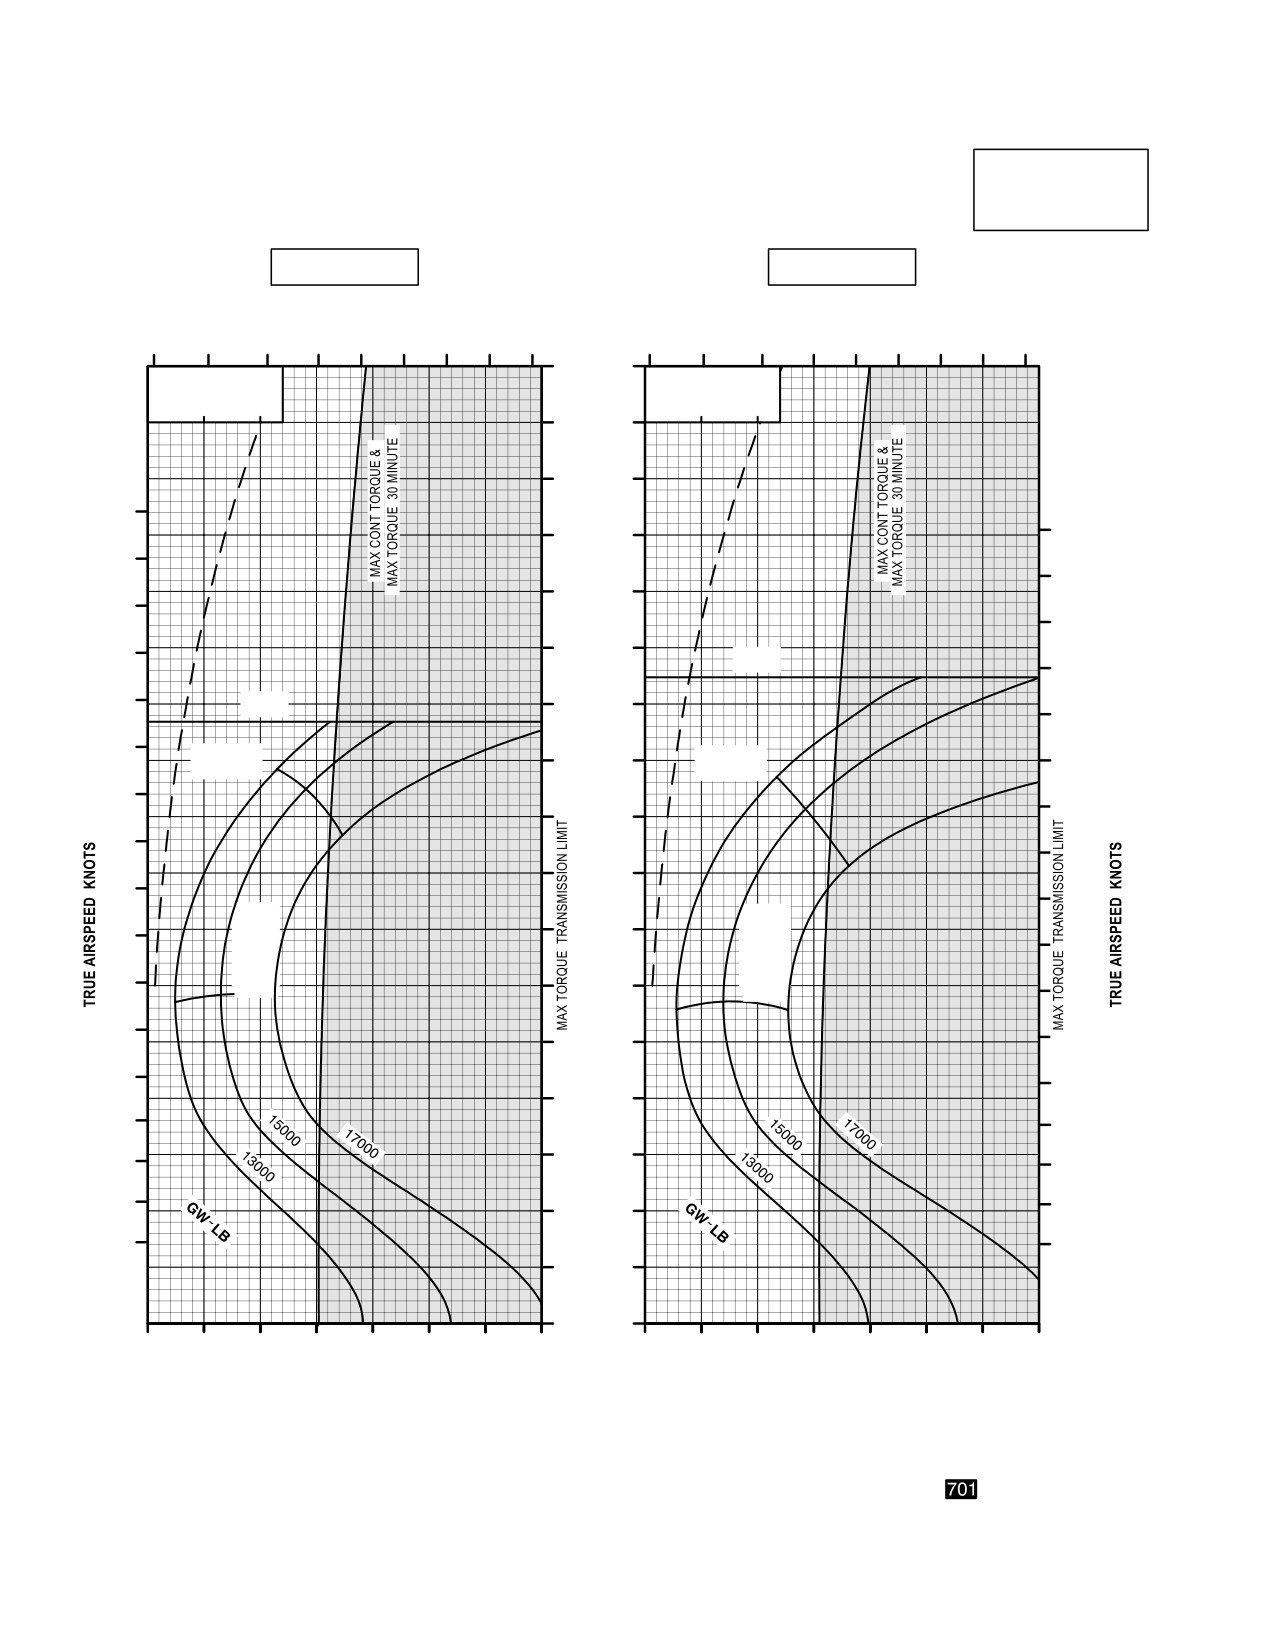
TM 1-1520-251-10
CRUISE
CRUISE
AH64D
PRESSURE ALTITUDE 16,000 FEET
T700GE701
101% NR RPM, 8 HELLFIRE CONFIGURATION, JP8 FUEL
FAT = 50 °C
FAT = 40 °C
INDICATED
TOTAL FUEL FLOW LB/HOUR
TOTAL FUEL FLOW LB/HOUR
AIRSPEED
KNOTS
500
700
900
1100
1300
500
700
900
1100
1300
170
∆Q %
∆Q %
∆ F = 10.0 SQ FT
∆ F = 10.0 SQ FT
0
10
20
0
10
20
160
150
180
180
140
170
170
130
160
160
150
120
V
NE
150
140
V
NE
110
140
130
MAX
MAX
100
130
RANGE
RANGE
120
120
90
110
110
80
100
100
MAX
MAX
R/C
70
90
R/C
90
OR
OR
MAX
MAX
80
END
60
END
80
70
70
50
60
60
40
50
50
40
30
40
30
30
20
20
20
10
0
30
40
50
60
70
80
90
100
30
40
50
60
70
80
90
100
INDICATED TORQUE PER ENGINE %
INDICATED TORQUE PER ENGINE %
DATA BASIS: DERIVED FROM FLIGHT TEST AND ENGINE MODEL SPEC NO. DARCOMCP22202701A, DATED 15 JANUARY 1987
LBA5280
Figure 7-25. Cruise chart, 16,000 Feet, - 50°C and - 40°C (sheet 1 of 4)
Use or disclosure of this information is subject to the restriction(s) on the title page of this document.
7-66
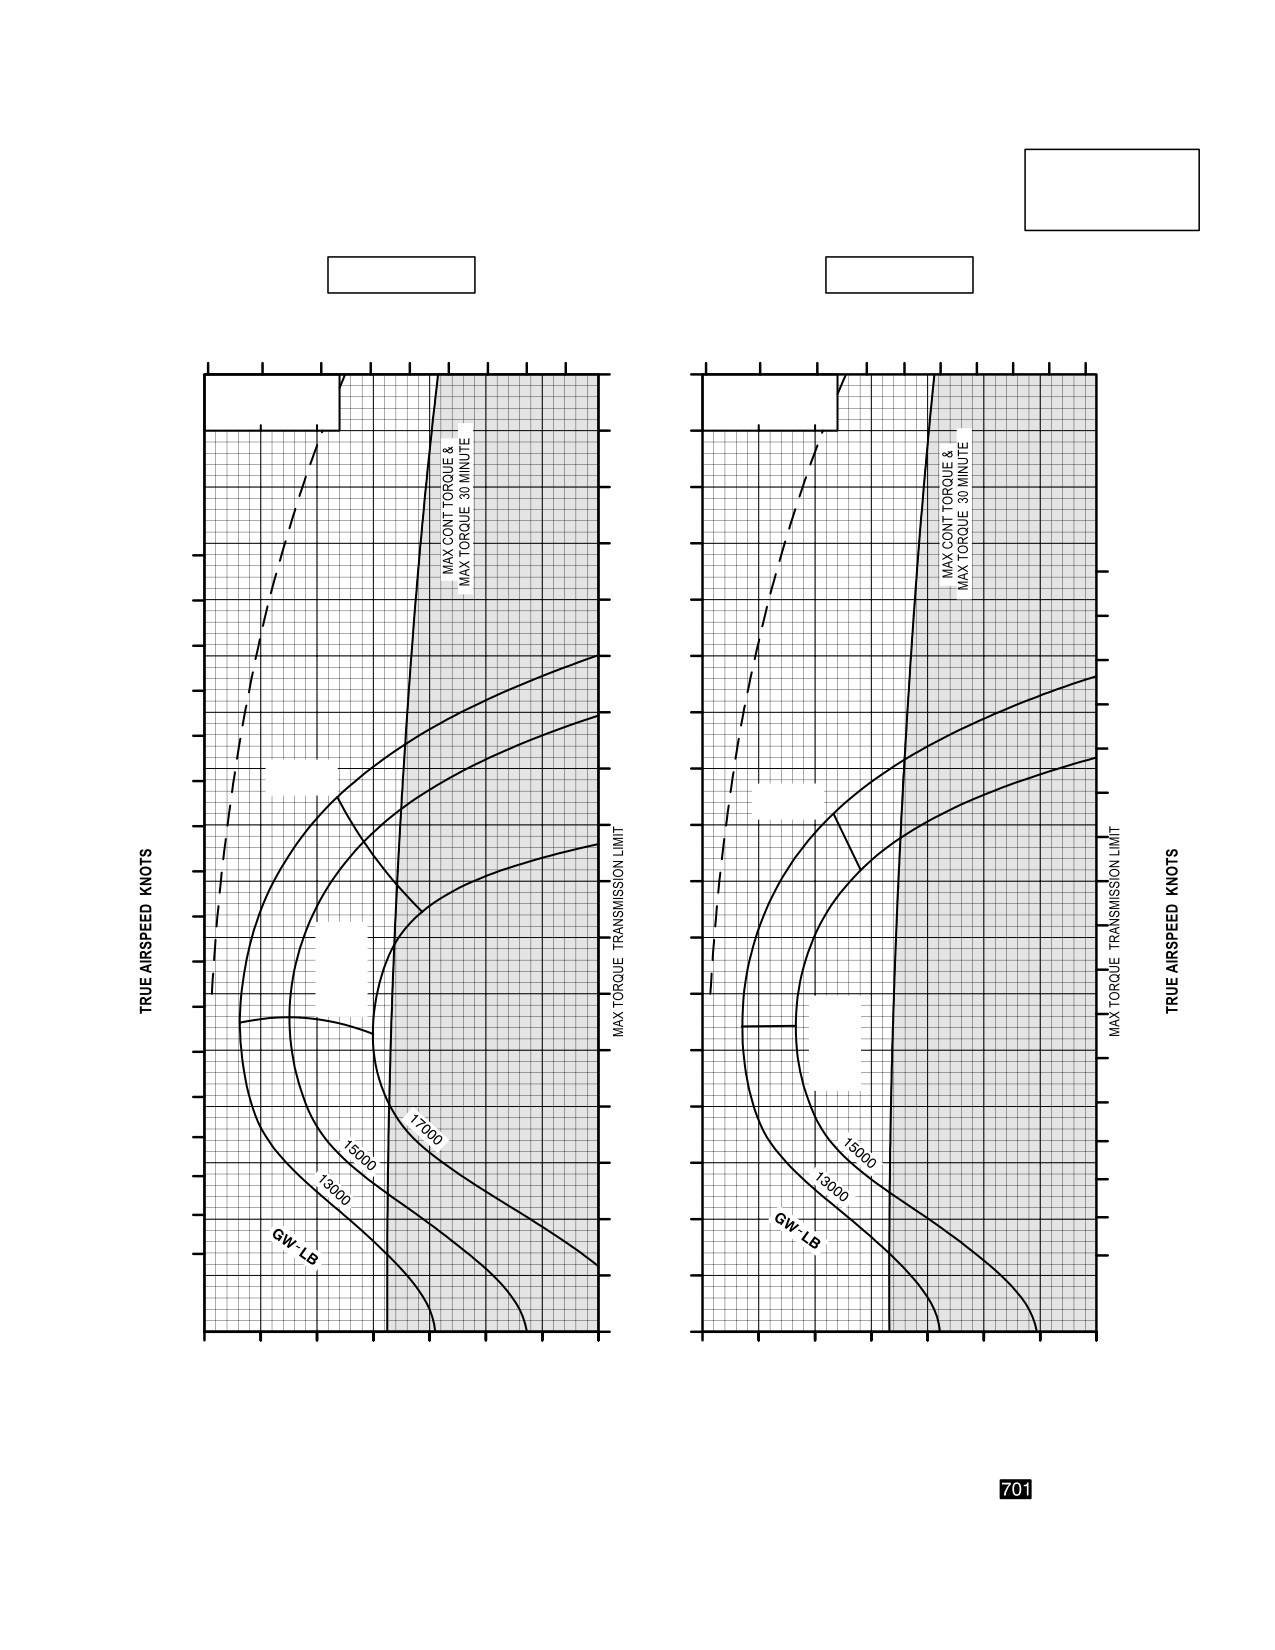
TM 1-1520-251-10
CRUISE
CRUISE
AH64D
PRESSURE ALTITUDE 16,000 FEET
T700GE701
101% NR RPM, 8 HELLFIRE CONFIGURATION, JP8 FUEL
FAT = 30° C
FAT = 20° C
INDICATED
TOTAL FUEL FLOW LB/HOUR
TOTAL FUEL FLOW LB/HOUR
AIRSPEED
KNOTS
500
700
900
1100
1300
500
700
900
1100
1300
170
∆Q %
∆Q %
∆ F = 10.0 SQ FT
∆ F = 10.0 SQ FT
0
10
20
0
10
20
160
150
140
180
180
170
130
170
160
120
160
150
150
110
140
140
MAX
100
130
RANGE
MAX
130
RANGE
120
90
120
110
80
110
100
100
MAX
70
R/C
90
90
OR
MAX
60
80
MAX
END
80
R/C
OR
70
50
MAX
70
END
60
60
40
50
50
30
40
40
30
20
30
20
20
10
0
30
40
50
60
70
80
90
100
30
40
50
60
70
80
90
100
INDICATED TORQUE PER ENGINE %
INDICATED TORQUE PER ENGINE %
DATA BASIS: DERIVED FROM FLIGHT TEST AND ENGINE MODEL SPEC NO. DARCOMCP22202701A, DATED 15 JANUARY 1987
LBA5281
Figure 7-25. Cruise chart, 16,000 Feet, - 30°C and - 20°C (sheet 2 of 4)
Use or disclosure of this information is subject to the restriction(s) on the title page of this document.
7-67
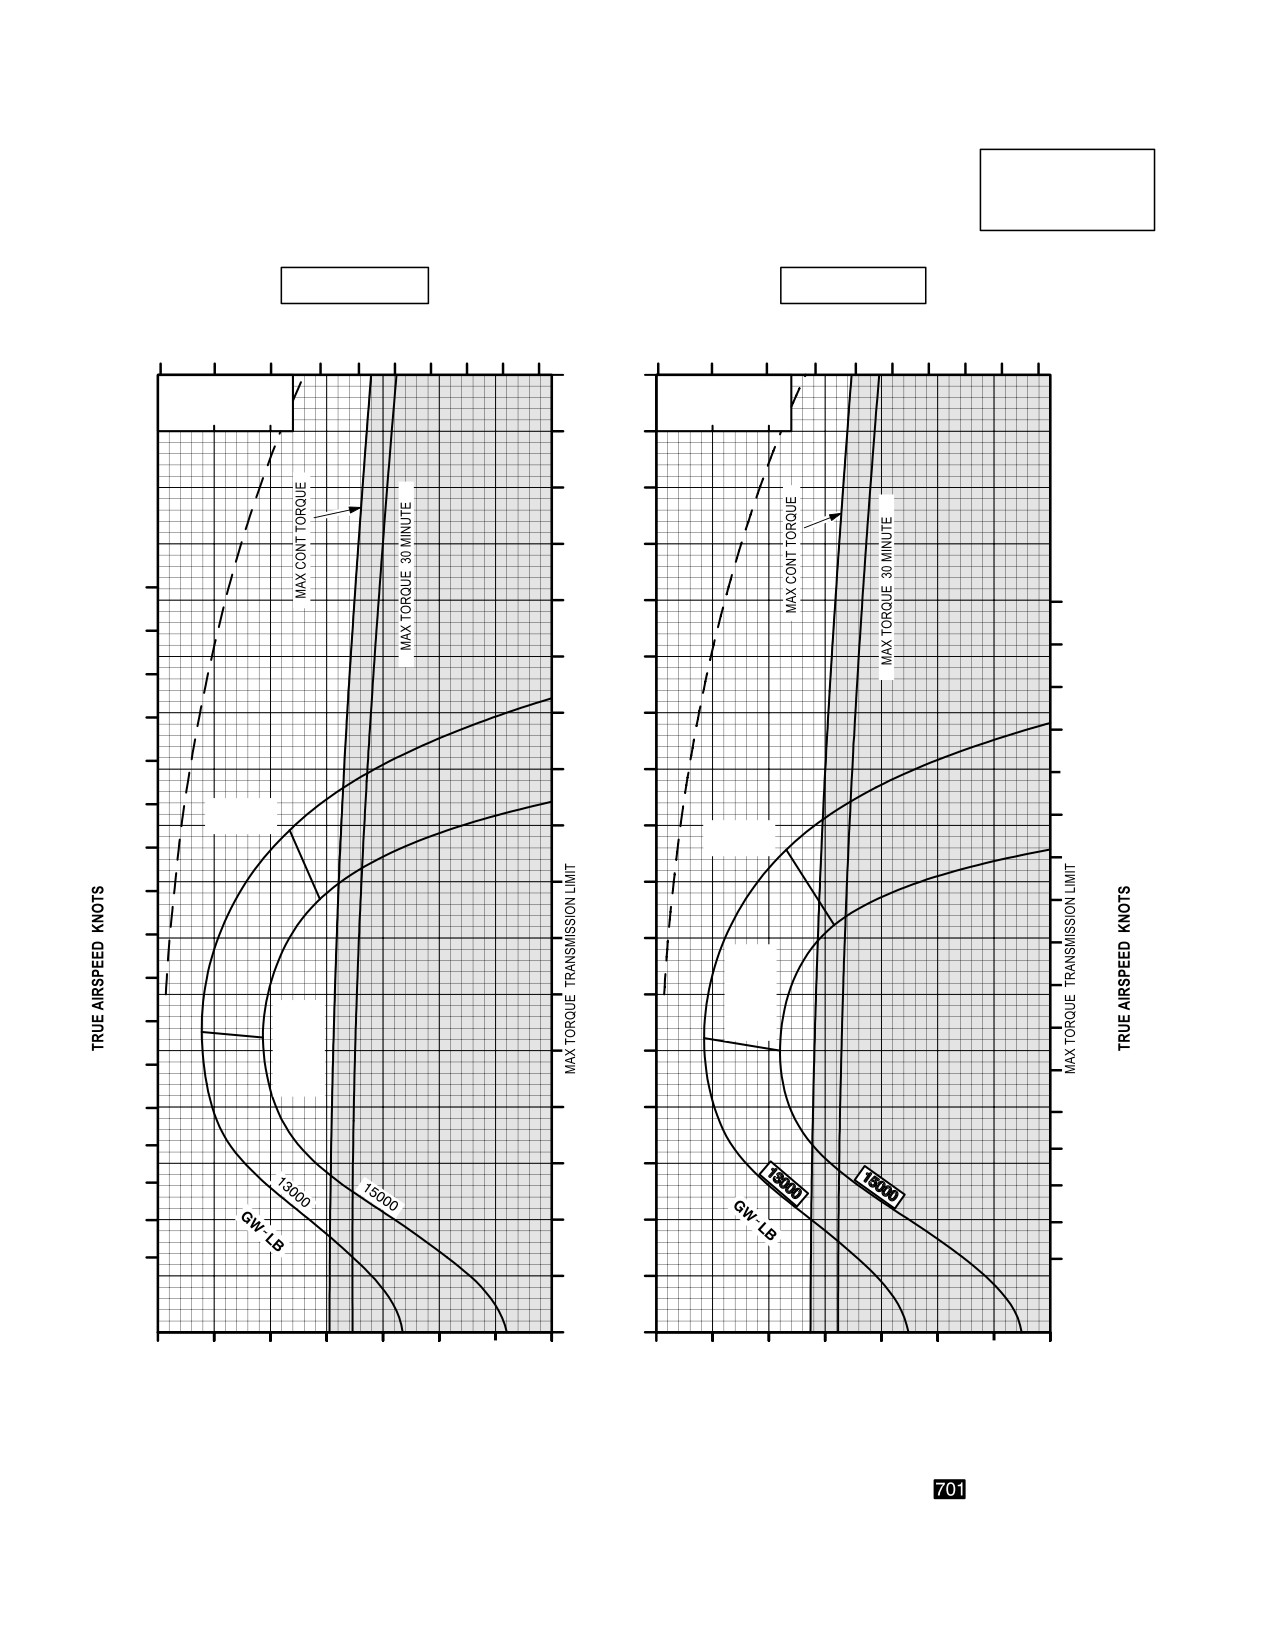
TM 1-1520-251-10
CRUISE
CRUISE
AH64D
PRESSURE ALTITUDE 16,000 FEET
T700GE701
101% NR RPM, 8 HELLFIRE CONFIGURATION, JP8 FUEL
FAT = 10 °C
FAT = 0 °C
INDICATED
TOTAL FUEL FLOW LB/HOUR
AIRSPEED
TOTAL FUEL FLOW LB/HOUR
KNOTS
500
700
900
1100
1300
500
700
900
1100
1300
170
∆Q %
∆Q %
∆ F = 10.0 SQ FT
∆ F = 10.0 SQ FT
0
10
20
0
10
20
160
150
140
180
130
180
170
170
120
160
160
110
150
150
140
100
140
130
MAX
130
RANGE
90
MAX
120
RANGE
120
80
110
110
100
70
100
MAX
90
R/C
90
60
OR
MAX
MAX
80
R/C
END
80
OR
50
70
MAX
70
END
60
40
60
50
50
30
40
40
30
20
30
20
20
10
0
30
40
50
60
70
80
90
100
30
40
50
60
70
80
90
100
INDICATED TORQUE PER ENGINE %
INDICATED TORQUE PER ENGINE %
DATA BASIS: DERIVED FROM FLIGHT TEST AND ENGINE MODEL SPEC NO. DARCOMCP22202701A, DATED 15 JANUARY 1987
LBA5282
Figure 7-25. Cruise Chart, 16,000 Feet, - 10°C and 0°C (sheet 3 of 4)
Use or disclosure of this information is subject to the restriction(s) on the title page of this document.
7-68
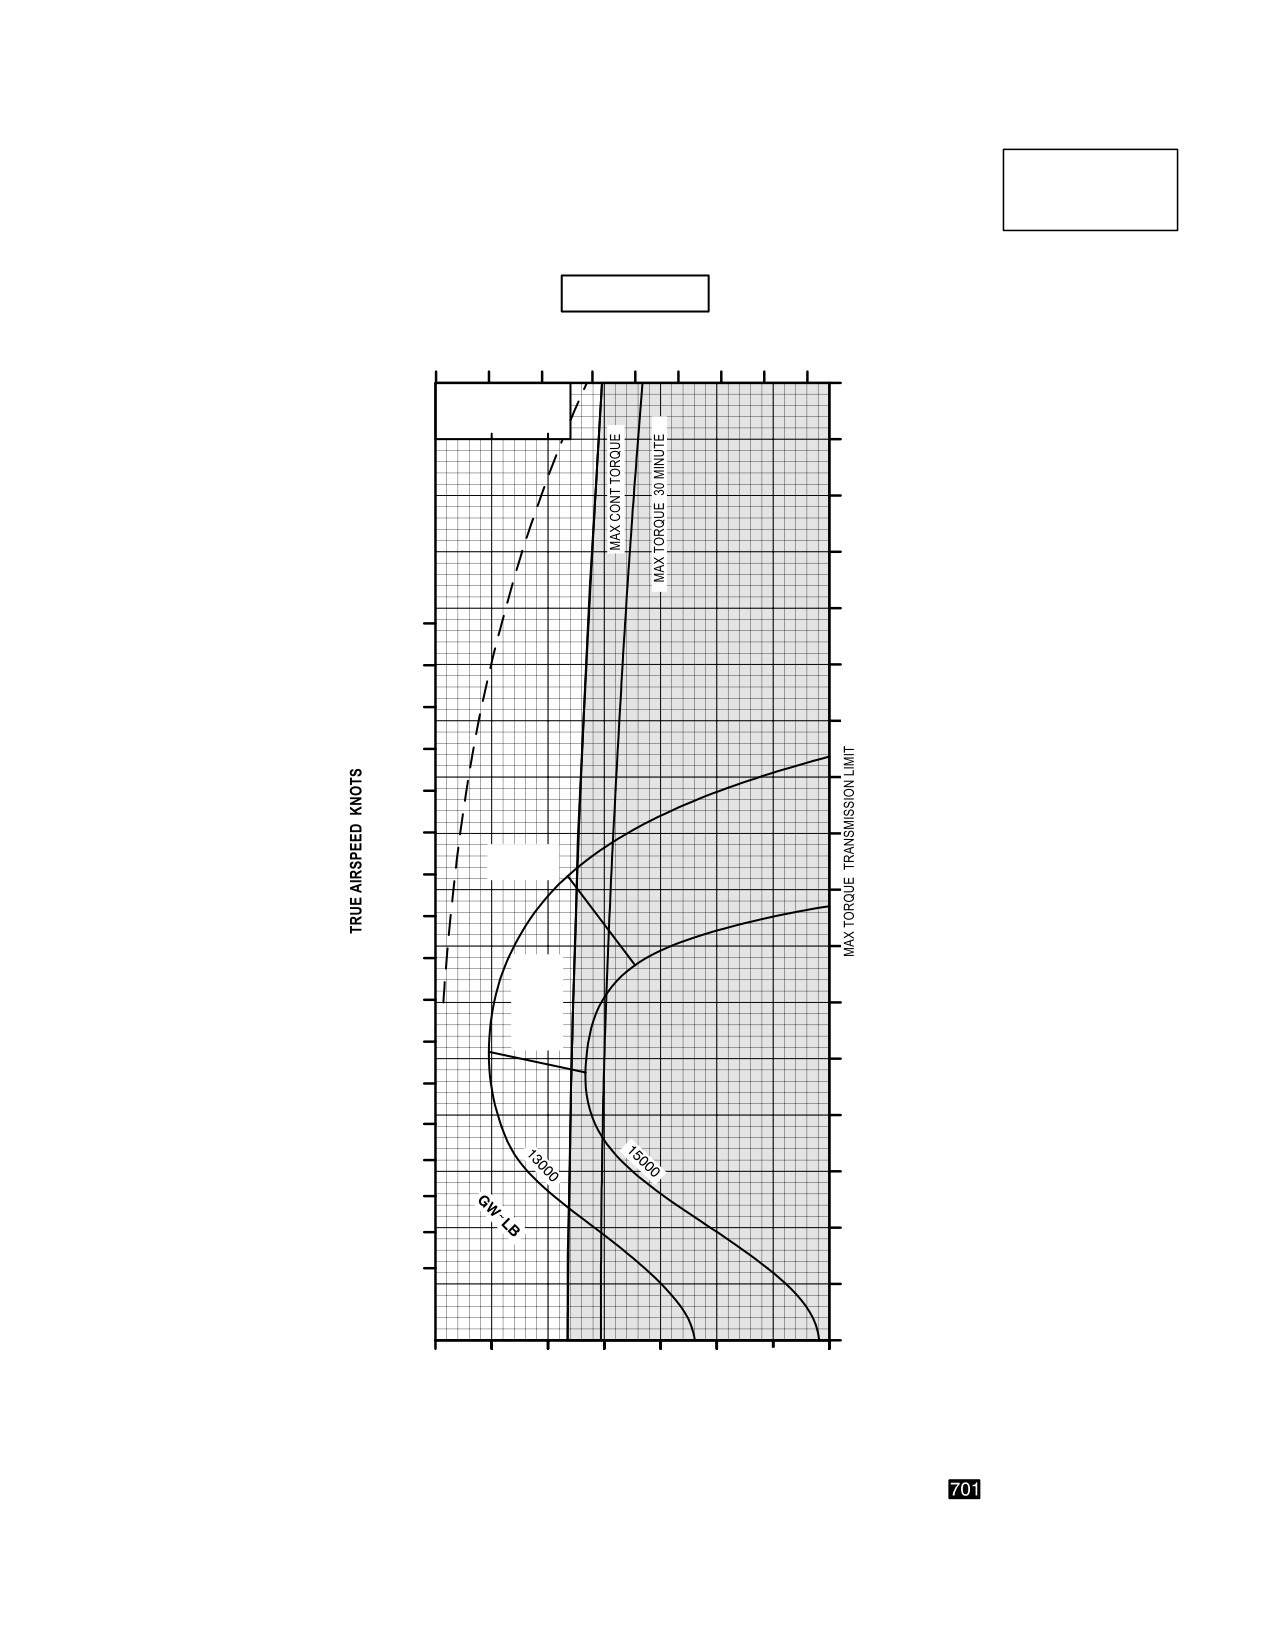
TM 1-1520-251-10
CRUISE
CRUISE
AH64D
PRESSURE ALTITUDE 16,000 FEET
T700GE701
101% NR RPM, 8 HELLFIRE CONFIGURATION, JP8 FUEL
FAT = +10° C
INDICATED
AIRSPEED
TOTAL FUEL FLOW LB/HOUR
KNOTS
500
700
900
1100
1300
170
∆Q %
∆ F = 10.0 SQ FT
0
10
20
160
150
140
130
180
170
120
160
110
150
100
140
130
90
MAX
120
RANGE
80
110
70
100
MAX
R/C
90
OR
60
MAX
80
END
50
70
40
60
50
30
40
20
30
20
10
0
30
40
50
60
70
80
90
100
INDICATED TORQUE PER ENGINE %
DATA BASIS: DERIVED FROM FLIGHT TEST AND ENGINE MODEL SPEC NO. DARCOMCP22202701A, DATED 15 JANUARY 1987
LBA5283
Figure 7-25. Cruise Chart, 16,000 Feet, +10°C (sheet 4 of 4)
Use or disclosure of this information is subject to the restriction(s) on the title page of this document.
7-69
TM 1-1520-251-10
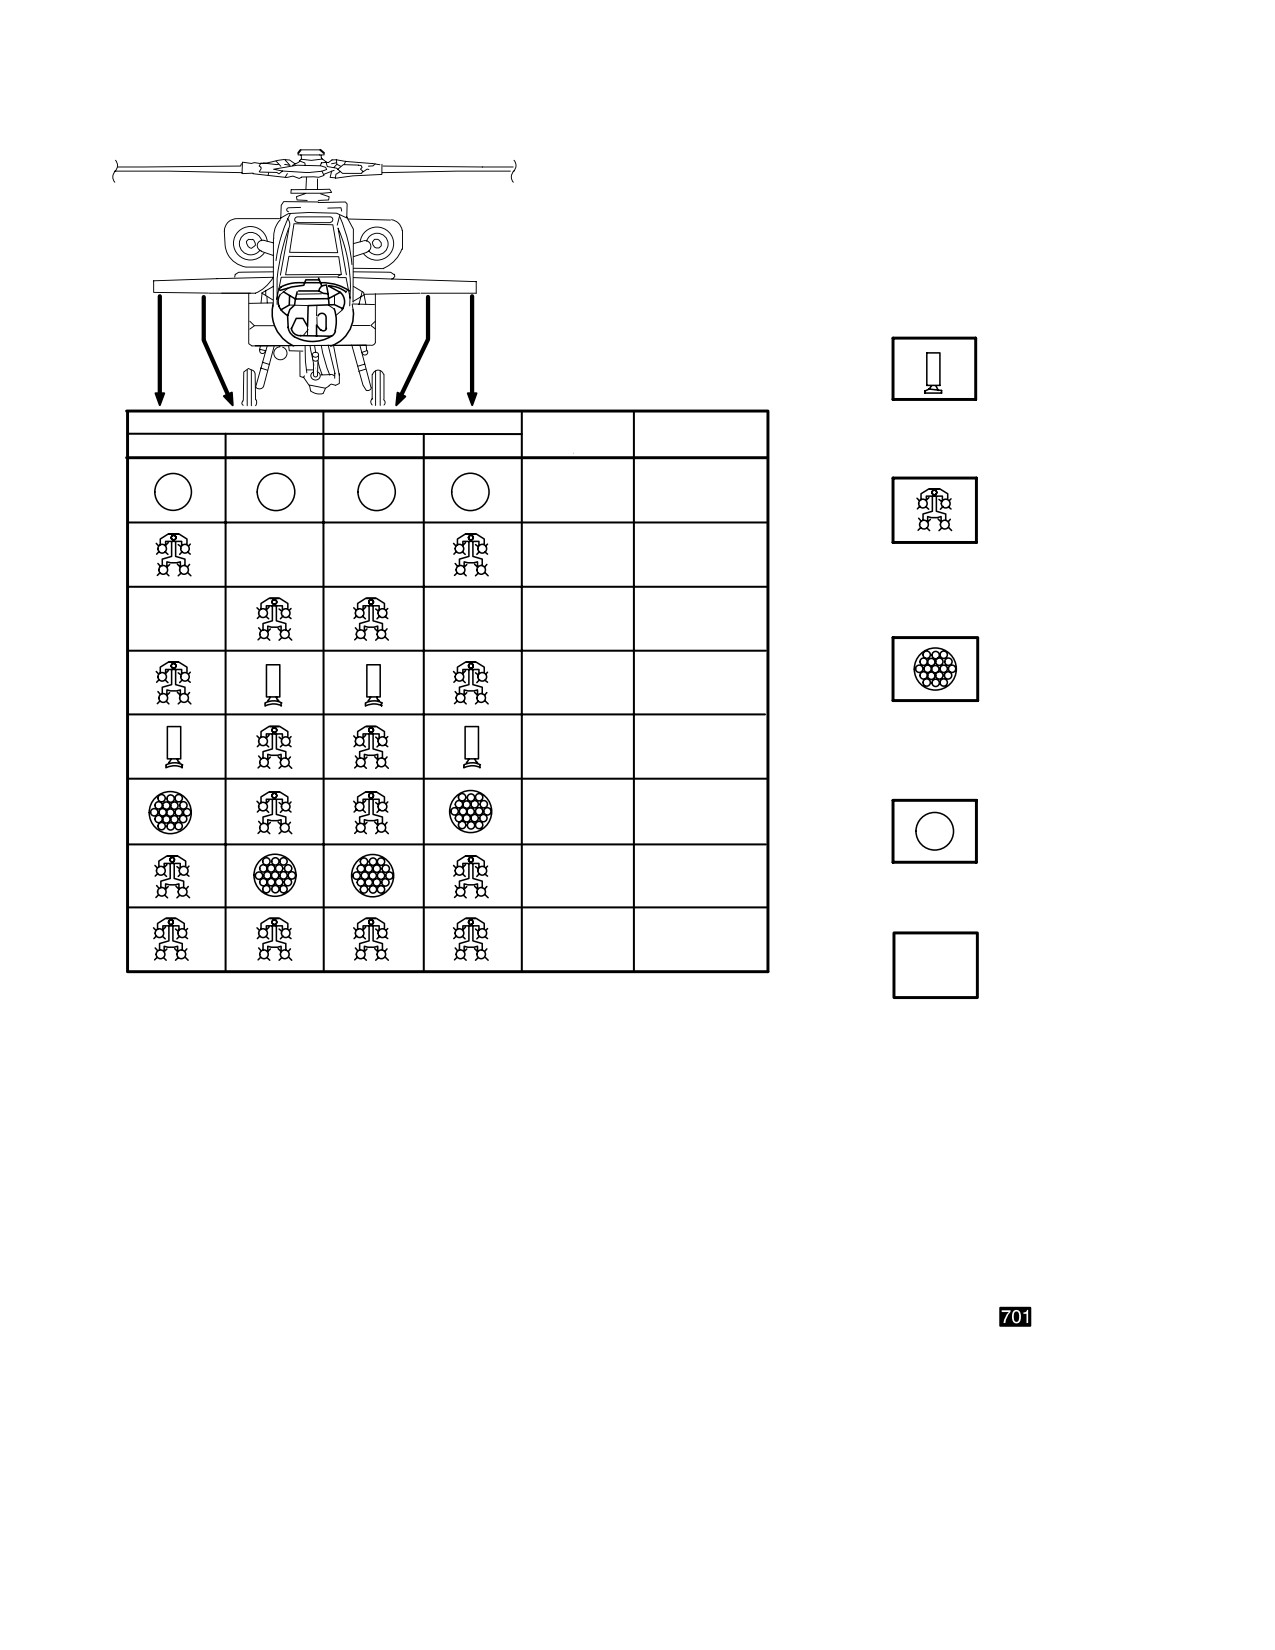
Section VI. DRAG
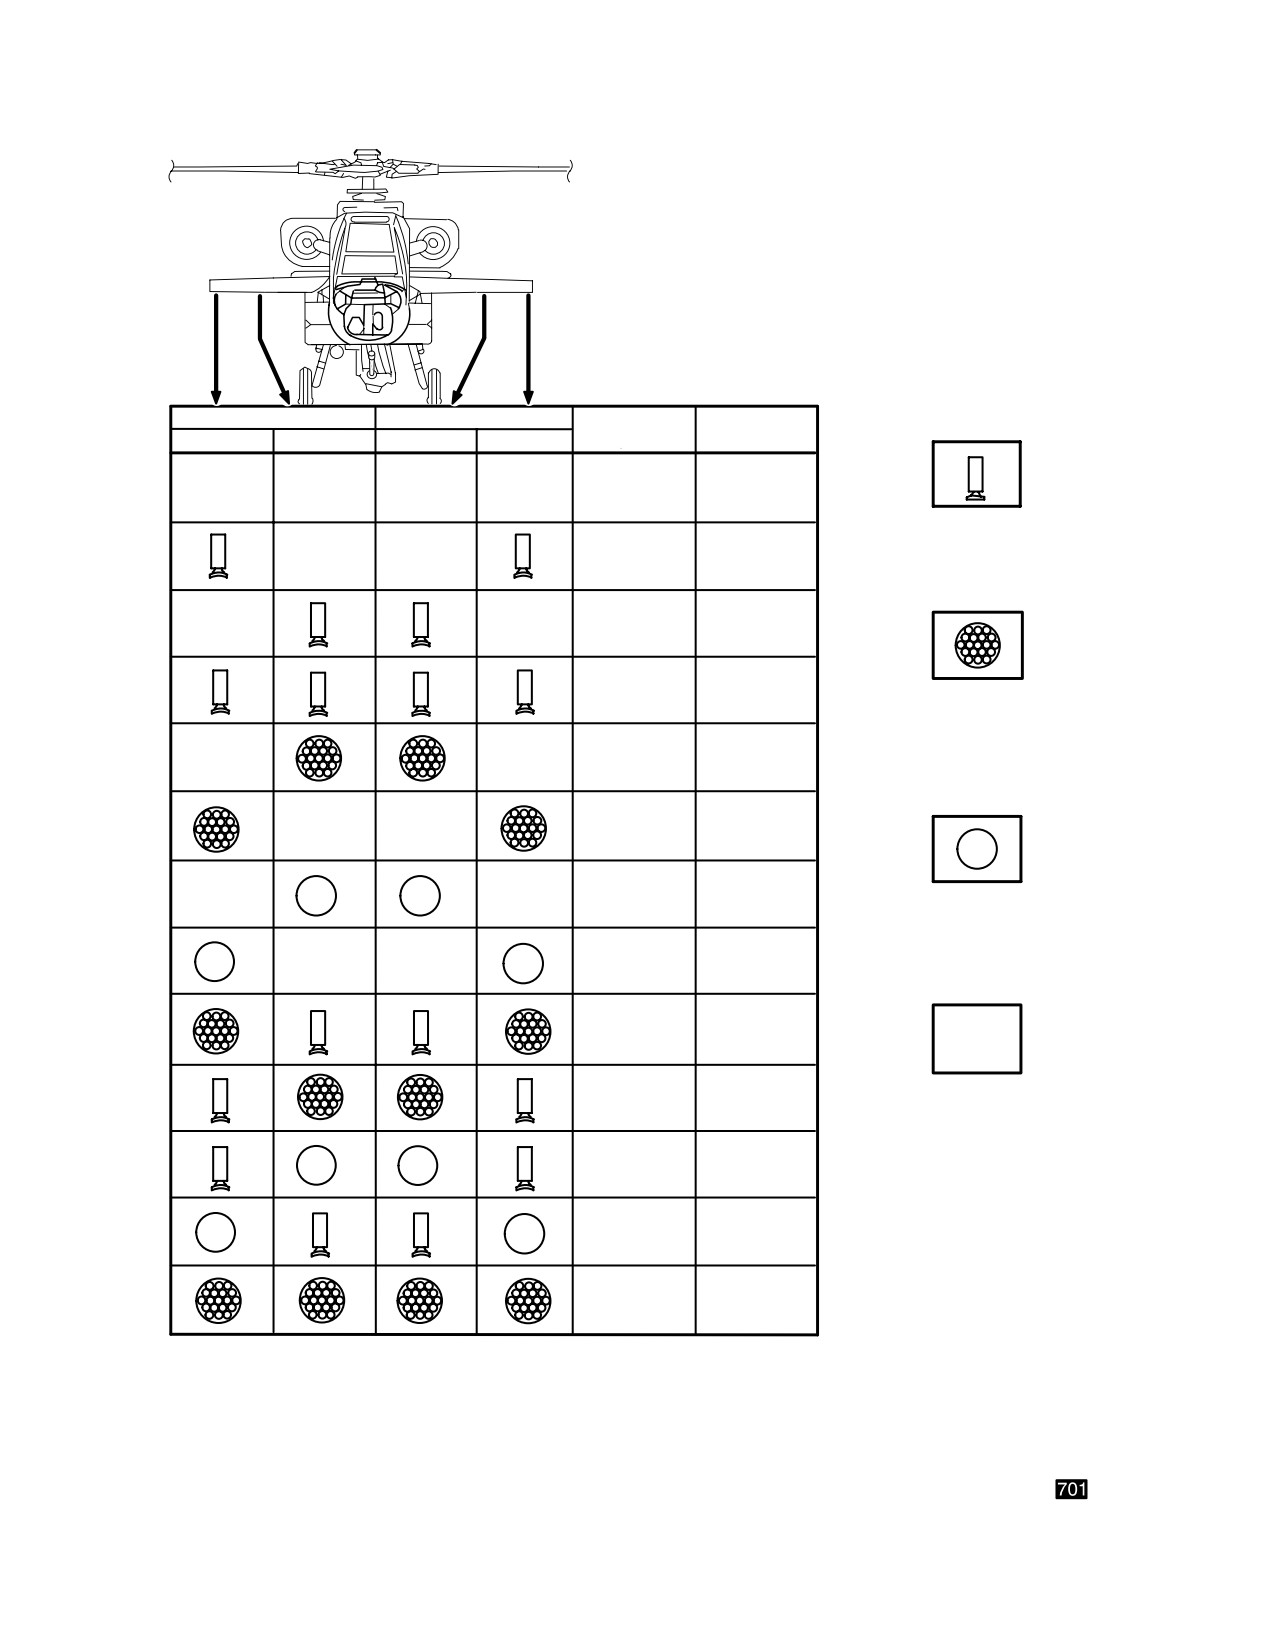
7.24 DESCRIPTION
tor, it is necessary to know what combination of stores is
installed. Enter the chart at the top, move down to the il-
The drag chart (fig 7-26) shows the change in frontal area
lustration that matches the desired combination, and then
(nF) for each wing-stores combination that can be in-
move right and read nF and the multiplying factor. Use the
stalled on the helicopter. The baseline configuration (pri-
multiplying factor and data in Section V, Cruise to deter-
mary mission) consists of one pylon and one full Hellfire
mine the resulting change in torque.
launcher on each inboard stores station. The baseline
configuration includes the Wire Strike Protection System
(WSPS) and Aircraft Survivability Equipment (ASE).
7.26 CONDITIONS
7.25 USE OF CHART
The drag chart is based on the primary mission configura-
To determine the nF and the associated multiplying fac-
tion having zero change in frontal area.
Use or disclosure of this information is subject to the restriction(s) on the title page of this document.
7-70
TM 1-1520-251-10
RIGHT WING STORES
LEFT WING STORES
∆ F
MULTIPLYING
OUTBOARD
INBOARD
INBOARD
OUTBOARD
(SQ. FT.)
FACTOR
9.1
0.91
STORES PYLON
(EMPTY)
7.3
0.73
7.3
0.73
5.5
0.55
STORES PYLONS PLUS
19 TUBE ROCKET LAUNCHER
(LOADED WITH 19 ROCKETS)
5.9
0.59
5.9
0.59
3.2
0.32
STORES PYLONS PLUS
EXTERNAL FUEL TANK
3.9
0.39
4.1
0.41
CLEAN STATION
4.1
0.41
1.4
0.14
2.1
0.21
2.7
0.27
FOR FCR KIT (MMA, RFI AND DEROTATION UNIT) INSTALLATION, ADD +8.1 SQ. FT. TO ∆ F AND +0.81
TO MULTIPLYING FACTOR.
FOR PEACE VANGUARD UNIQUE ANTENNA CONFIGURATION (UHF, TACAN AND HF)
LBA2505
Figure 7-26. Drag Chart and Authorized Armament Configurations (Sheet 1 of 2)
Use or disclosure of this information is subject to the restriction(s) on the title page of this document.
7-71
TM 1-1520-251-10
STORES PYLON
RIGHT WING STORES
LEFT WING STORES
∆ F
MULTIPLYING
(EMPTY)
OUTBOARD
INBOARD
INBOARD
OUTBOARD
(SQ. FT.)
FACTOR
+2.0
+0.20
1.4
0.14
STORES PYLONS PLUS
HELLFIRE MISSILE LAUNCHER
(LOADED WITH 4 MISSILES)
0
0
(BASELINE)
(BASELINE)
+0.4
+0.04
STORES PYLONS PLUS
19 TUBE ROCKET LAUNCHER
+1.8
+0.18
(LOADED WITH 19 ROCKETS)
+3.2
+0.32
+1.8
+0.18
STORES PYLONS PLUS
EXTERNAL FUEL TANK
+7.6
+0.76
FOR FCR KIT (MMA, RFI AND DEROTATION UNIT) INSTALLATION, ADD +8.1 SQ. FT. TO ∆ F AND +0.81
TO MULTIPLYING FACTOR
CLEAN STATION
LBA2506
Figure 7-26. Drag Chart and Authorized Armament Configurations (Sheet 2 of 2)
Use or disclosure of this information is subject to the restriction(s) on the title page of this document.
7-72
TM 1-1520-251-10
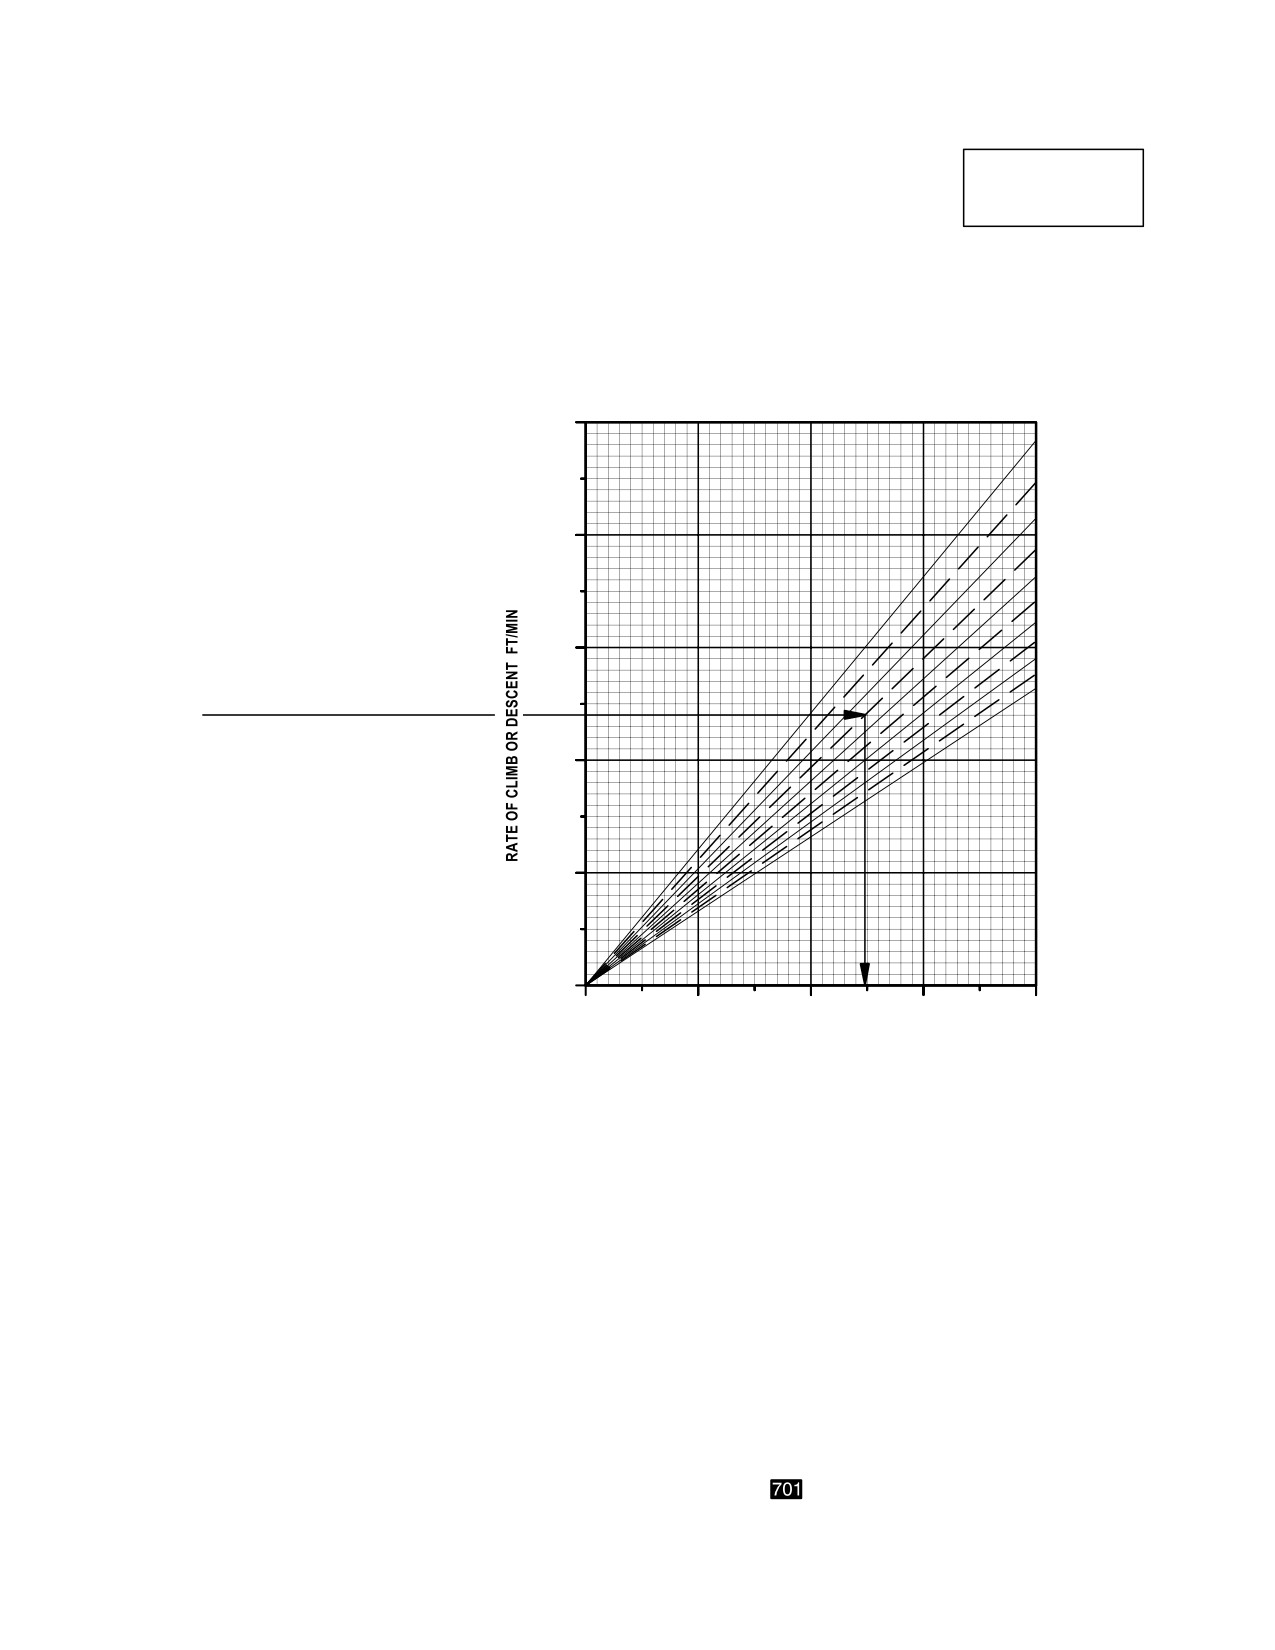
Section VII. CLIMB DESCENT
7.27 DESCRIPTION
gross weight, and then move down and read the torque
change. This torque change must be added to (for climb)
The climb-descent chart (fig 7-27) shows the change in
or subtracted from (for descent) the torque required for
torque (above and below the torque required for level
level flight (obtained from the appropriate cruise chart) to
flight under the same configuration, gross weight, and at-
obtain a total climb or descent torque.
mospheric conditions) to obtain a desired rate of climb or
descent.
7.28.2
Alternate Use. By entering the chart with a
known torque change, and moving up to the known gross
7.28 USE OF CHART
weight and then left, the corresponding rate of climb or de-
scent can also be obtained.
7.28.1 Primary Use. The primary use of the chart is il-
lustrated by the example. To determine the change in
7.29 CONDITIONS
torque, it is necessary to know the gross weight and the
desired rate of climb or descent. Enter the chart at the de-
sired rate of climb or descent, move right to the known
The climb-descent chart is based on 101% rotor RPM.
Use or disclosure of this information is subject to the restriction(s) on the title page of this document.
7-73
TM 1-1520-251-10
CLIMBDESCENT
CLIMB DESCENT
AH64D
T700GE701
GROSS WEIGHT LB
5000
12,000
13,000
EXAMPLE
14,000
4000
WANTED
15,000
CALIBRATED TORQUE CHANGE
FOR DESIRED RATE OF CLIMB
16,000
OR DESCENT
17,000
KNOWN OR ESTIMATED
18,000
GROSS WEIGHT = 15,000 LB
3000
19,000
DESIRED R/C = 2400 FT/MIN
20,000
21,000
METHOD
22,000
ENTER R/C HERE
MOVE RIGHT TO GROSS WEIGHT,
MOVE DOWN, READ CALIBRATED
2000
TORQUE CHANGE = 49.6%
REMARK
TORQUE CHANGE IS THE DIFFERENCE BETWEEN
TORQUE USED DURING CLIMB OR DESCENT AND
THE TORQUE REQUIRED FOR LEVEL FLIGHT AT
THE SAME CONDITIONS (ALTITUDE, TEMPERATURE,
1000
AIRSPEED, CONFIGURATION, ETC)
0
0
20
40
60
80
CALIBRATED TORQUE CHANGE %
DATA BASIS:
DERIVED FROM FLIGHT TEST
LBA2507
Figure 7-27. Climb-Descent Chart
Use or disclosure of this information is subject to the restriction(s) on the title page of this document.
7-74
TM 1-1520-251-10
CHAPTER 7A
PERFORMANCE DATA FOR AH-64D HELICOPTERS
EQUIPPED WITH T700-GE-701C ENGINES
Section I. INTRODUCTION
NOTE
Performance data can be obtained by using the PER-
FORMANCE (PERF) page or the performance charts
This chapter contains performance data for
contained in this chapter.
helicopters equipped with T-700-GE-701C
engines. Performance data for heli-
copters equipped with T-700-GE-701
engines is contained in Chapter 7.
WARNING
7A.1 PERFORMANCE DATA
The purpose of this chapter is to provide the best available
Do not rely on parameters displayed on
performance data for the AH-64D helicopter equipped
the PERF page for flight critical perfor-
with 701C
engines. Regular use of this information
mance information until validated by
will allow maximum safe use of the helicopter. Although
hover power check.
maximum performance is not always required, regular
use of the information in this chapter is recommended for
the following reasons:
7A.2 PERF PAGE
• Knowledge of performance margins will allow
better decisions when unexpected conditions or
alternate missions are encountered.
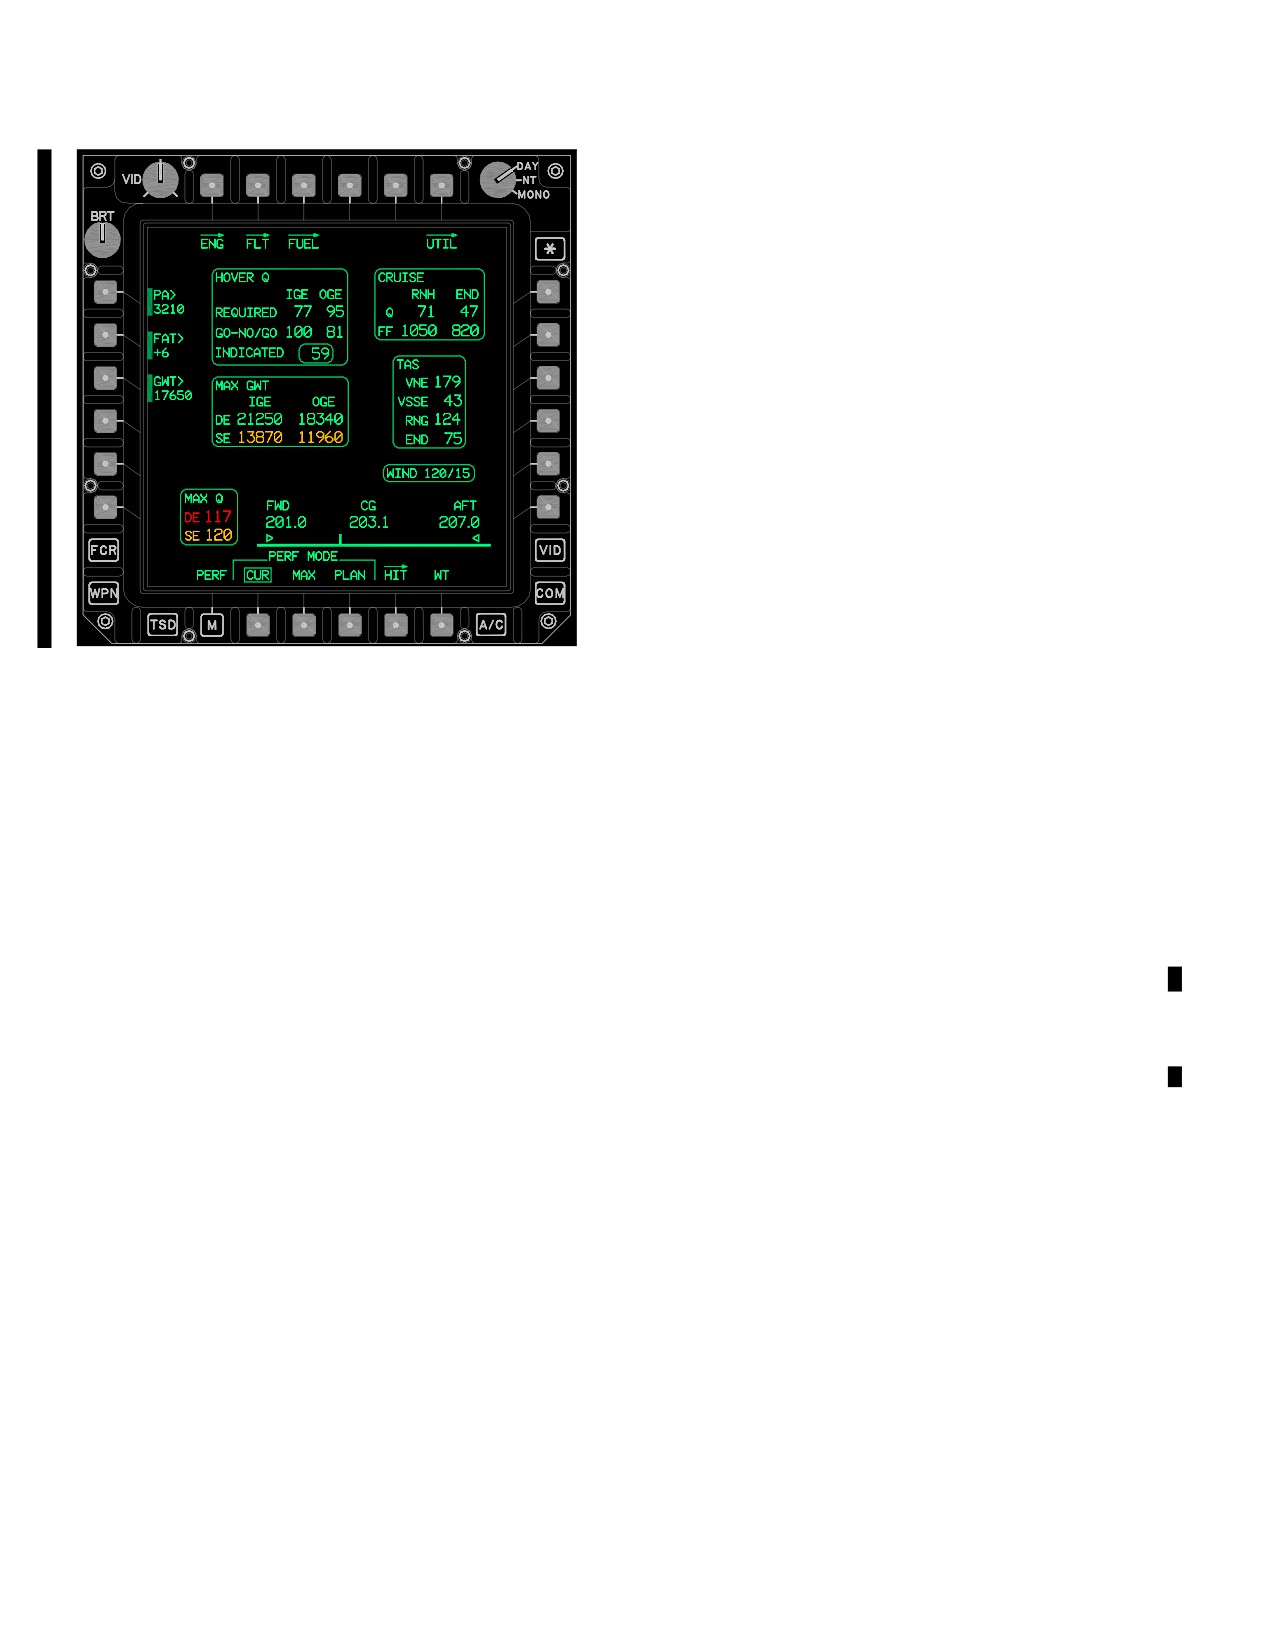
The PERF page (fig 7A-1] ) displays both dynamic and
projected performance parameters and operating limita-
• Situations requiring maximum performance will be
tions. Parameters include engine performance, fuel con-
readily recognized. Familiarity with the data will
sumption data, and weight and balance information. The
allow performance to be computed easily and
PERF page displays all the controls and information re-
quickly.
quired to operate the functions of the performance sys-
• Experience will be gained in accurately estimating
tem. The PERF page is accessed by selecting the PERF
the effects of conditions for which data is not
button depicted at the top of the ENG, FLT, FUEL, and
presented.
UTIL pages or directly from the MENU page. Buttons dis-
play the status of Pressure Altitude (PA), Free Air Temper-
ature (FAT), and Gross Weight (GWT). The page informa-
NOTE
tion will display data based on these conditions and the
The information is primarily intended for
PERFORMANCE (PERF) MODE selection. Selection of
mission planning and is most useful when
any other page will freeze the latest entries to the PERF
planning operations in unfamiliar areas or at
page display. Uncompleted entries will be cleared (can-
extreme conditions. The data may also be
celled). Selection of the PERF label at any time during un-
used in flight, to establish unit or area stand-
completed entries will clear (cancel) any uncompleted en-
ing operating procedures, and to inform
tries and return the format to the MENU page. All data
ground commanders of performance/risk
entries will be made through the keyboard inputs or
trade-offs.
loaded from the DTU.
Use or disclosure of this information is subject to the restriction(s) on the title page of this document.
Change 3
7A-1
TM 1-1520-251-10
a. CUR Button. The CUR perf mode selection dis-
plays current conditions. Performance data displayed in
the CUR perf mode reflect the anti - ice on or off condition
based on the current state of the anti - ice system. Buttons
that are not selectable in the CUR perf mode are:
• L1
PA button
• L2
FAT button
• L3
GWT button
b. MAX Button. The MAX perf mode selection dis-
plays projected performance indications in digital repre-
sentations according to the input of forecast data by the
aircrew through the DTU or Keyboard Unit (KU). Required
entries include: forecast PA, forecast FAT, and forecast
GWT.
c. PLAN Button. The PLAN perf mode selection
will provide the same information as MAX perf mode. The
PLAN information is loaded from either the DTU or the
Figure 7A-1. MPD PERF Page (MPD)
KU. The DTU is loaded through the AMPS. If the system
for automatic input fails, manual input can be accom-
plished through the PLAN perf mode.
The following selections are available on the PERF page
depending upon PERF MODE selection:
7A.2.2
Hover Torque
(HOVER Q) Status Win-
• T1
ENG button
dow. The current hover torque REQUIRED in percent
• T2
FLT button
per engine is indicated for both In Ground Effect (IGE) and
• T3
FUEL button
Out of Ground Effect (OGE) conditions based on the cur-
rent conditions of PA, FAT, and GWT. The current indi-
• T6
UTIL button
cated engine torque is displayed in a status window below
• L1
PA button
these digital readouts for real-time comparison. Indicated
• L2
FAT button
torque will be the greater of the two engines. The indi-
cated torque is displayed in color according to operating
• L3
GWT button
ranges as described for the ENG page. Go-No/Go torque
• B1
MENU button
is calculated on the maximum allowable dual engine
• B2
PERF MODE CUR button
gross weight (para 7A.2.4 ) and it is based on the 5 ft line.
• B3
PERF MODE MAX button
7A.2.3 CRUISE Status Window. The following items
• B4
PERF MODE PLAN button
are calculated based on the data of PA, FAT, and GWT.
• B5
HIT button
7A.2.1 PERF MODE. The PERF MODE controls the
a. Torque (Q) Status. The estimated torque is dis-
system calculations being accomplished and consists of
played as indicated percentage torque per engine for both
three modes of operation, Current (CUR), Maximum
the maximum range (RNG) and maximum endurance
(MAX), and PLAN. Each mode has page buttons, data
(END) based on the current conditions of PA, FAT, and
fields, and control buttons, some of which are not dis-
GWT. Range for torque estimate will be from 20 to 100%,
played under certain conditions.
in 1% increments.
Use or disclosure of this information is subject to the restriction(s) on the title page of this document.
7A-2
Change 3
TM 1-1520-251-10
b. Fuel Flow (FF) Status. The estimated fuel flow
the speed in kts when wind speed is greater than 5 knots,
will be displayed in total pounds per hour for both engines.
otherwise, the label “CALM” is displayed. When NR is less
It will be displayed for both maximum range (RNG) and
than 50% and wind speed is greater than 45 knots, wind
maximum endurance (END) based on the current condi-
speed is displayed in YELLOW.
tions of PA, FAT, and GWT. Range will be from 400 to
• Range for direction: 1 to 360° in 1° increments.
1,400 lb/hr in 10 lb increments.
•
Range for wind speed: 0 to 99 knots
in 1 knot increments.
7A.2.4 Maximum Gross Weight (MAX GWT) Status
Window. The maximum allowable gross weight for the
NOTE
conditions of PA, FAT, and torque available will be given in
pounds. The maximum gross weight readout is displayed
Forward CG will not be displayed forward of
in YELLOW when exceeded by the current aircraft gross
201.0
weight (GWT). Gross weight range will be 11,000 to
7A.2.8 Center of Gravity (CG) Status. The forward
23,000 lbs in 10 lb increments. Weights will be for Dual
and aft CG limits are displayed along the horizontal bar in
Engine (DE), Single Engine (SE), for both IGE hover or
the CUR perf mode. The actual CG will be displayed un-
OGE hover.
der CG and a vertical bar will move horizontally along the
line in direct proportion to the actual CG. The horizontal
7A.2.5 True Airspeed (TAS) Status Window. The cur-
bar can be displayed off the page such that it cannot be
rent TAS parameters and limitations will be indicated in
seen. This happens at a CG of 207.8
knots based on the current conditions of PA, FAT, and
GWT. Parameters will include TAS velocity not to exceed
7A.2.9 Weight (WT) Button. The WT button is used to
(VNE), minimum TAS to maintain safe single engine
call up the weight data entry buttons. This button is dis-
(VSSE) flight, TAS at which the aircraft should cruise in or-
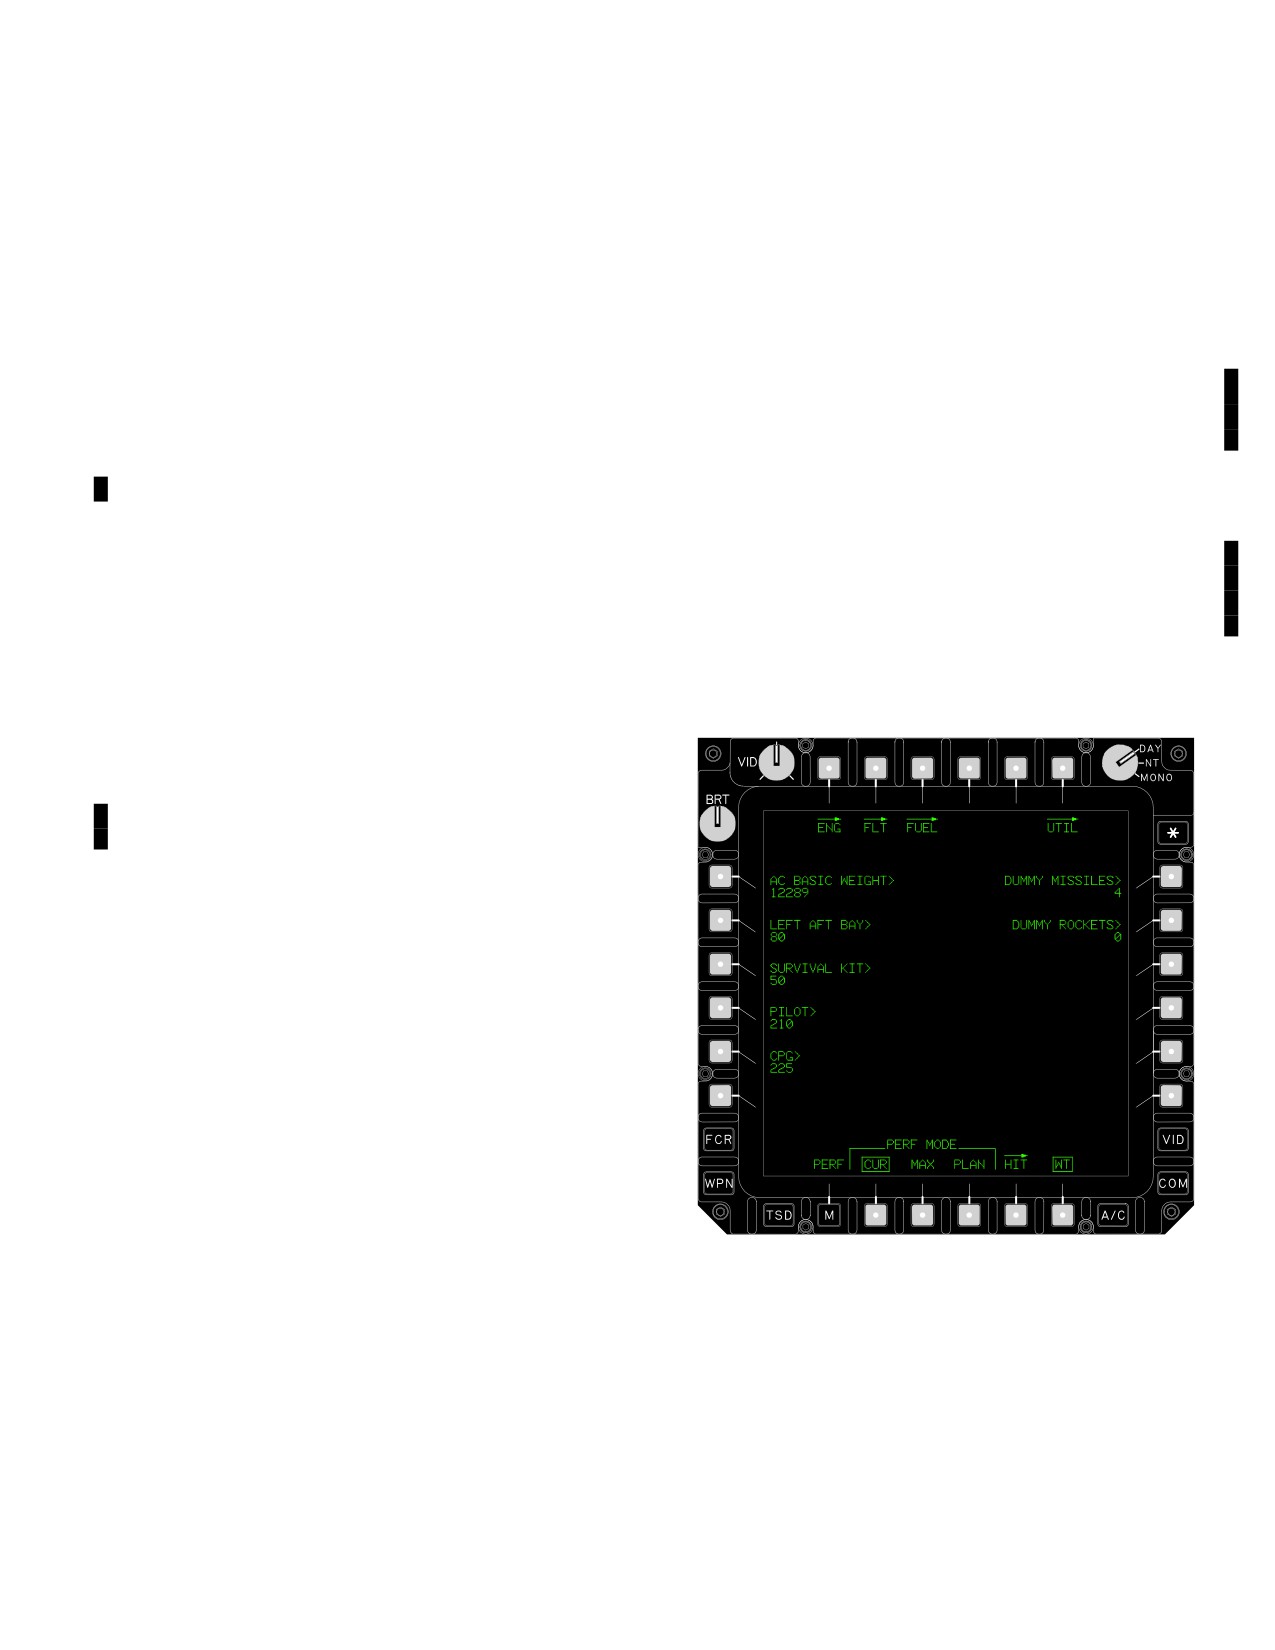
played only in the CUR mode (Figure 7A-2).
der to attain maximum RNG, and TAS at which the aircraft
should cruise in order to attain the maximum fuel END or
rate of climb. TAS range is from 0 through 250 kts in 1 kt
increments. See Airspeed Limits (Chapter 5, Section V)
for specific values
7A.2.6 Maximum Torque (MAX Q) Status Window. The
current engine MAX Q available (30 minute limit) in percent
per engine for DE and SE operation is indicated based on
the current conditions of PA, FAT, and GWT. MAX Q avail-
able range is from 0 to 130% in 1% increments. The current
engine MAX Q available in percent per engine for DE and
SE operation is indicated based on the current conditions of
PA, FAT, and GWT. Digital readouts indicate the actual max-
imum torque available derived from dual engine 10 minute
limit and single engine 2.5 minute limit chart data. Readouts
are displayed in color according to dual and single engine
torque limits:
DE
0-100 GREEN
101 - 115 YELLOW
>115 RED
LBA3030
SE
Figure
7A-2. PERF Page with WT Selected
0-110 GREEN
• L1
AC BASIC WT/MOMENT button
111 - 125 YELLOW
• L2
LEFT AFT BAY button
>125 RED
MAX Q available range is from 0 to 130% in 1% incre-
• L3
SURVIVAL KIT button
ments.
• L4
PILOT button
• L5
CPG button
7A.2.7 WIND Status Window. The WIND condition will
• R1
DUMMY MISSILES button
be displayed in the CUR perf mode to indicate direction
(heading in degrees) from which the wind is coming and
• R2
DUMMY ROCKETS button
Use or disclosure of this information is subject to the restriction(s) on the title page of this document.
Change 3
7A-3
TM 1-1520-251-10
a. AC BASIC WT/MOMENT Button. The AC BA-
e. CPG Button. The CPG button is used for manu-
SIC WEIGHT data entry button is used for manual entry of
al entry of weight for the CPG when data from the DTC
basic weight/moment when data from the DTC and/or de-
and/or default pilot weight is not accurate. This button is
fault basic weight/moment is not accurate. This button is
displayed only when the WT button is selected. The bot-
displayed only when the WT button is selected. The bot-
tom mode of this button will indicate the CPG weight cur-
tom mode of this button indicates the aircraft basic weight
rently being used by the system for performance calcula-
or moment currently being used by the system for perfor-
tions. It is displayed in WHITE when it is the powerup
mance calculations. These values are stored in memory
default value (235 lbs).
and will be updated only when weight data is uploaded
from the DTC. A default value is only used during the first
f. DUMMY MISSILES Button. The DUMMY MIS-
initialization of the SP or when the weight data in memory
SILES button is used to manually enter the number of
is corrupted. The button is displayed in WHITE when the
“dummy missiles” (M34) loaded on the wing store HF
default value is being used. The default value for aircraft
launchers. This button is displayed only when the WT but-
with a - 701 engine without a FCR is 12,275 lbs; the de-
ton is selected. The range value entry is from 0 to 16 mis-
fault value for aircraft with a - 701C engine with a FCR is
siles. Dummy missiles are not detectable by the system
12,836 lbs. Upon completion of the basic weight entry, the
and, as such, are not accounted for in aircraft gross
button will reconfigure to the MOMENT data entry. Once
weight calculations. This data entry is used by the SP to
both the AC BASIC WEIGHT and MOMENT data entries
include the weight of dummy missiles in gross weight cal-
are complete, the data will be sent to the SP and the but-
culations. The value is stored in memory and will be up-
ton will reconfigure to the AC BASIC WEIGHT data entry.
dated only when manually entered.
b. LEFT AFT BAY Button. The LEFT AFT BAY
g. DUMMY ROCKETS Button. The DUMMY
button is used for manual entry of weight in the left aft bay
ROCKETS button is used to manually enter the number of
when data from the DTC and/or default left aft bay weight
“dummy rockets” loaded in the wing store rocket launch-
is not accurate. This button is displayed only when the WT
ers. This button is displayed only when the WT button is
button is selected. The bottom mode of this button will in-
selected. The range value entry is from 0 to 76 rockets.
dicate the left aft bay weight currently being used by the
Dummy rockets are not detectable by the system and, as
system for performance calculations. It is displayed in
such, are not accounted for in aircraft gross weight cal-
WHITE when it is the powerup default value (0 lbs).
culations. This data entry is used by the SP to include the
weight of dummy rockets in gross weight calculations.
c. SURVIVAL KIT Button. The SURVIVAL KIT
The value is stored in memory and will be updated only
button is used for manual entry of weight in the survival kit
when manually entered.
bay when data from the DTC and/or default survival kit
bay weight is not accurate. This button is displayed only
7A.3 ETF PAGE
when the WT button is selected. The bottom mode of this
button will indicate the survival kit bay weight currently be-
ing used by the system for performance calculations. It is
The engine torque factor (ETF) page is used to perform
displayed in WHITE when it is the powerup default value
the maximum power check for the 701C engine. The pur-
(0 lbs).
pose of this check is to determine the ETF for each en-
gine. The torque factor method of performing the maxi-
d. PILOT Button. The PILOT button is used for
mum power check provides an accurate indication of
manual entry of weight for the pilot when data from the
available power by incorporating ambient temperature ef-
DTC and/or default pilot weight is not accurate. This but-
fects into the power available calculation. The intent of the
ton is displayed only when the WT button is selected. The
ETF is to provide the system a numerical health value
bottom mode of this button will indicate the pilot weight
upon which performance computations can be derived us-
currently being used by the system for performance cal-
ing performance algorithms and tables within the system
culations. It is displayed in WHITE when it is the powerup
processors. This maintenance procedure is described in
default value (235 lbs).
TM 1 - 2840 - 248 - 23.
Use or disclosure of this information is subject to the restriction(s) on the title page of this document.
7A-4
Change 4
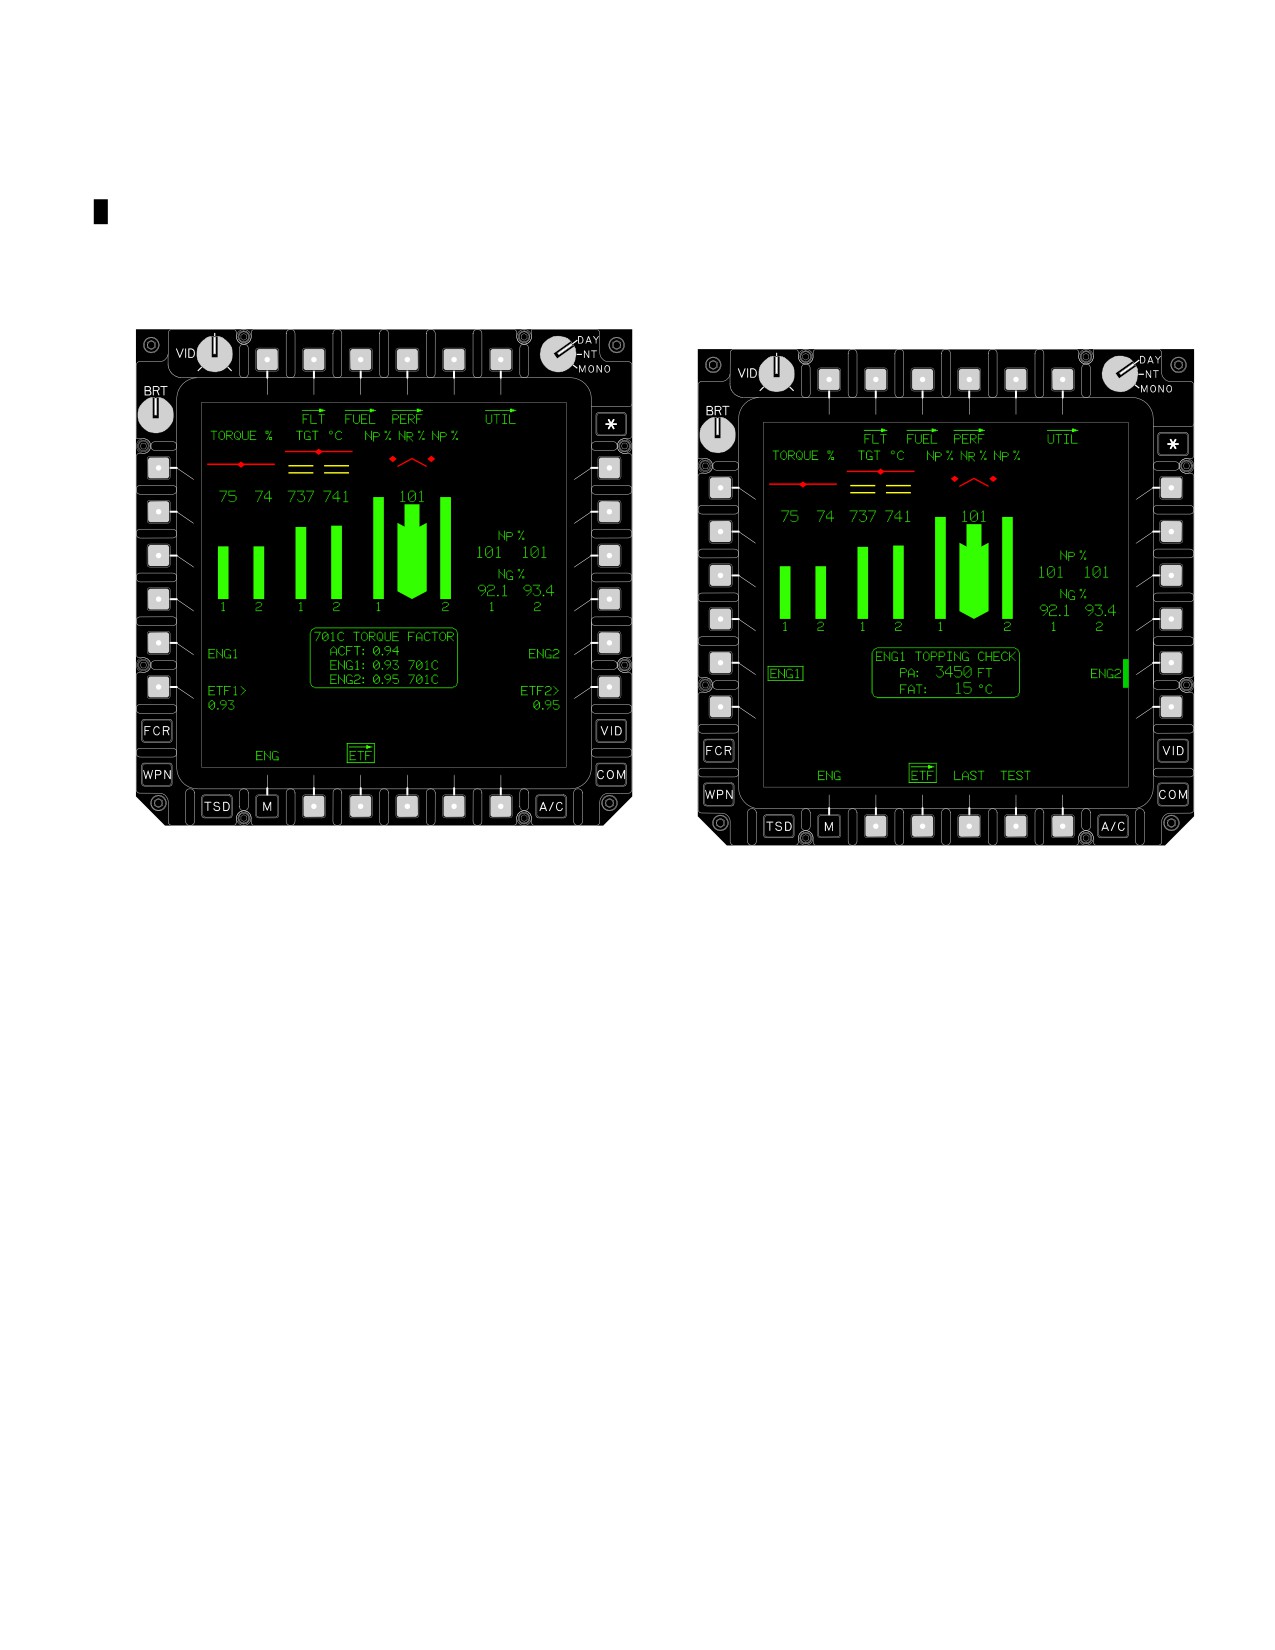
TM 1-1520-251-10
Selecting the ETF page button (B3) displays the ETF
power check. Selecting the ENG1 or ENG2 button sets
page with the button controls necessary to initiate the
the system for a maximum power check and then displays
power check and the 701C TORQUE FACTOR status
the TOPPING CHECK status window for the selected en-
window which contains current ETF/ATF values; aircraft
gine; pressure altitude (PA) and free air temperature
(ACFT), engine 1 (ENG1), and engine 2 (ENG2)
(FAT). This selection also displays the LAST and TEST
(fig 7A-3).
buttons at the bottom of the format
(fig 7A-4).
LBA3031
LBA3032
Figure 7A-3. ETF Page
Figure 7A-4. ENG1 Selected
The following selections are available on the ETF page:
7A.3.2 LAST Topping Check Button. The LAST but-
ton (B4) is used to call up the last test results. Selecting
• T2
FLT button
the LAST button displays the LAST TOPPING CHECK
• T3
FUEL button
status window which contains a list of engine and ambient
• T4
PERF button
conditions of the last maximum power check performed
on the selected engine (fig 7A-5):
• T6
UTIL button
• L5
ENG1 button
• date (MM/DD/YY)
• L6
ETF1 button
• engine TORQUE
• R5
ENG2 button
• Target Torque Value (TTV)
• R6
ETF2 button
• indicated airspeed (IAS)
• engine TGT, NG, and NP
• B3
ETF button
• PA and FAT
7A.3.1 Engine 1 and 2 Buttons. The ENG1 and ENG2
buttons are used to select an engine for the maximum
Use or disclosure of this information is subject to the restriction(s) on the title page of this document.
Change 4
7A-5
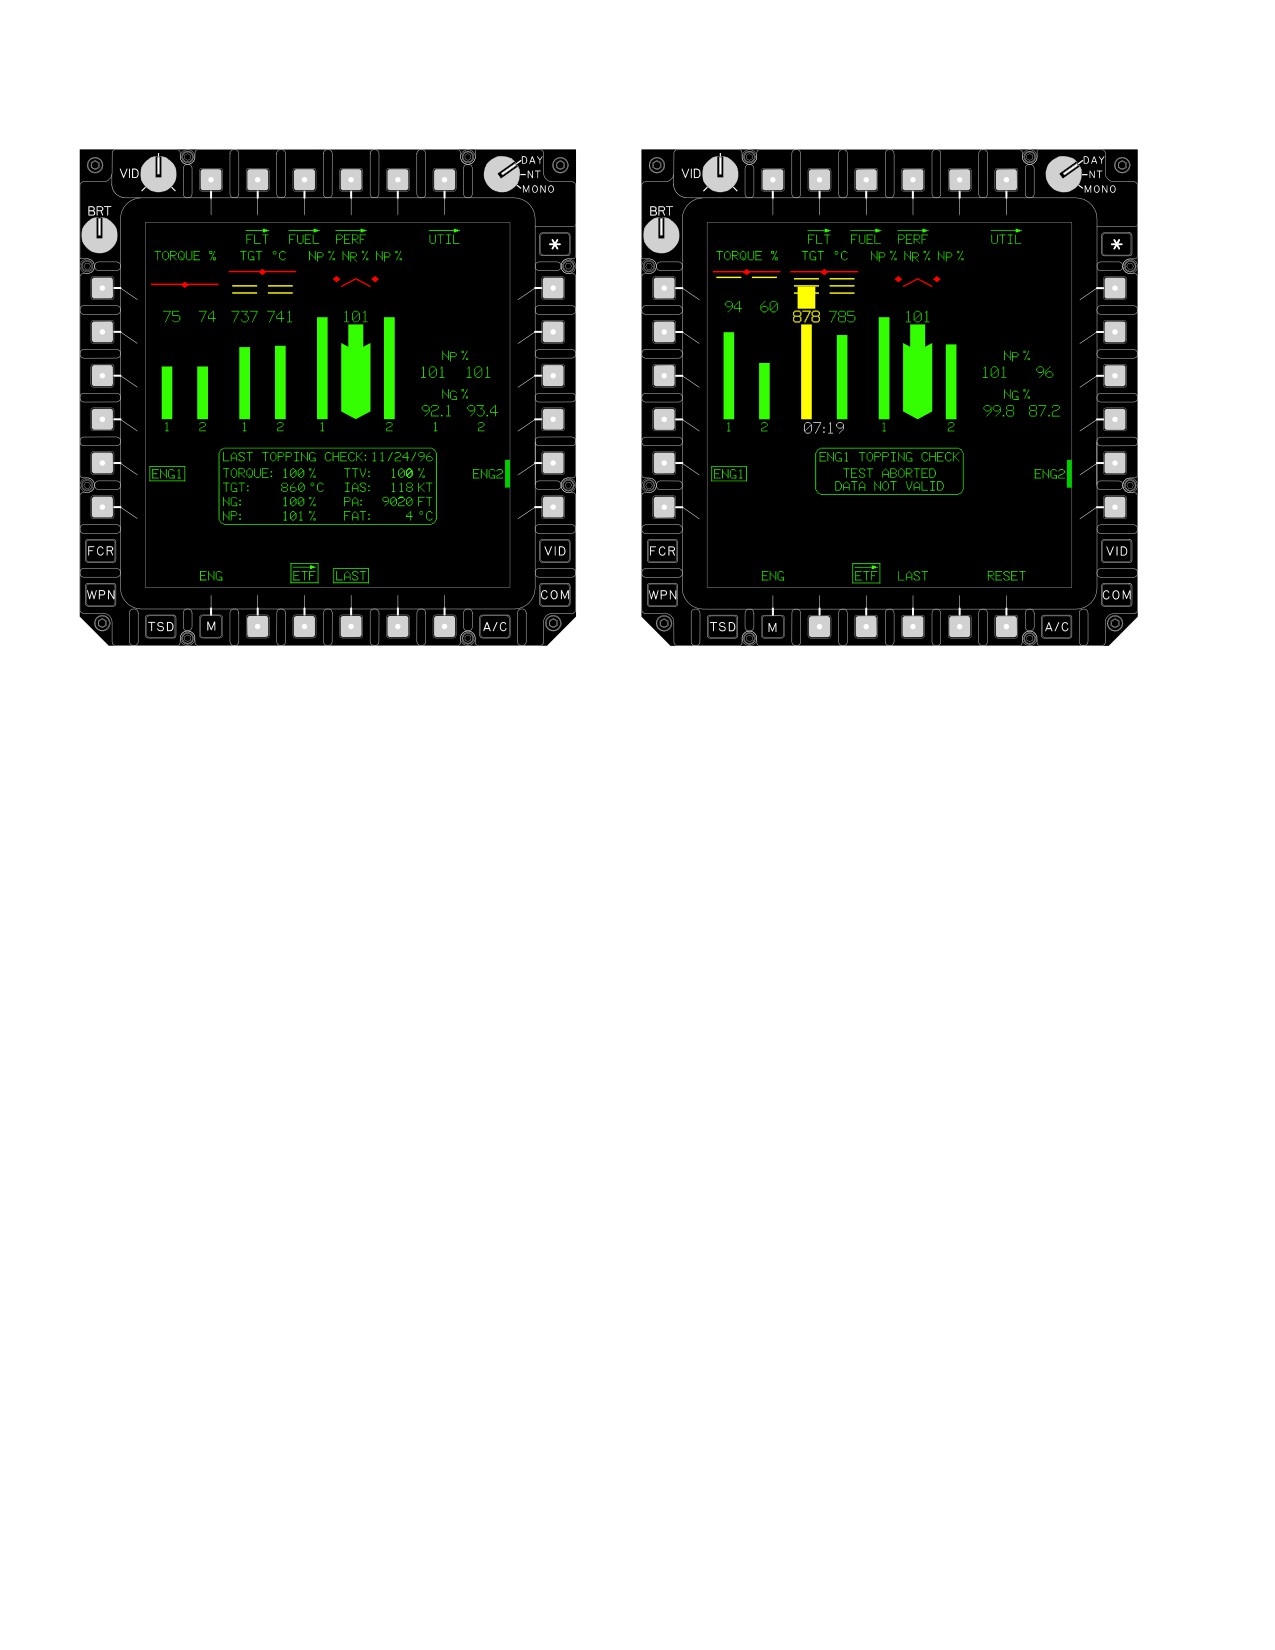
TM 1-1520-251-10
LBA3033A
LBA5255
Figure 7A-6. Test Aborted Indication
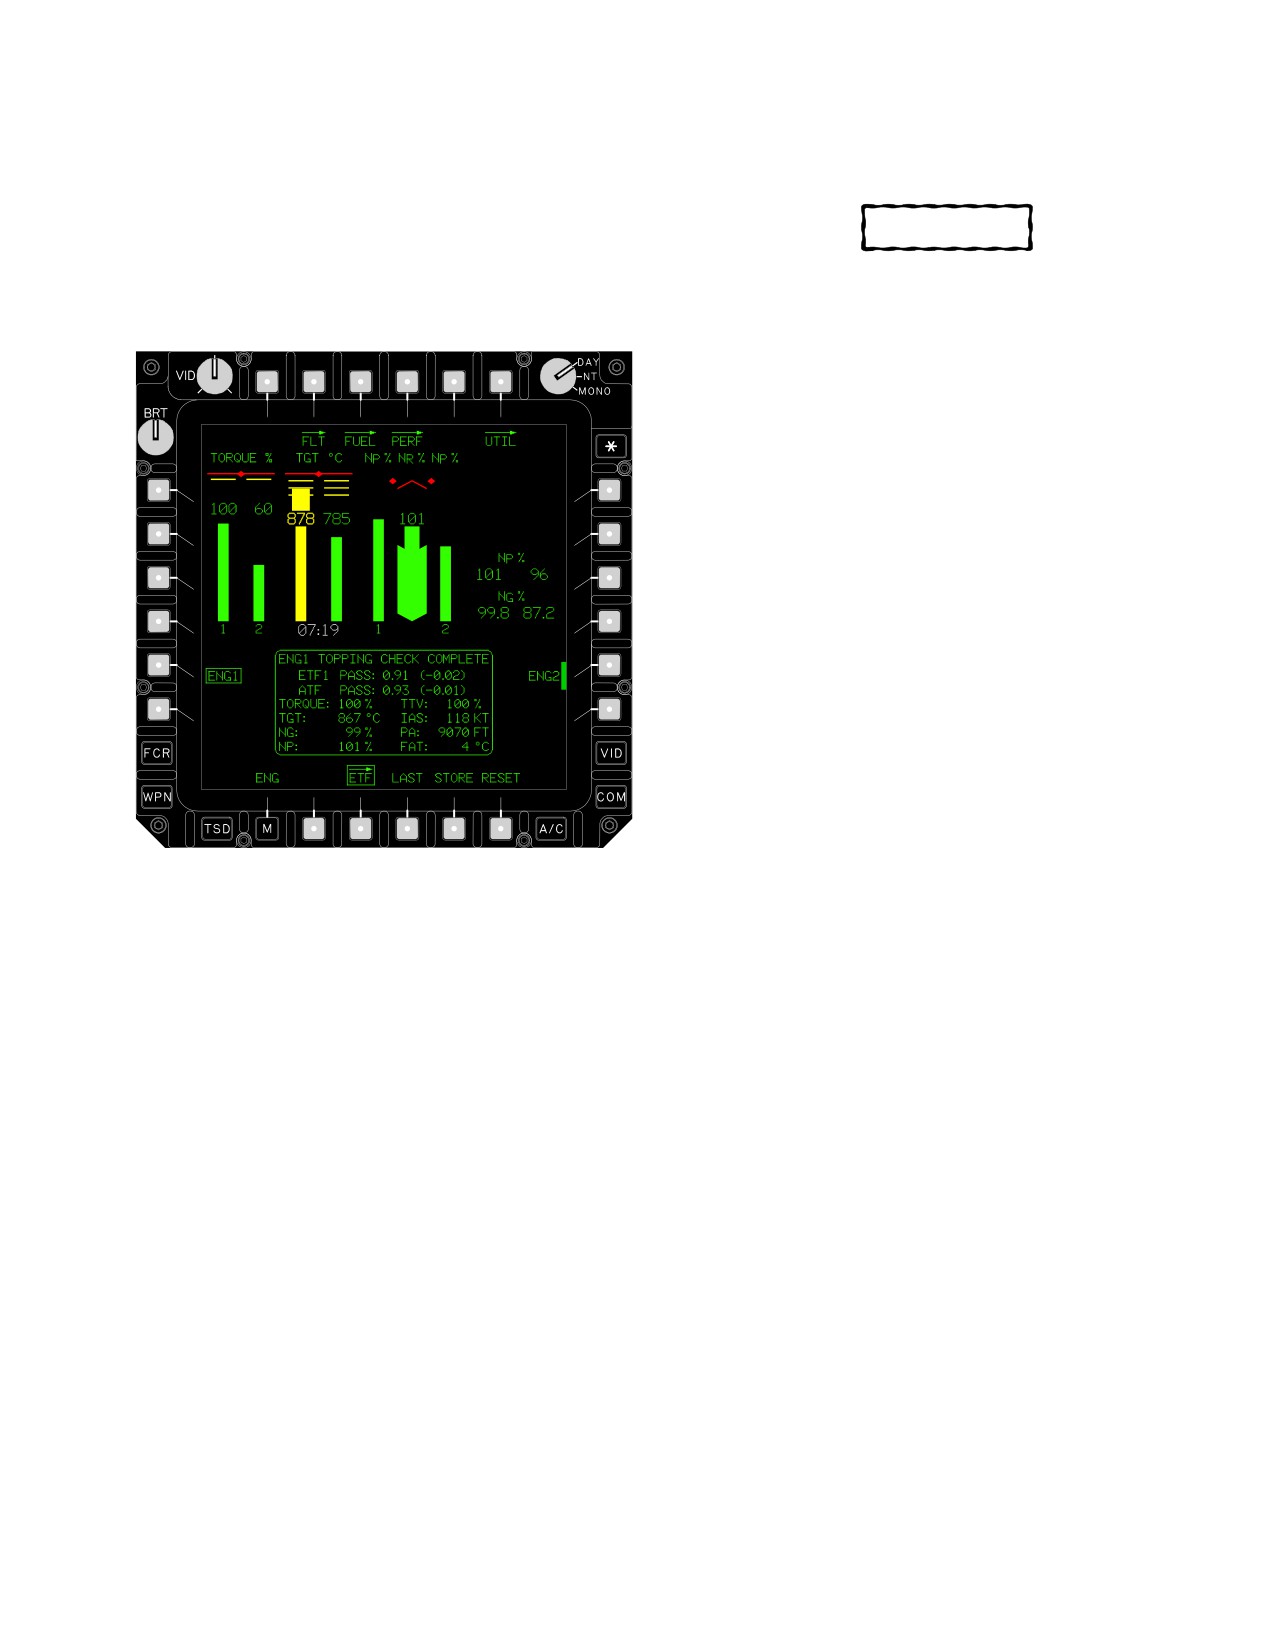
b. Test Complete Indication. A completed test will
Figure 7A-5. LAST Selected
display the STORE and RESET buttons (B5, B6) and the
ENG1 or ENG2 TOPPING CHECK TEST COMPLETE
status window which contains current data for a valid test
performed on the selected engine (fig 7A-7):
7A.3.3 Engine TEST Button. The TEST button (B5) is
used to initiate a test once flight parameters are achieved.
• ETF1 or ETF2 PASS/FAIL indication with ETF
Selecting the TEST button commands the SP to perform
value and difference value from last check
power check calculations to derive the ETF for the se-
• ATF1 or ATF2 PASS/FAIL indication with ATF
lected engine. Results of the test are displayed as either
value and difference value from last check
the TOPPING CHECK ABORTED status window (fig
7A-6) or the TOPPING CHECK COMPLETE status win-
• Engine TORQUE, Target Torque Value (TTV),
dow (fig 7A-7).
indicated airspeed (IAS), engine TGT, NG, and NP,
PA and FAT
a. Test Aborted Indication. An aborted test will
7A.3.4 STORE Button. The power check STORE but-
display the RESET button (B6) and the ENG1 or ENG2
ton (B5) is used to store the test values. Selecting the
TOPPING CHECK TEST ABORTED, DATA NOT VALID
STORE button commands the SP to store test data for the
status window which is displayed to provide an indication
selected engine in non - volatile memory and in the main-
that the engine test was aborted due to invalid data (fig
tenance data recorder (MDR). In addition, this selection
7A-6).
returns the format to the top level ETF page.
Use or disclosure of this information is subject to the restriction(s) on the title page of this document.
7A-6
TM 1-1520-251-10
7A.3.5 RESET Button. The power check RESET but-
7A.5 LIMITS
ton (B6) is provided as an alternative to storing test data.
Selecting the RESET button returns the format to the for-
CAUTION
mer state (prior to performing the test).
Exceeding operational limits can cause
permanent damage to critical compo-
nents and can decrease performance,
cause immediate failure, or failure on a
subsequent flight.
Applicable limits are shown on the charts as bold lines.
Performance generally deteriorates rapidly beyond limits.
If limits are exceeded, minimize the amount and time. En-
ter the maximum value and time beyond limits on DA
Form 2408-13-1 so proper maintenance action can be
taken.
7A.6 USE OF CHARTS
7A.6.1 Chart Explanation. The first page of each sec-
tion describes the chart or charts in that section, and ex-
plains how each chart is used.
7A.6.2 Reading the Charts. The primary use of each
chart is given in the example and a guideline is provided to
help you follow the route through the chart. The use of a
straight edge (ruler or page edge) and a hard fine-point
pencil is recommended to avoid cumulative errors. The
LBA3035A
majority of the charts provide a standard pattern for use as
follows: Enter first variable on top left scale, move right to
second variable, deflect down at right angles to third vari-
able, deflect left at right angles to fourth variable, and de-
flect down, etc., until final variable is read out at final
Figure
7A-7.
Test Complete Indication
scale. In addition to the primary use, other uses of each
chart are explained in the text accompanying each set of
performance charts. Correct operating limits can also be
found in Chapter 5. Abbreviations and symbols used in
7A.4
PERFORMANCE DATA - GENERAL
the charts are listed in Appendix B.
NOTE
The data presented covers the maximum range of condi-
An example of an auxiliary use of the per-
tions and performance that can reasonably be expected.
formance charts follows: Although the hover
In each area of performance, the effects of altitude, tem-
chart is primarily arranged to find the torque
perature, gross weight and other parameters relating to
required to hover, maximum wheel height
that phase of flight are presented. In addition to the pres-
for hover can also be found by entering
ented data, judgment and experience will be necessary to
torque available as torque required. In gen-
accurately determine performance under a given set of
eral, any single variable can be found if all
circumstances. The conditions for the data are listed un-
others are known. Also, the trade-offs be-
der the title of each chart. The effects of different condi-
tween two variables can be found. For ex-
tions are discussed in the text accompanying each phase
ample, at a given density altitude and pres-
of performance. Where practical, data is presented at
sure altitude, you can find the maximum
conservative conditions. However, NO GENERAL CON-
gross weight capability as free air tempera-
SERVATISM HAS BEEN APPLIED.
ture changes.
Use or disclosure of this information is subject to the restriction(s) on the title page of this document.
7A-7
TM 1-1520-251-10
7A.7 SPECIFIC CONDITIONS
7A.8.5 Configurations. Except as otherwise noted, all
data is for the primary mission configuration consisting of
The data presented is accurate only for specific conditions
the basic helicopter configured with Aircraft Survival
listed under the title of each chart. Variables for which data
Equipment (ASE) plus a pylon and a fully loaded hellfire
is not presented, but which may affect that phase of per-
missile launcher on each inboard stores station, and no
formance, are discussed in the text. Where data is avail-
pylons or stores on outboard stations.
able or reasonable estimates can be made, the amount
that each variable affects performance is given.
7A.9 PERFORMANCE DISCREPANCIES
7A.8 GENERAL CONDITIONS
Regular use of this chapter will also allow monitoring in-
struments and other helicopter systems for malfunction,
In addition to the specific conditions, the following general
by comparing actual performance with planned perform-
conditions are applicable to the performance data:
ance. Knowledge will also be gained concerning the ef-
fects of variables for which data is not provided, thereby
7A.8.1 Rigging. All airframe and engine controls are
increasing the accuracy of performance predictions.
assumed to be rigged within allowable tolerances.
7A.10 TEMPERATURE CONVERSION
7A.8.2 Pilot Technique. Normal pilot technique is as-
sumed. Control movements should be smooth and contin-
A temperature conversion chart (fig 7A-8) is included in
uous.
the section for the purpose of converting Fahrenheit (F)
temperatures to Celsius (C).
7A.8.3 Aircraft Variation. Variations in performance
between individual helicopters are known to exist. The
7A.11 ABBREVIATIONS
majority of variation can be accounted for through the use
of Engine Torque Factors and Aircraft Torque Factors.
Appendix B is a list of abbreviations and symbols used on
the charts in this chapter, as well as throughout the entire
7A.8.4 Instrument Variation. The data shown in the
operators manual. For units of measure, the same abbre-
performance charts does not account for instrument inac-
viation applies to either the singular or plural form of the
curacies or malfunctions.
unit.
Use or disclosure of this information is subject to the restriction(s) on the title page of this document.
7A-8
TM 1-1520-251-10
TEMPERATURE CONVERSION
FAHRENHEIT/CELSIUS
TEMPERATURE °F
TEMPERATURE °C
EXAMPLE
140
60
WANTED
120
CONVERTED °F TO °C
40
100
KNOWN
TEMPERATURE = 50 °F
80
METHOD
20
ENTER FAHRENHEIT
60
TEMPERATURE AT 50 °F
READ CONVERTER CELSIUS
40
TEMPERATURE = 10 °C
0
METHOD MAY BE REVERSED
TO FIND FAHRENHEIT WHEN
20
CELSIUS IS KNOWN
0
−20
−20
−40
−40
−60
−60
−80
LBA1812
Figure
7A-8.
Temperature Conversion Chart
Use or disclosure of this information is subject to the restriction(s) on the title page of this document.
7A-9
TM 1-1520-251-10
Section II. MAXIMUM TORQUE AVAILABLE
7A.12 DESCRIPTION
of either the 30-minute chart, 10-minute chart, or the
2.5-minute chart at the known FAT and move right to the
The maximum torque available charts (figs 7A-9 and
known pressure altitude, and then move down and read
7A-10) show the maximum torque available per engine for
the maximum torque available. This is torque per engine.
30-minute operation and 10-minute operation at various
For dual-engine operation, if the torque per engine ex-
conditions of pressure altitude and Free Air Temperature
ceeds the two-engine limit, the maximum torque available
(FAT). Both single and dual-engine operation limits are
must be reduced to the two-engine limit.
shown.
Figure 7A-11 shows the maximum torque available for
2.5-minute operation when one engine is inoperative; only
7A.14 CONDITIONS
single engine operation limits are shown.
The torque factor charts (figs 7A-12 and 7A-13) provide
an accurate indication of available power for the engines
These charts are based on 101% rotor rpm, zero air-
installed in each individual aircraft.
speed, JP-8 fuel and ENG INLET ANTI-ICE system OFF.
With ENG INLET ANTI-ICE system ON, available torque
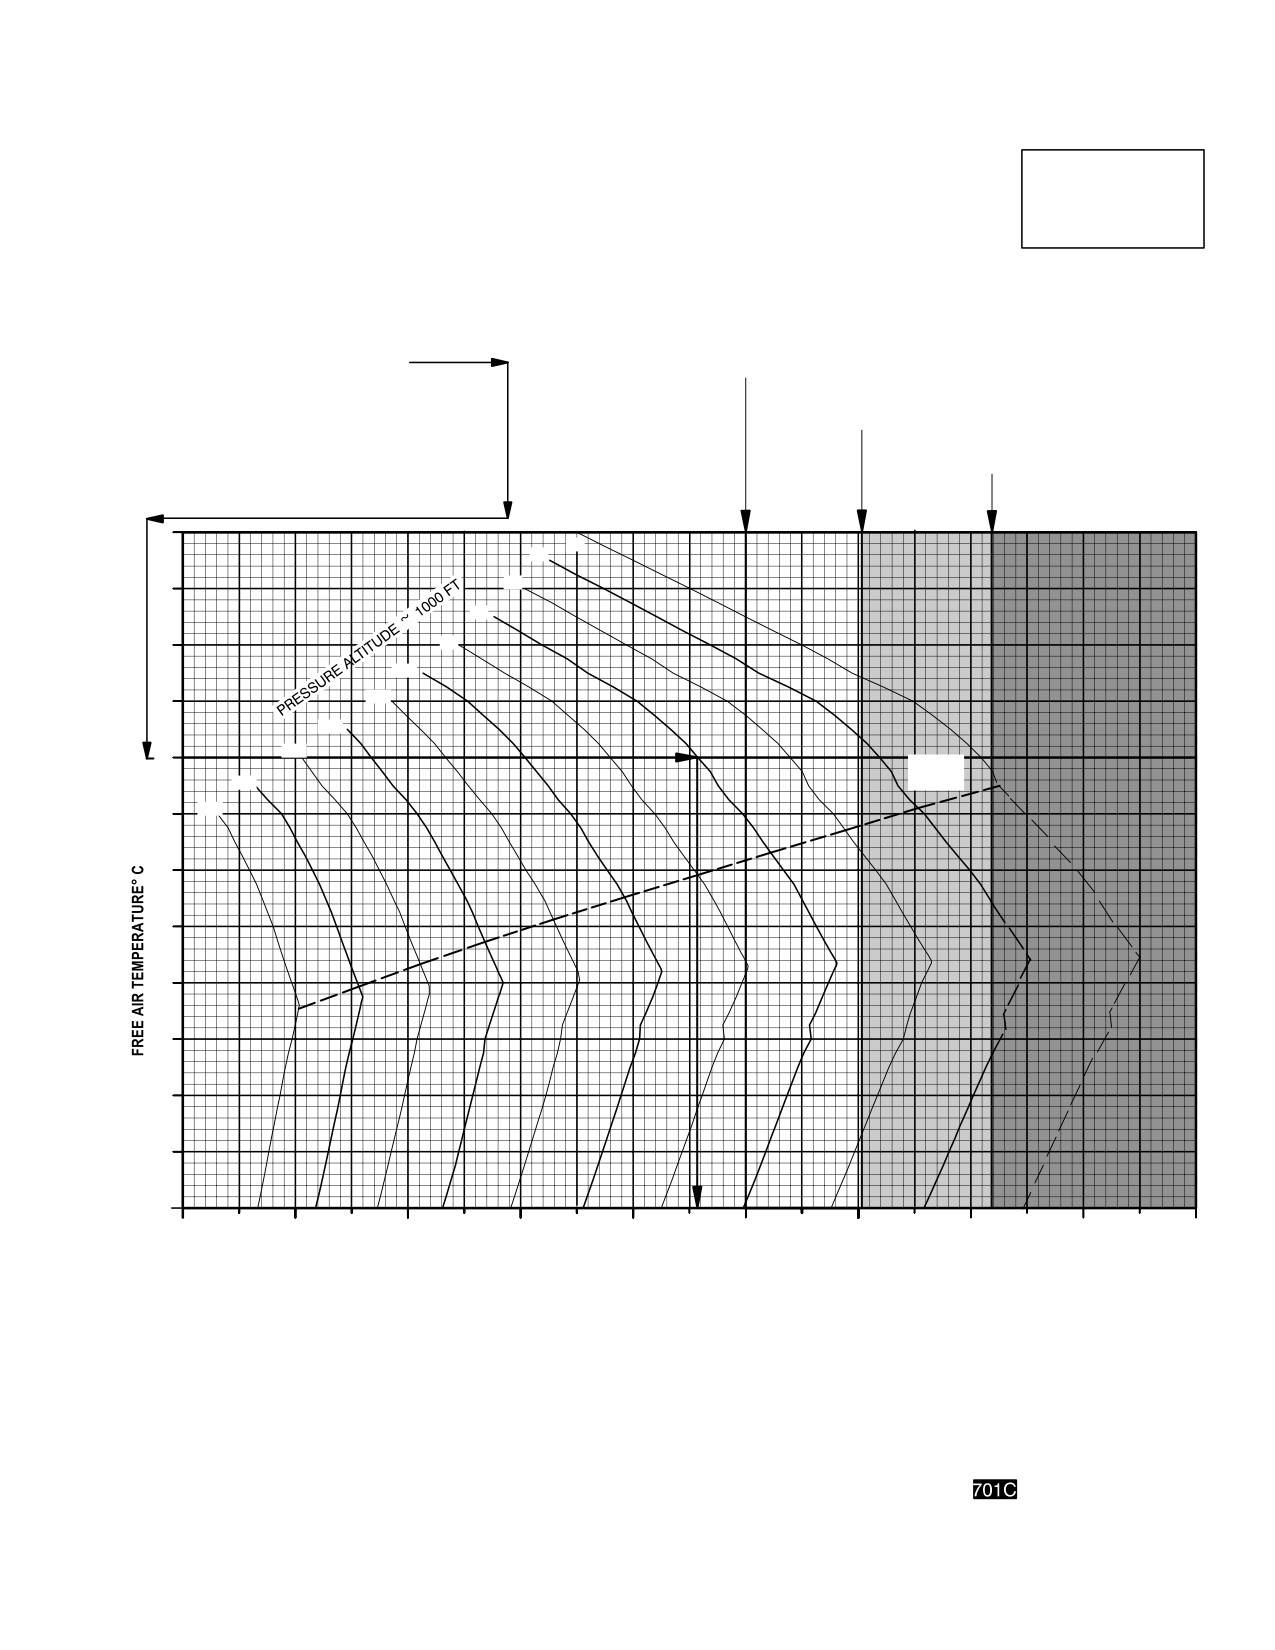
7A.13 USE OF CHARTS
is reduced by as much as 20.4% for 30-minute operation
The primary use of the charts is illustrated by the example.
and 19.2% for 10-minute operation. For example, if the
To determine the maximum torque available, it is neces-
value from the 30-minute chart is 90%, with ANTI-ICE ON,
sary to know pressure altitude and FAT. Enter the left side
torque available would be 90 - 20.4 = 69.6%.
Use or disclosure of this information is subject to the restriction(s) on the title page of this document.
7A-10
TM 1-1520-251-10
MAXIMUM TORQUE
MAXIMUM TORQUE AVAILABLE
AVAILABLE/IRP
EXAMPLE
30MIN LIMIT, 101% NR, ANTIICE OFF
AH64D
WANTED
T700GE701C
TORQUE AVAILABLE
ZERO AIRSPEED
30MIN LIMIT.
KNOWN
FAT = +20 °C.
PRESSURE ALTITUDE = 6000 FT.
METHOD
CONTINUOUS TORQUE
ENTER AT KNOWN FAT = +20 °C.
LIMIT 2ENGINE
MOVE RIGHT TO PRESSURE ALTITUDE
= 6000 FT. THEN MOVE DOWN
CONTINUOUS TORQUE
TO READ 95.7% TORQUE AVAILABLE
LIMIT 1ENGINE
PER ENGINE. THIS DOES NOT EXCEED
2.5MINUTE
2ENGINE RED LINE. FOR DUALENGINE
LIMIT 1ENGINE
OPERATION, TORQUE IS LIMITED
TO 100% PER ENGINE.
60
0
2
4
50
6
40
8
10
30
12
14
16
20
STD
18
TEMP
20
10
0
10
20
30
40
50
60
50
60
70
80
90
100
110
120
130
140
TORQUE AVAILABLE PER ENGINE %
DATA BASIS: CALCULATED FROM ENGINE MODEL SPEC NO. E1290, 15 APRIL 1988
LBA0153
Figure 7A-9. Maximum Torque Available Chart - 30 - Minute Limit
Use or disclosure of this information is subject to the restriction(s) on the title page of this document.
7A-11
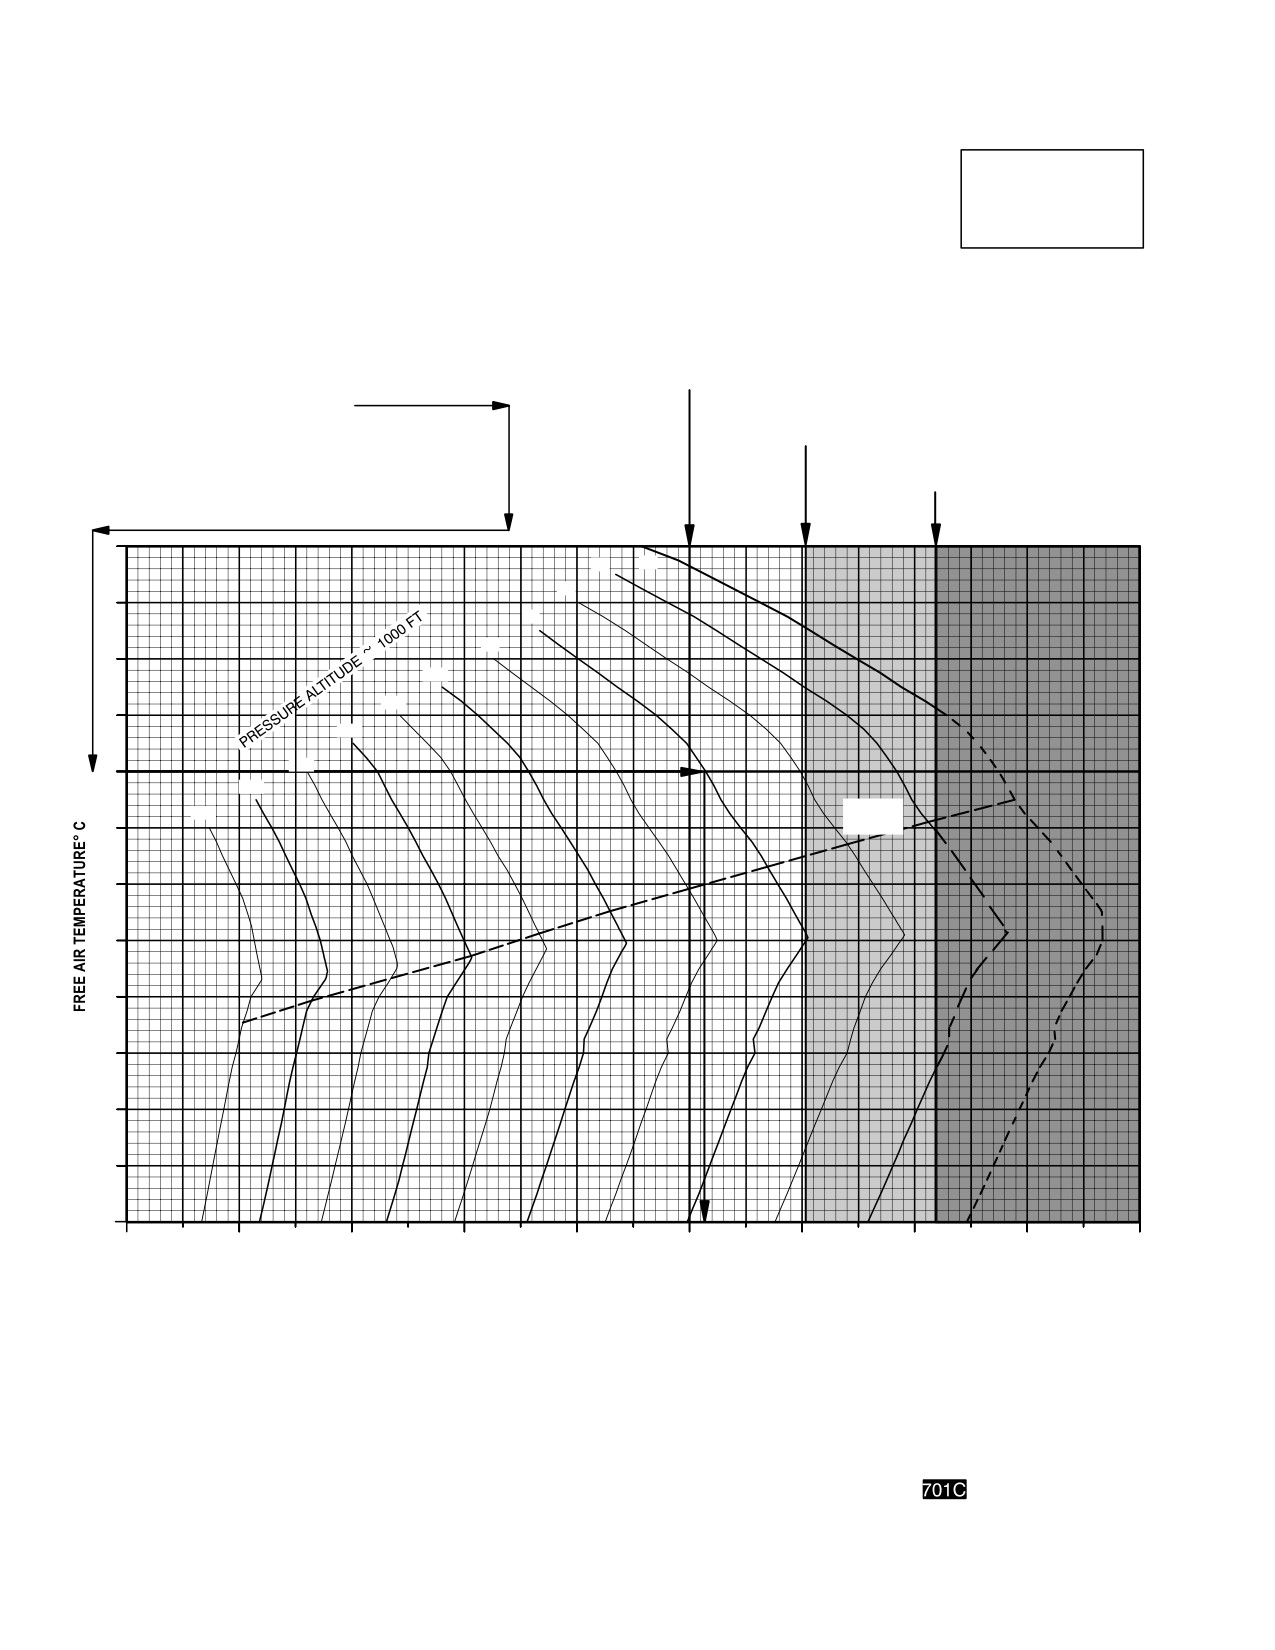
TM 1-1520-251-10
MAXIMUM TORQUE AVAILABLE
MAXIMUM TORQUE
AVAILABLE/MRP
10MIN LIMIT, 101% NR, ANTIICE OFF
AH64D
ZERO AIRSPEED
T700GE701C
EXAMPLE
WANTED
TORQUE AVAILABLE
10MIN LIMIT.
KNOWN
FAT= +20 °C.
PRESSURE ALTITUDE = 6000 FT.
CONTINUOUS TORQUE
LIMIT 2ENGINE
METHOD
ENTER AT KNOWN FAT = +20 °C.
CONTINUOUS TORQUE
MOVE RIGHT TO PRESSURE ALTITUDE
LIMIT 1ENGINE
= 6000 FT. THEN MOVE DOWN
TO READ 101.4% TORQUE AVAILABLE
2.5MINUTE
PER ENGINE. HOWEVER, FOR DUALENGINE
LIMIT 1ENGINE
OPERATION, TORQUE IS LIMITED TO 100%
PER ENGINE.
60
2
0
4
50
6
8
40
10
12
30
14
16
20
18
20
STD
10
TEMP
0
10
20
30
40
50
60
50
60
70
80
90
100
110
120
130
140
TORQUE AVAILABLE PER ENGINE %
DATA BASIS: CALCULATED FROM ENGINE MODEL SPEC NO. E1290, 15 APRIL 1988
LBA0152
Figure 7A-10. Maximum Torque Available Chart - 10 - Minute Limit
Use or disclosure of this information is subject to the restriction(s) on the title page of this document.
7A-12
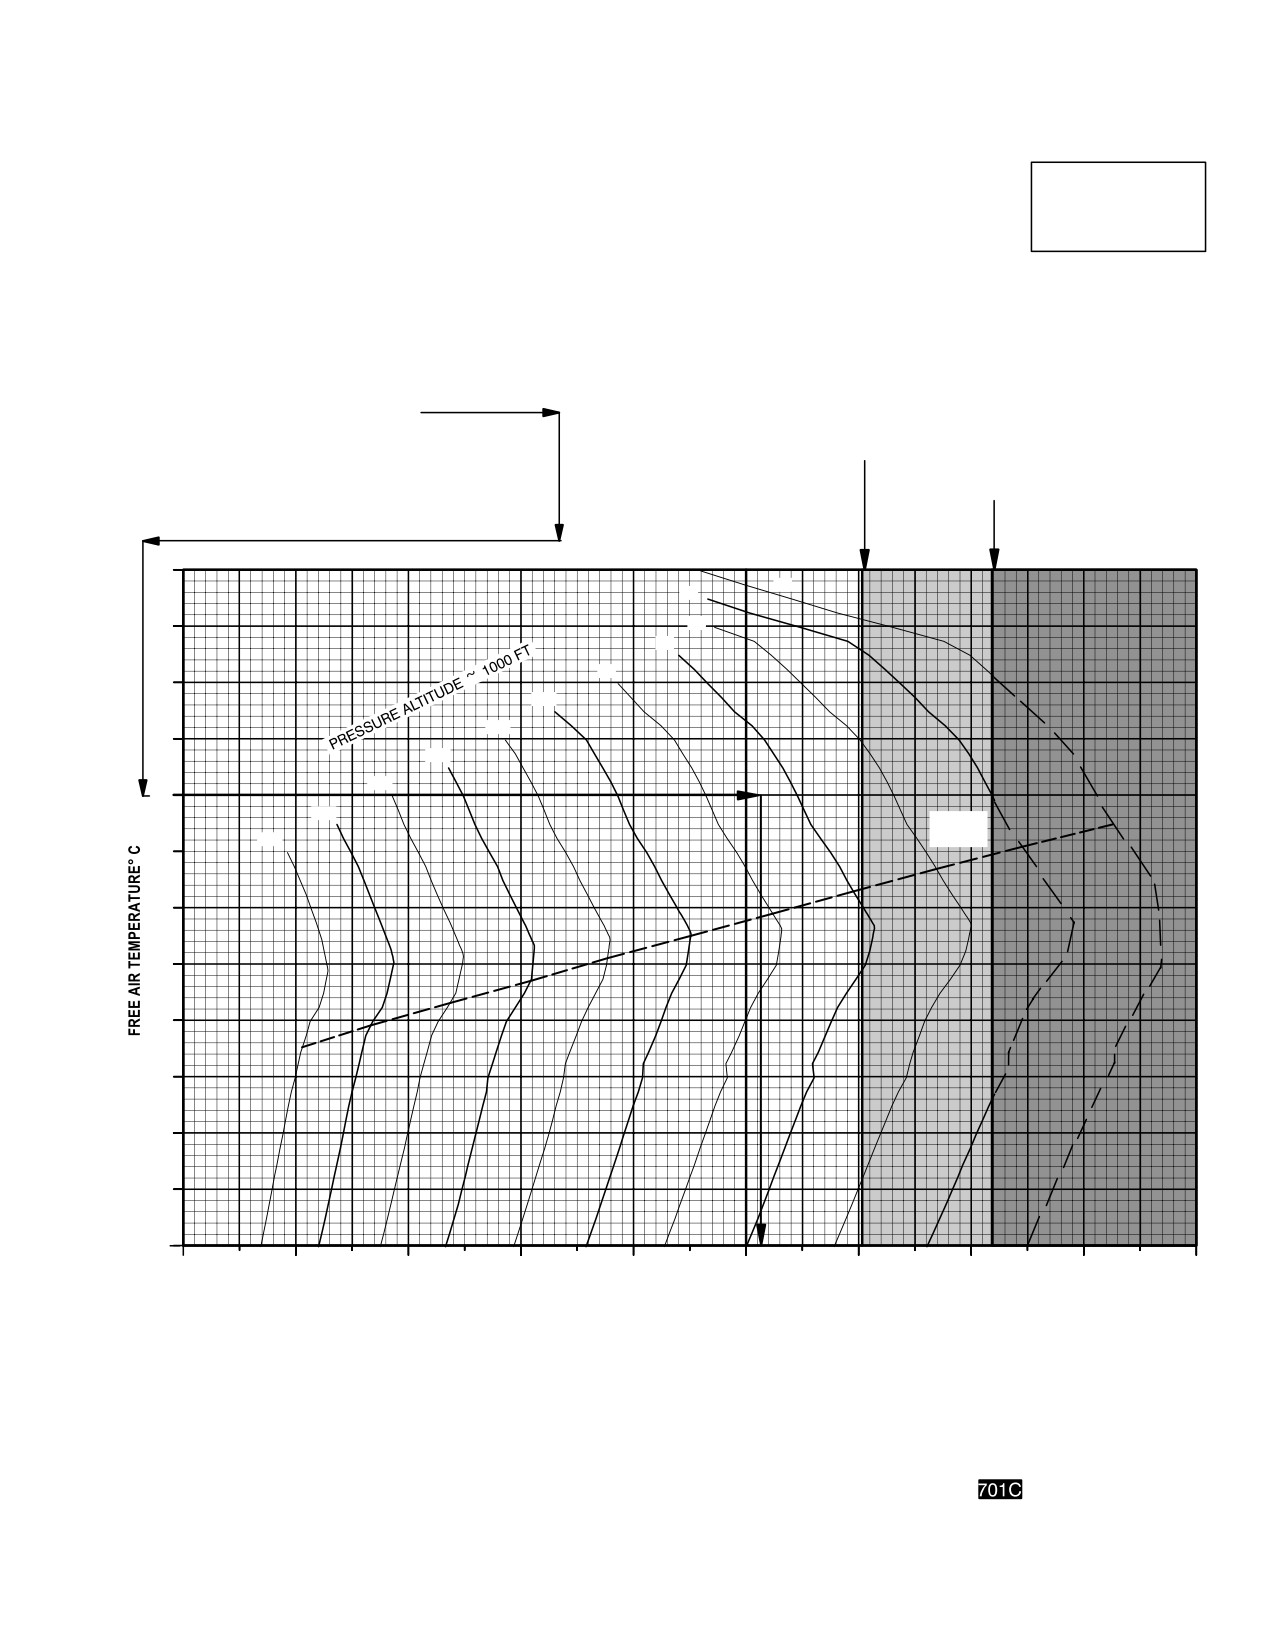
TM 1-1520-251-10
MAXIMUM TORQUE
SINGLE ENGINE MAXIMUM TORQUE AVAILABLE
AVAILABLE/OEI
2.5MIN LIMIT, 101% NR, ANTIICE OFF
AH64D
T700GE701C
ZERO AIRSPEED
EXAMPLE
WANTED
TORQUE AVAILABLE
2.5MIN LIMIT
KNOWN
FAT = +20 °C.
PRESSURE ALTITUDE = 6000 FT.
METHOD
ENTER AT KNOWN FAT = +20 °C.
MOVE RIGHT TO PRESSURE ALTITUDE
CONTINUOUS TORQUE
= 6000 FT. THEN MOVE DOWN
LIMIT 1ENGINE
TO READ 104.4% TORQUE AVAILABLE.
2.5MINUTE
THIS DOES NOT EXCEED 1ENGINE
LIMIT 1ENGINE
RED LINE. FOR ONEENGINE
OPERATION, TORQUE IS LIMITED TO 122%.
60
0
2
50
4
6
8
40
10
12
30
14
16
20
18
STD
20
TEMP
10
0
10
20
30
40
50
60
50
60
70
80
90
100
110
120
130
140
TORQUE AVAILABLE PER ENGINE %
DATA BASIS:
CALCULATED FROM ENGINE MODEL SPEC NO. E1290, 15 APRIL 1988
LBA1146
Figure 7A-11. Maximum Torque Available Chart - 2.5 Minute Limit
Use or disclosure of this information is subject to the restriction(s) on the title page of this document.
7A-13
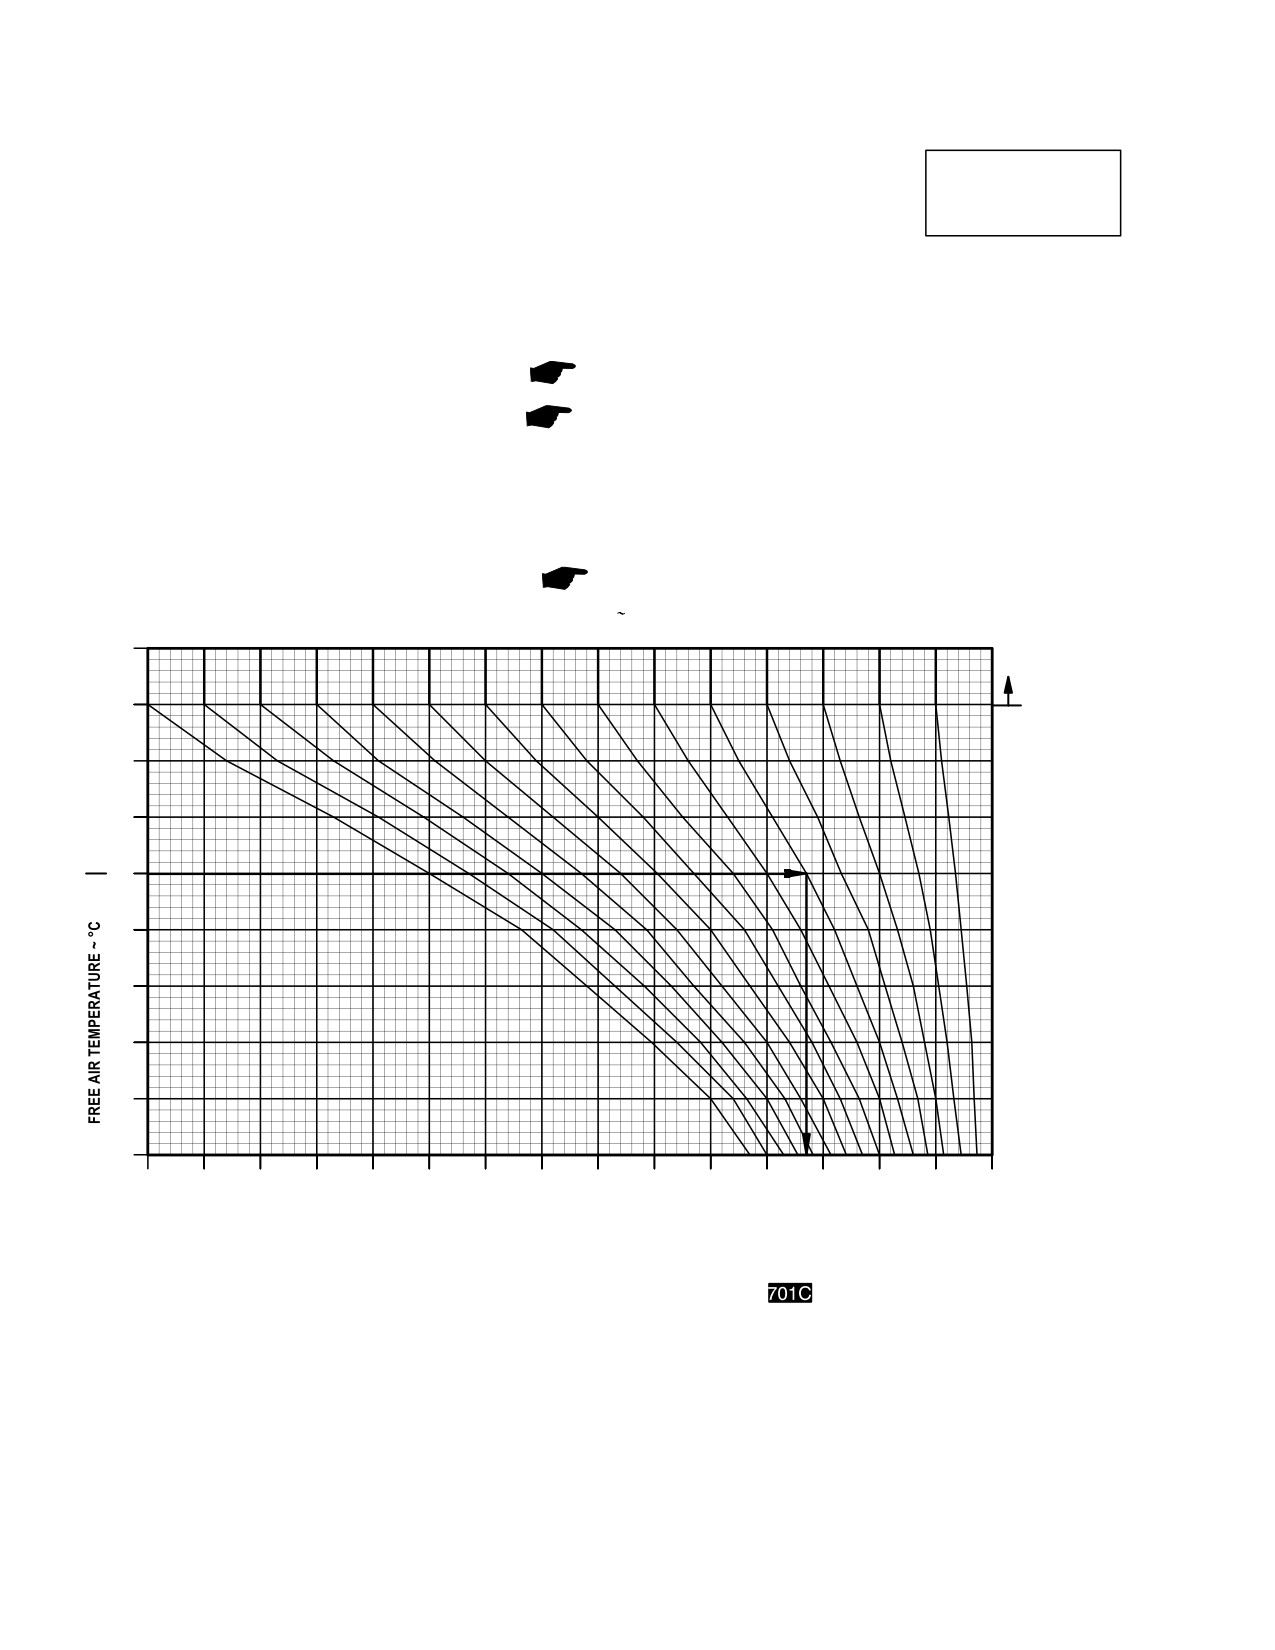
TM 1-1520-251-10
TORQUE FACTOR
TORQUE FACTOR
AH64D
T700-GE-701C ENGINE, 101% RPM
T700GE701C
EXAMPLE
WANTED
TO CALCULATE MAXIMUM TORQUE AVAILABLE:
TORQUE RATIO AND MAXIMUM TORQUE AVAILABLE
4. ENTER MAXIMUM TORQUE AVAILABLE CHART 30 MIN LIMIT (FIGURE 7A9)
30MIN LIMIT
AT KNOWN FAT
KNOWN
5. MOVE RIGHT TO KNOWN PRESSURE ALTITUDE
ATF = .95
6. MOVE DOWN, READ SPECIFICATION TORQUE = 95.7%
PRESSURE ALTITUDE = 6000 FT
FAT = + 20 °C
TO OBTAIN ACTUAL TORQUE VALUE AVAILABLE FROM THE
TORQUE CONVERSION CHART (FIGURE 7A13):
METHOD
TO OBTAIN TORQUE RATIO
7. ENTER TORQUE CONVERSION CHART AT %
TORQUE OBTAINED FROM 30MIN LIMIT CHART
1. ENTER TORQUE FACTOR CHART AT KNOWN FAT
8. MOVE UP TO TORQUE RATIO OBTAINED FROM TORQUE
2. MOVE RIGHT TO THE ATF VALUE
FACTOR CHART
3. MOVE DOWN, READ TORQUE RATIO = .967
9. MOVE LEFT, READ MAXIMUM TORQUE AVAILABLE = 92.5%
TORQUE FACTOR
~ ATF OR ETF
.85
.86
.87
.88
.89
.90
.91
.92
.93
.94
.95
.96
.97
.98
.99
1.0
40
35
FOR FAT’S
OF 35 °C AND
ABOVE:
30
TR = ATF
25
20
15
10
5
0
5
.85
.86
.87
.88
.89
.90
.91
.92
.93
.94
.95
.96
.97
.98
.99
1.0
TORQUE RATIO ~ TR
DATA BASE: CALCULATED
LBA2558B
Figure
7A-12. Torque Factor Chart
Use or disclosure of this information is subject to the restriction(s) on the title page of this document.
7A-14
Change 4
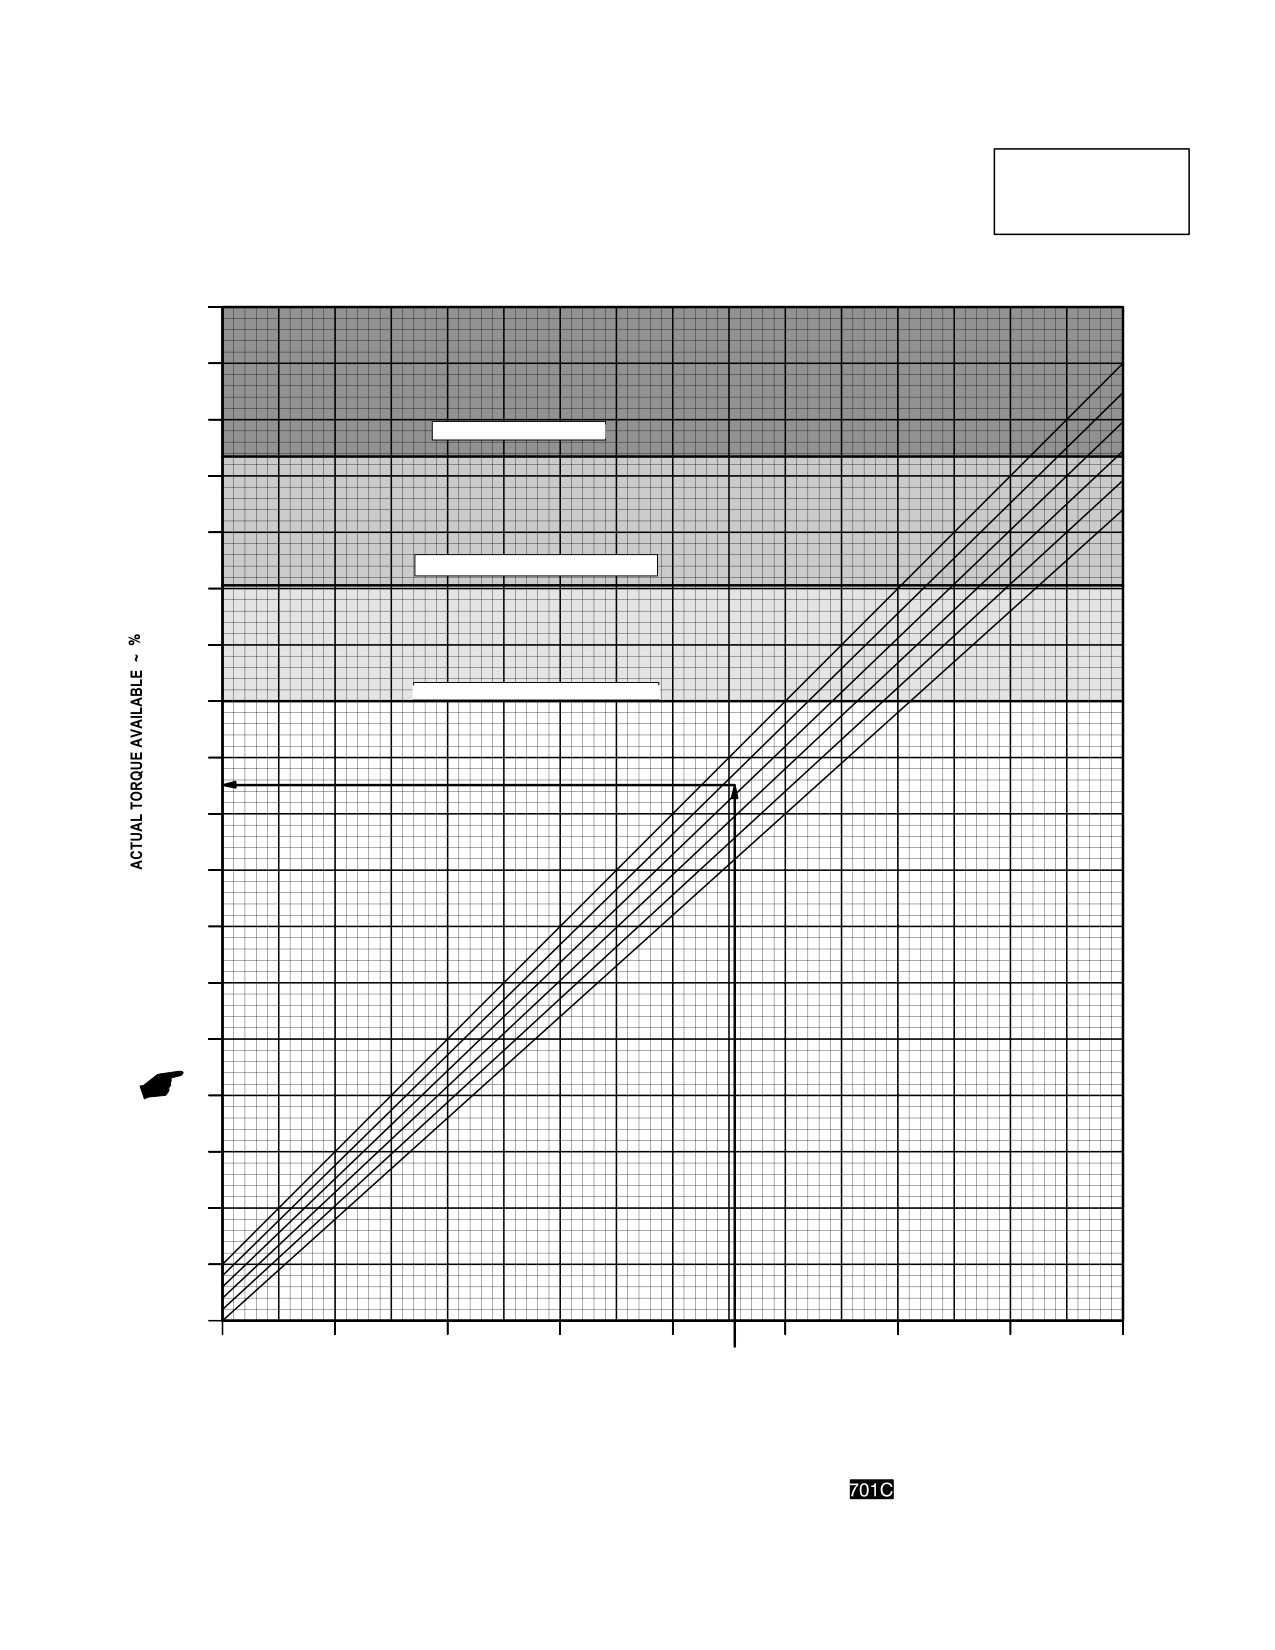
TM 1-1520-251-10
TORQUE CONVERSION
TORQUE CONVERSION CHART
AH64D
T700GE701C
TORQUE RATIO
135
1.0
130
0.98
125
0.96
2.5−MINUTE LIMIT 1ENGINE
0.94
120
0.92
0.90
115
CONTINUOUS TORQUE LIMIT 1ENGINE
110
105
CONTINUOUS TORQUE LIMIT 2ENGINES
100
95
90
85
80
75
70
65
60
55
50
45
50
60
70
80
90
100
110
120
130
SPECIFICATION TORQUE AVAILABLE PER ENGINE ~ %
LBA2559A
Figure 7A-13. Torque Conversion Chart
Use or disclosure of this information is subject to the restriction(s) on the title page of this document.
Change 4
7A-15
TM 1-1520-251-10
Section III. HOVERING CEILING
7A.15 DESCRIPTION
wheel height. Enter the appropriate power available chart
at the pressure altitude, move right to the FAT, move down
The hover ceiling chart (fig 7A-14) presents the maximum
to the desired wheel height, and then move left and read
gross weight for hover at various conditions of pressure
maximum gross weight.
altitude, Free Air Temperature (FAT), and wheel height,
using maximum torque available, 30 - minute limit.
7A.17 CONDITIONS
The hover ceiling chart (fig 7A-15) presents the maximum
gross weight for hover at various conditions of pressure
The hover ceiling chart is based on maximum torque
altitude, Free Air Temperature (FAT), and wheel height,
available 30-minute limit, ATF = 1.0, 101% rotor RPM, and
using maximum torque available, 10 - minute limit.
ENG INLET anti-ice system OFF. For ENG INLET ANTI-
ICE system ON, use dashed lines. Applicable configura-
7A.16 USE OF CHART
tion is all external stores except auxiliary fuel tanks. For
the four auxiliary tank configuration, reduce the maximum
The primary use of the chart is illustrated by the example.
gross weight for hover as calculated from the hover ceiling
To determine the maximum gross weight for hover, it is
chart by 10.8 lbs for each 1000 lbs of gross weight. See
necessary to know the pressure altitude, FAT, and desired
example below:
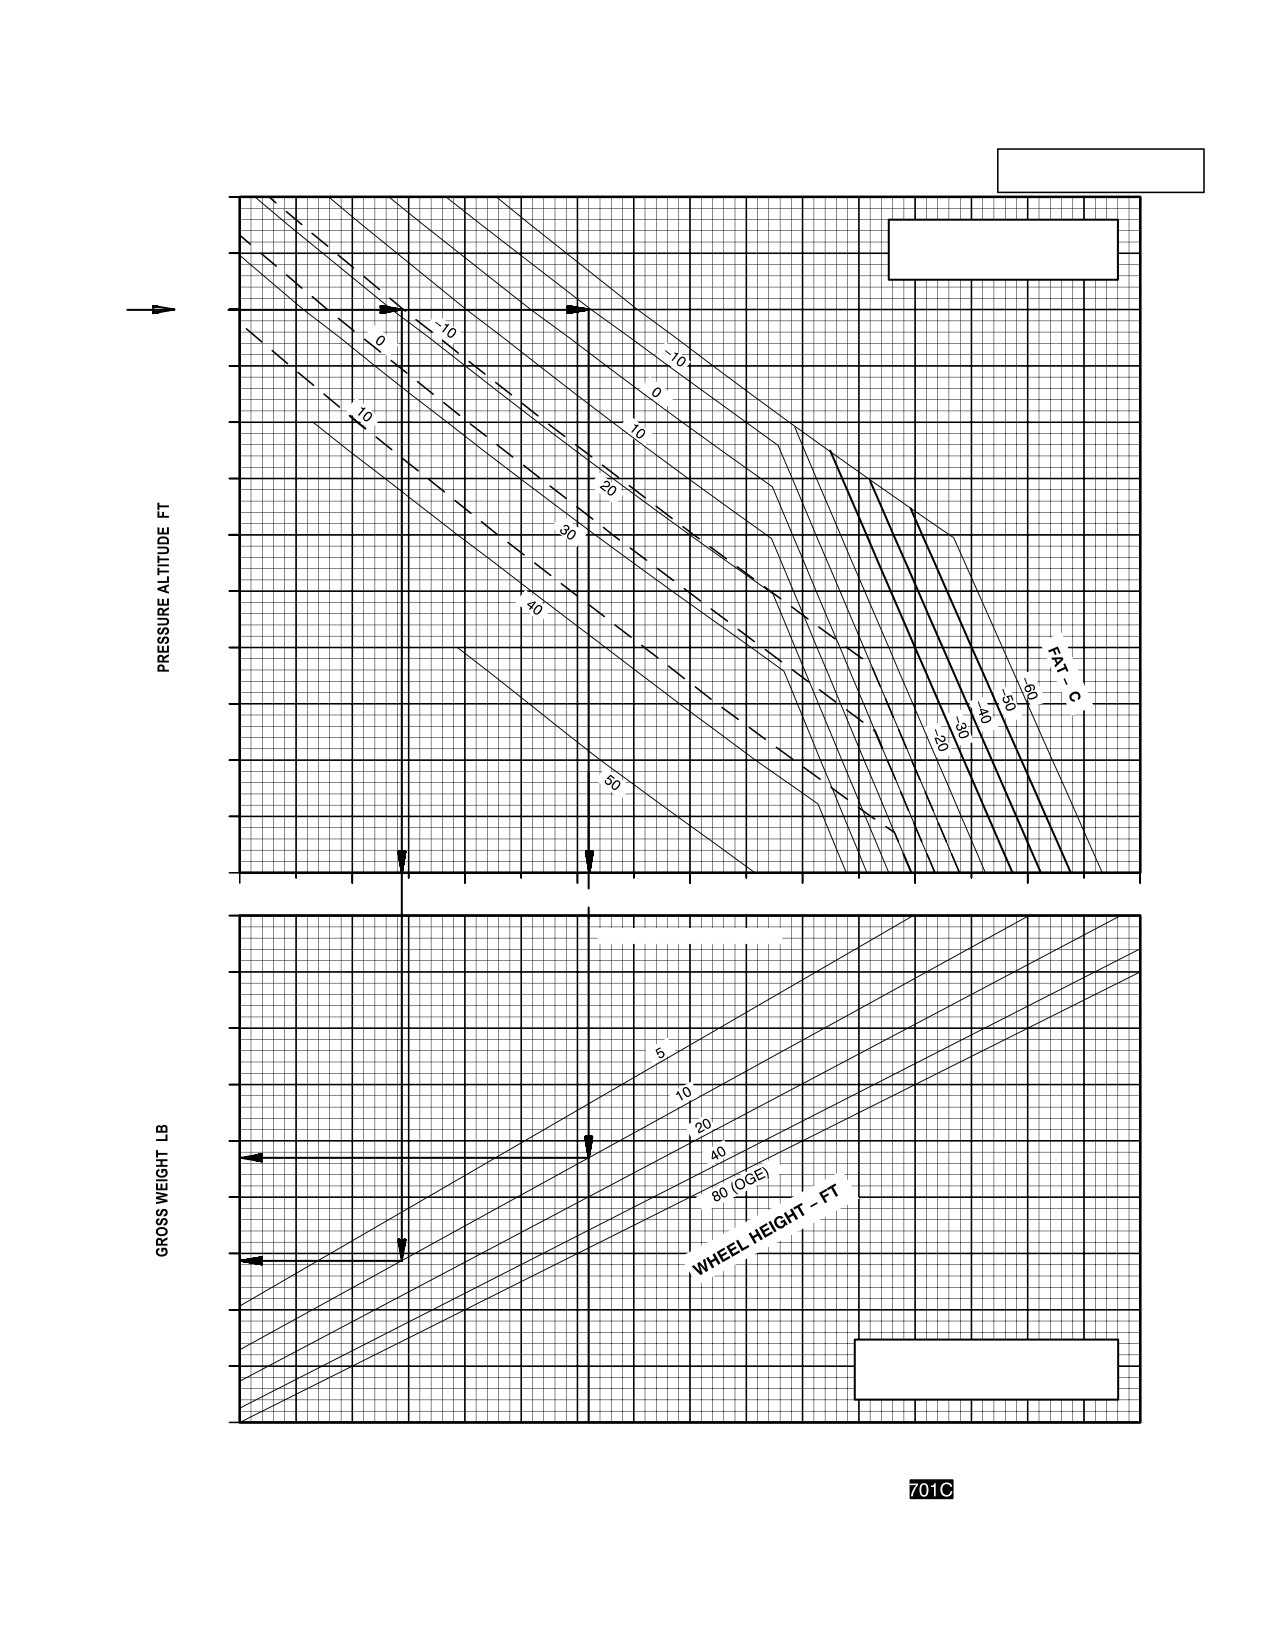
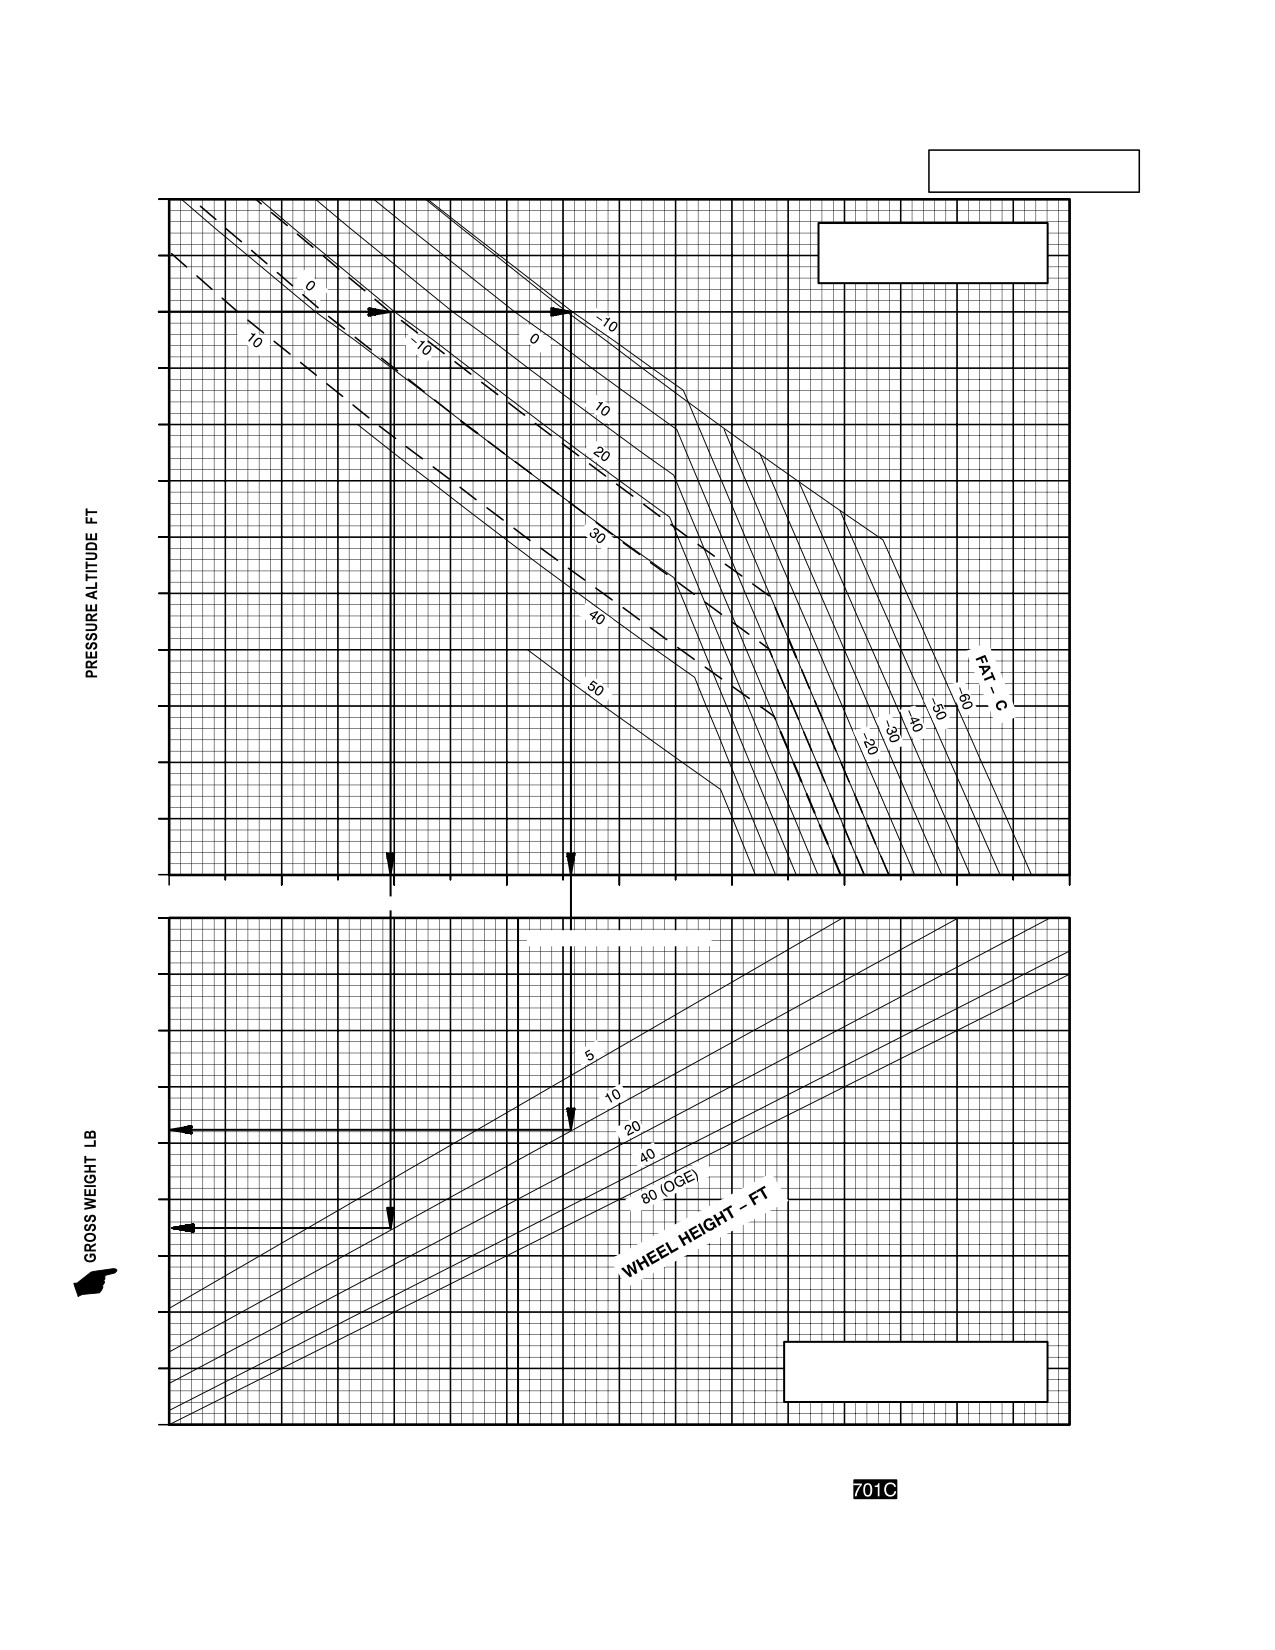
HOVER CEILING
EXAMPLE I
EXAMPLE II
WANTED
WANTED
MAXIMUM GROSS WEIGHT FOR HOVER AT
MAXIMUM GROSS WEIGHT FOR HOVER AT
10 - FOOT WHEEL HEIGHT, 30 - MINUTE LIMIT
10 - FOOT WHEEL HEIGHT, 10 - MINUTE LIMIT
TORQUE AVAILABLE, FOR ENGINE INLET ANTI-ICE
TORQUE AVAILABLE, FOR ENGINE INLET ANTI-ICE
OFF AND ON
OFF AND ON
KNOWN
KNOWN
PRESSURE ALTITUDE = 10,000 FEET
PRESSURE ALTITUDE = 10,000 FEET
FAT = - 10 °C
FAT = - 10 °C
WHEEL HEIGHT = 10 FEET
WHEEL HEIGHT = 10 FEET
METHOD
METHOD
ENTER PRESSURE ALTITUDE SCALE AT 10,000 FT
ENTER PRESSURE ALTITUDE SCALE AT 10,000 FT
MOVE RIGHT TO - 10 °C FAT, SOLID LINE FOR
MOVE RIGHT TO - 10 °C FAT, SOLID LINE FOR
ANTI-ICE OFF, DASHED LINE FOR ANTI-ICE ON
ANTI-ICE OFF, DASHED LINE FOR ANTI-ICE ON
MOVE DOWN TO 10 FEET WHEEL HEIGHT
MOVE DOWN TO 10 FEET WHEEL HEIGHT
MOVE LEFT TO READ GROSS WEIGHT FOR HOVER:
MOVE LEFT TO READ GROSS WEIGHT FOR HOVER:
ANTI-ICE OFF, HOVER GW = 17,680 LB
ANTI-ICE OFF, HOVER GW = 18,220 LB
ANTI-ICE ON, HOVER GW = 15,850 LB
ANTI-ICE ON, HOVER GW = 16,500 LB
WITH 4 EXT TANKS INSTALLED
WITH 4 EXT TANKS INSTALLED
ANTI-ICE OFF
ANTI-ICE OFF
HOVER GW = 17,680 - 10.8 (17,680/1000)
HOVER GW = 18,220 - 10.8 (18,220/1000)
= 17,490 LB
= 18,020 LB
Use or disclosure of this information is subject to the restriction(s) on the title page of this document.
7A-16
Change 4
TM 1-1520-251-10
HOVER CEILING
HOVER CEILING/IRP
MAXIMUM TORQUE AVAILABLE (30MIN LIMIT) 101% NR RPM ATF = 1.0
AH64D,T700GE701C
12000
NOTE:
FOR ENGINE INLET
11000
ANTIICE ON, USE
DASHED LINES
10000
9000
8000
7000
6000
5000
4000
°
3000
2000
1000
0
13000
14000
15000
16000
17000
18000
19000
20000
21000
22000
OGE GROSS WEIGHT LB
21000
20000
19000
18000
17000
16000
15000
REDUCE HOVER GROSS WEIGHT
14000
10.8 LB PER 1000 LB FOR
4 TANK CONFIGURATION
13000
LBA0185
DATA BASIS: DERIVED FROM FLIGHT TEST
Figure 7A-14.
Hover Ceiling Chart - 30 Minute Limit
Use or disclosure of this information is subject to the restriction(s) on the title page of this document.
7A-17
TM 1-1520-251-10
HOVER CEILING
HOVER CEILING/MRP
AH64D, T700GE701C
MAXIMUM TORQUE AVAILABLE (10MIN LIMIT) 101% NR RPM ATF = 1.0
12000
NOTE:
FOR ENGINE INLET
11000
ANTIICE ON, USE
DASHED LINES
10000
9000
8000
7000
6000
5000
4000
°
3000
2000
1000
0
13000
14000
15000
16000
17000
18000
19000
20000
21000
22000
OGE GROSS WEIGHT LB
21000
20000
19000
18000
17000
16000
15000
REDUCE HOVER GROSS WEIGHT
14000
10.8 LB PER 1000 LB FOR
4 TANK CONFIGURATION
13000
DATA BASIS: DERIVED FROM FLIGHT TEST
LBA0186
Figure 7A-15.
Hover Ceiling Chart - 10 Minute Limit
Use or disclosure of this information is subject to the restriction(s) on the title page of this document.
7A-18
Change 4
TM 1-1520-251-10
Section IV. HOVER
7A.18 DESCRIPTION
necessary to know pressure altitude, FAT, gross weight,
and maximum torque available. Enter the known pressure
The hover chart (fig 7A-16) present the torque required to
altitude, move right to the FAT, move down to the gross
hover at various conditions of pressure altitude, Free Air
weight, then move left to intersection with maximum
Temperature (FAT), gross weight, wheel height, and with
torque available and read wheel height. This wheel height
or without external tanks.
is the maximum hover height.
7A.19 USE OF CHART
7A.19.3 Maximum Gross Weight. The hover chart
may also be used to determine the maximum gross weight
7A.19.1 Chart Explanation. The primary use of the
for hover at a given wheel height, pressure altitude, and
chart is illustrated by the example. To determine the
FAT condition. Enter at the known pressure altitude, move
torque required to hover, it is necessary to know the pres-
right to the FAT, then move down to the bottom of the low-
sure altitude, FAT, gross weight, and desired wheel height.
er grid and read density altitude. Now enter upper left grid
Enter the upper right grid at the known pressure altitude,
at maximum torque available, move down to wheel height,
move right to the FAT, move down to the gross weight,
and then move right to density altitude and read gross
move left to the desired wheel height, and then move up
weight. This is the maximum gross weight at which the he-
and read the torque required to hover.
licopter will hover.
7A.19.2 Maximum Hover Height. In addition to its pri-
7A.20 CONDITIONS
mary use, the hover chart may be used to predict the max-
imum hover height. This capability is needed for use of the
The hover chart is based on calm wind, level surface, and
takeoff chart. To determine maximum hover height, it is
101% rotor RPM.
Use or disclosure of this information is subject to the restriction(s) on the title page of this document.
7A-19
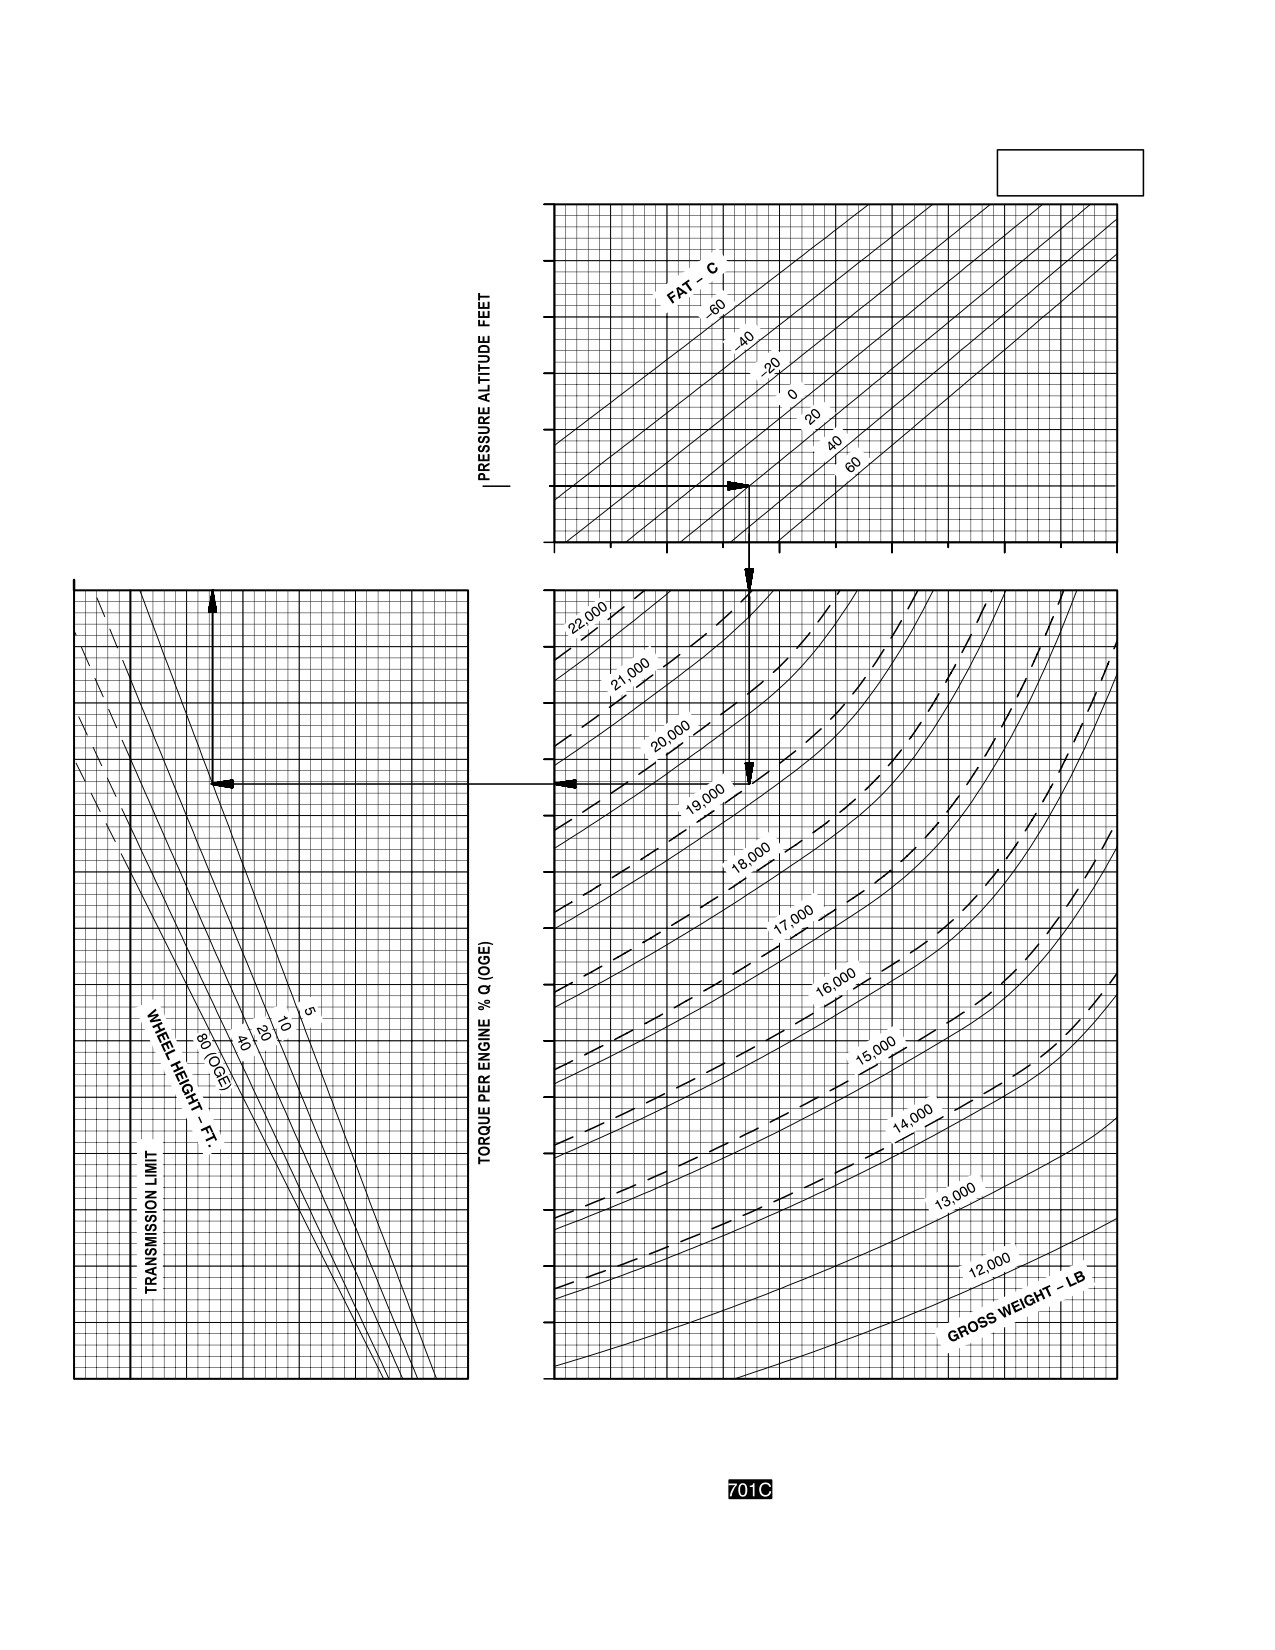
TM 1-1520-251-10
HOVER
HOVER AH64D
ZERO WIND, 101% NR RPM
T700GE701C
LEVEL SURFACE
15000
EXAMPLE
WANTED
12500
°
TORQUE REQUIRED TO HOVER
AT 5 FEET WHEEL HEIGHT WITH
FOUR EXTERNAL TANKS INSTALLED
10000
KNOWN
FAT= 20 °C, PRESSURE ALTITUDE=2500 FT.
GROSS WEIGHT=19,000 POUNDS
7500
METHOD
ENTER CHART AT PRESSURE ALTITUDE 2500 FEET
5000
MOVE RIGHT TO FAT = 20 °C,
MOVE DOWN TO GROSS WEIGHT = 19,000
POUNDS (DASHED LINE)
2500
MOVE TO LEFT TO WHEEL HEIGHT = 5 FEET, THEN
MOVE UP AND READ TORQUE REQUIRED = 85.4%
0
TORQUE PER ENGINE % Q
5000
0
5000
10000
15000
20000
110
100
90
80
70
60
50
40
DENSITY ALTITUDE FEET
110
105
100
95
90
85
80
75
70
65
60
55
NOTE: USE DASHED LINES FOR 4 EXTERNAL TANKS INSTALLED
DATA BASIS: DERIVED FROM FLIGHT TEST
LBA0183
USE SOLID LINES FOR NO EXTERNAL TANKS INSTALLED
Figure 7A-16. Hover Chart
Use or disclosure of this information is subject to the restriction(s) on the title page of this document.
7A-20
TM 1-1520-251-10
Section V. CRUISE
7A.21 DESCRIPTION
torque available, 30-minutes maximum torque available,
10-minute limit, and maximum torque available single en-
The cruise charts (figs 7A-17 thru 7A-27) present the level
gine limit, when less than the two-engine transmission
flight torque required and total fuel flow at various condi-
limit. These torque lines are the minimum torque available
tions of airspeed, pressure, pressure altitude, Free Air
at the engine turbine gas temperature limits specified in
Temperature (FAT), and gross weight. Cruise charts are
Chapter 5. Higher torque than that represented by these
provided for pressure altitudes from sea level to 16,000
lines may be used if it is available without exceeding the
feet in 2000-foot increments. FAT range from -50° C to
limitations presented in Chapter 5. The limit torque line
+60° C in 10° C increments. In addition to basic cruise in-
shown on these charts is for the dual engine transmission
formation, maximum endurance, and maximum rate of
limit and is defined as 100% torque. An increase or de-
climb. Change in torque with change in frontal area in-
crease in torque required because of a drag area change
formation is presented in the upper left corner of each
is calculated by adding or subtracting the change in torque
chart.
from the torque change (nQ) curve on the chart, and then
reading the new fuel flow total.
7A.22 USE OF CHARTS
7A.22.3 Fuel Flow. Fuel flow scales are provided op-
posite the torque scales. On any chart, torque may be
The primary use of the charts are illustrated by the exam-
converted directly to fuel flow without regard to other chart
ples. To use the charts, it is usually necessary to know the
information. Sea level ground fuel flow at flat pitch and
planned pressure altitude, estimated FAT, planned cruise
101% NP is approximately 555 pounds per hour.
speed, TAS and gross weight. First select the proper chart
on the basis of pressure altitude and FAT. Enter the chart
7A.22.4 Maximum Range. The maximum range lines
at the cruise airspeed, IAS move right and read TAS,
indicate the combinations of gross weight and airspeed
move left to the gross weight, move down and read torque
that will produce the greatest flight range per pound of fuel
required, and then move up and read associated fuel flow.
under zero wind conditions.
Maximum performance conditions are determined by en-
tering the chart where the maximum range line or the
7A.22.5 Maximum Endurance and Rate of
maximum rate-of-climb intersect the gross weight line;
Climb. The maximum endurance and rate of climb lines
then read airspeed, fuel flow, and torque required. Nor-
indicate the combinations of gross weight and airspeed
mally sufficient accuracy can be obtained by selecting the
that will produce the maximum endurance and the maxi-
chart nearest the planned cruise attitude and FAT or, more
mum rate of climb. The torque required for level flight at
conservatively, by selecting the chart with the next higher
this condition is a minimum, providing a minimum fuel flow
altitude and FAT. If greater accuracy is required, interpola-
(maximum endurance) and a maximum torque change
tion between altitudes and/or temperatures is permissible.
available for climb (maximum rate of climb).
To be conservative, use the gross weight chart at the be-
ginning of the cruise flight. For greater accuracy on long
7A.22.6 Change in Frontal Area. Since the cruise in-
flights, however, it is preferable to determine cruise in-
formation is given for the primary mission configuration,
formation for several flight segments to allow for the de-
adjustments to torque should be made when operating
creasing gross weight.
with alternative wing-stores configurations. To determine
the change in torque, first obtain the appropriate multiply-
7A.22.1 Airspeed. True and indicated airspeeds are
ing factor from the drag chart (figure 7A-28), then enter
presented at the opposite sides of each chart. On any
the cruise chart at the planned cruise speed TAS, move
chart, obtain indicated airspeed (or vice versa) by reading
right to the broken nQ line, and move up and read nQ.
directly across the chart without regard for the other chart
Multiply nQ by the multiplying factor to obtain change in
information.
torque, then add or subtract change in torque from torque
required for the primary mission configuration. Enter the
7A.22.2 Torque. Since pressure altitude and FAT are
cruise chart at resulting torque required, move up, and
fixed for each chart, torque required varies according to
read fuel flow. If the resulting torque required exceeds the
gross weight and airspeed. The torque required and the
governing torque limit, the torque required must be re-
torque limits shown on these charts are for dual-engine
duced to the limit. The resulting reduction in airspeed may
operation. The torque available shown on these charts
be found by subtracting the change in torque from the limit
are maximum continuous torque available, maximum
torque; then enter the cruise chart at the reduced torque,
Use or disclosure of this information is subject to the restriction(s) on the title page of this document.
7A-21
TM 1-1520-251-10
and move up to the gross weight. Move left or right to read
LET ANTI-ICE switch OFF, JP-8 fuel, and dual engine op-
TAS or IAS. To determine the airspeed for maximum
eration. Engine inlet anti-ice effects are as follows:
range for alternative wing stores configuration, reduce the
value from the cruise chart by 2 knots for each 5 square
7A.23.1 ENG INLET ANTI-ICE ON. With ENG INLET
feet increase in drag area, nF, or increase maximum
ANTI-ICE ON, fuel flow will increase between approxi-
range airspeed 2 knots for each 5 square feet reduction in
mately 65 pounds per hour at 30% torque and 85 pounds
drag area. For example, for 16 Hellfire configuration nF =
per hour at 100% torque. Maximum torque available
7.6 square feet, from (figure 7A-28). Therefore, maximum
30-minute limit could be reduced by as much as 20.4%,
range airspeed would be reduced by 2/5 x 7.6 = 3.04
and maximum torque available 10-minute limit could be
knots, or approximately 3 knots.
reduced by as much as 19.2%.
7A.23 CONDITIONS
The cruise charts are based on 101% rotor RPM, ENG IN-
Use or disclosure of this information is subject to the restriction(s) on the title page of this document.
7A-22
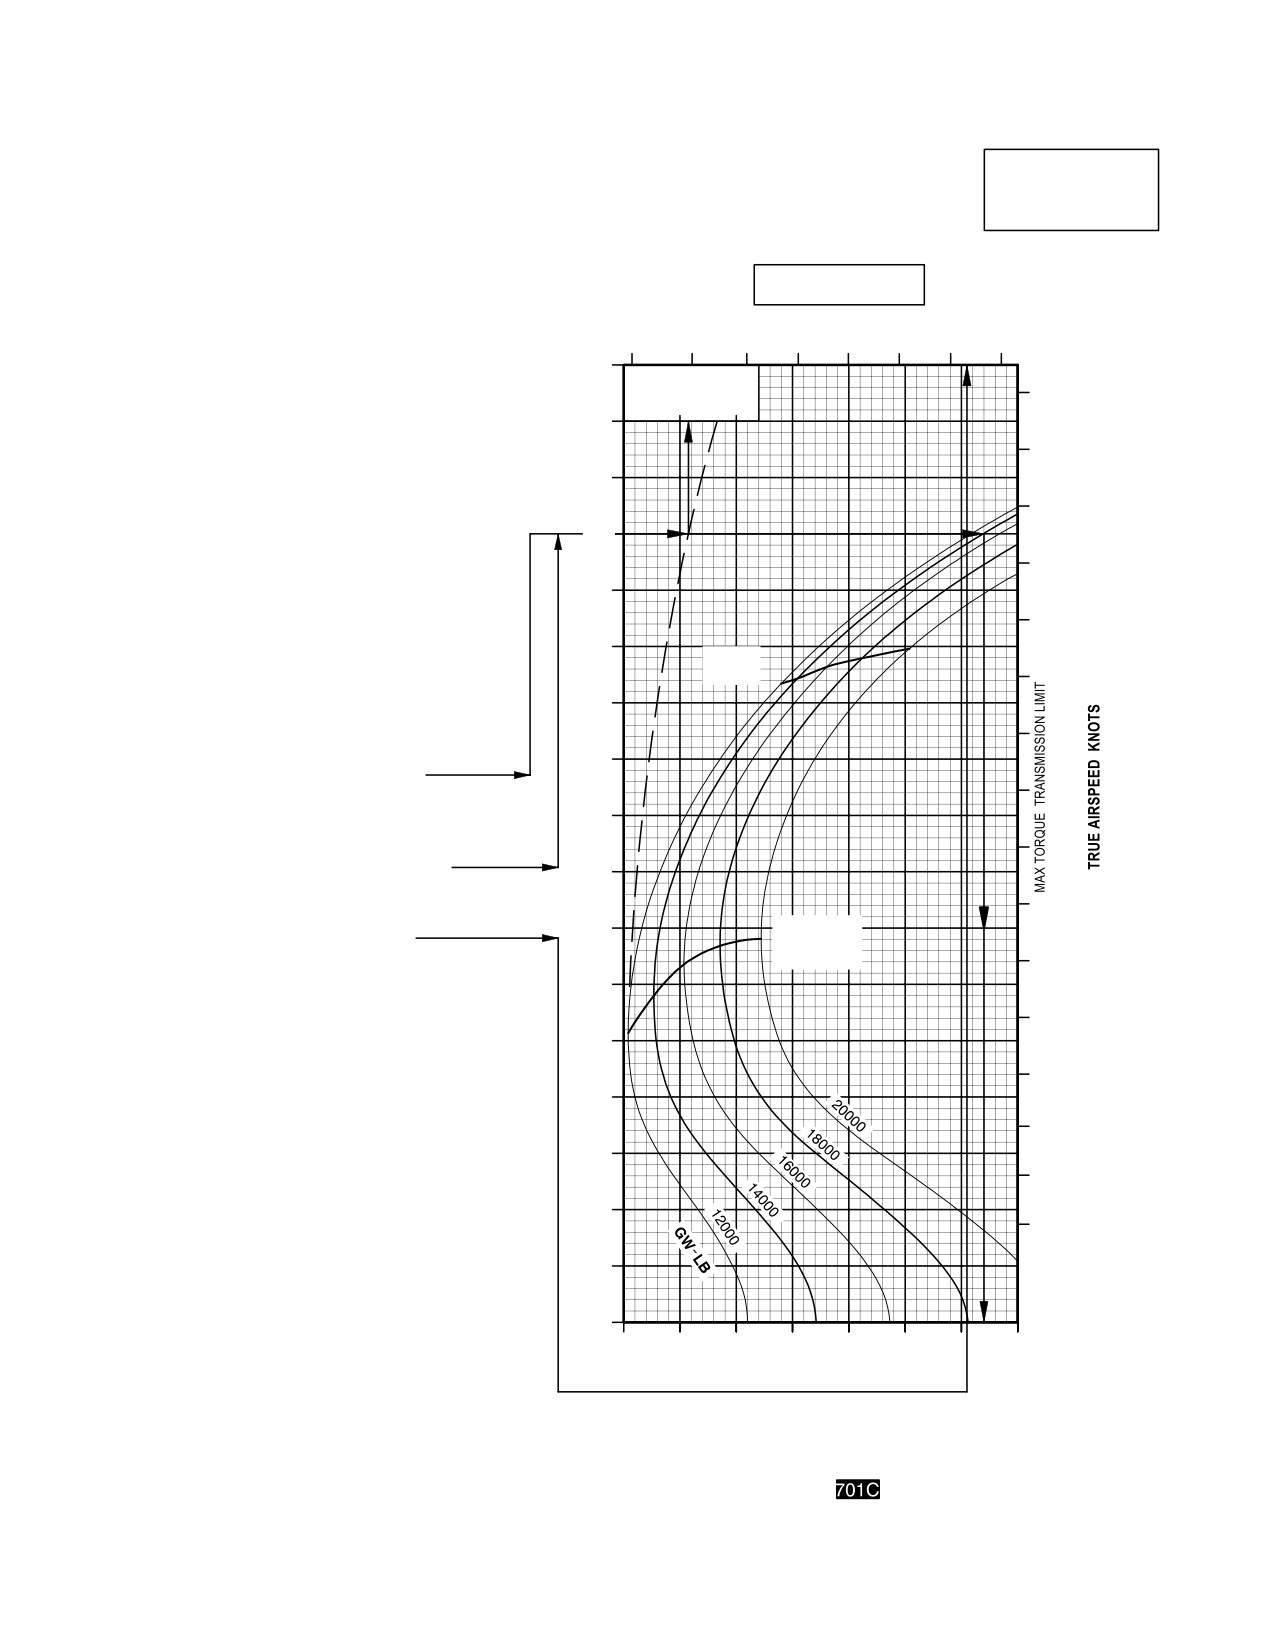
TM 1-1520-251-10
CRUISE
CRUISE
AH64D
PRESSURE ALTITUDE SEA LEVEL
T700GE701C
101% NR RPM, 8 HELLFIRE CONFIGURATION, JP8 FUEL
FAT = +10°C
INDICATED
AIRSPEED
TOTAL FUEL FLOW LB/HOUR
KNOTS
700
900
1100
1300
170
∆ Q %
∆ F = 10.0 SQ FT
170
0
10
20
160
160
150
150
EXAMPLE
140
WANTED
140
TORQUE REQUIRED AND FUEL FLOW
130
FOR 76 ROCKET CONFIGURATION
KNOWN
130
PRESSURE ALTITUDE=S.L., FAT = +10 °C.
120
GW = 14,000 LB. 4 LOADED ROCKET
MAX
LAUNCHERS (76 ROCKETS), IAS = 140 KT
RANGE
120
METHOD
110
FROM DRAG CHART (FIG 7A−28) OBTAIN
110
MULTIPLYING FACTOR = 0.27
100
ENTER CRUISE CHART AT IAS = 140 Kt
MOVE RIGHT TO BROKEN D Q LINE
100
MOVE UP TO READ D Q = 11.5%
90
MULTIPLY D Q BY MULTIPLYING FACTOR
TO GET CHANGE IN TORQUE = 3.1
90
REENTER CRUISE CHART AT IAS = 140 Kt
80
MOVE RIGHT TO GW = 14,000 LB
MOVE DOWN AND READ INDICATED
80
TORQUE PER ENGINE=94.0 %
MAX R/C
70
TORQUE REQUIRED = 94.0 3.1 = 90.9%
OR
REENTER CRUISE CHART AT 91%
MAX END
70
MOVE UP AND READ FUEL FLOW = 1335 LB/HR.
60
60
50
50
40
40
30
30
20
20
10
0
30
40
50
60
70
80
90
100
INDICATED TORQUE PER ENGINE %
DATA BASIS: DERIVED FROM FLIGHT TEST AND ENGINE MODEL SPEC No. DARCOMCP22202701A, DATED 15 JANUARY 1987
LBA0195
Figure 7A-17. Cruise Chart, Example
Use or disclosure of this information is subject to the restriction(s) on the title page of this document.
7A-23
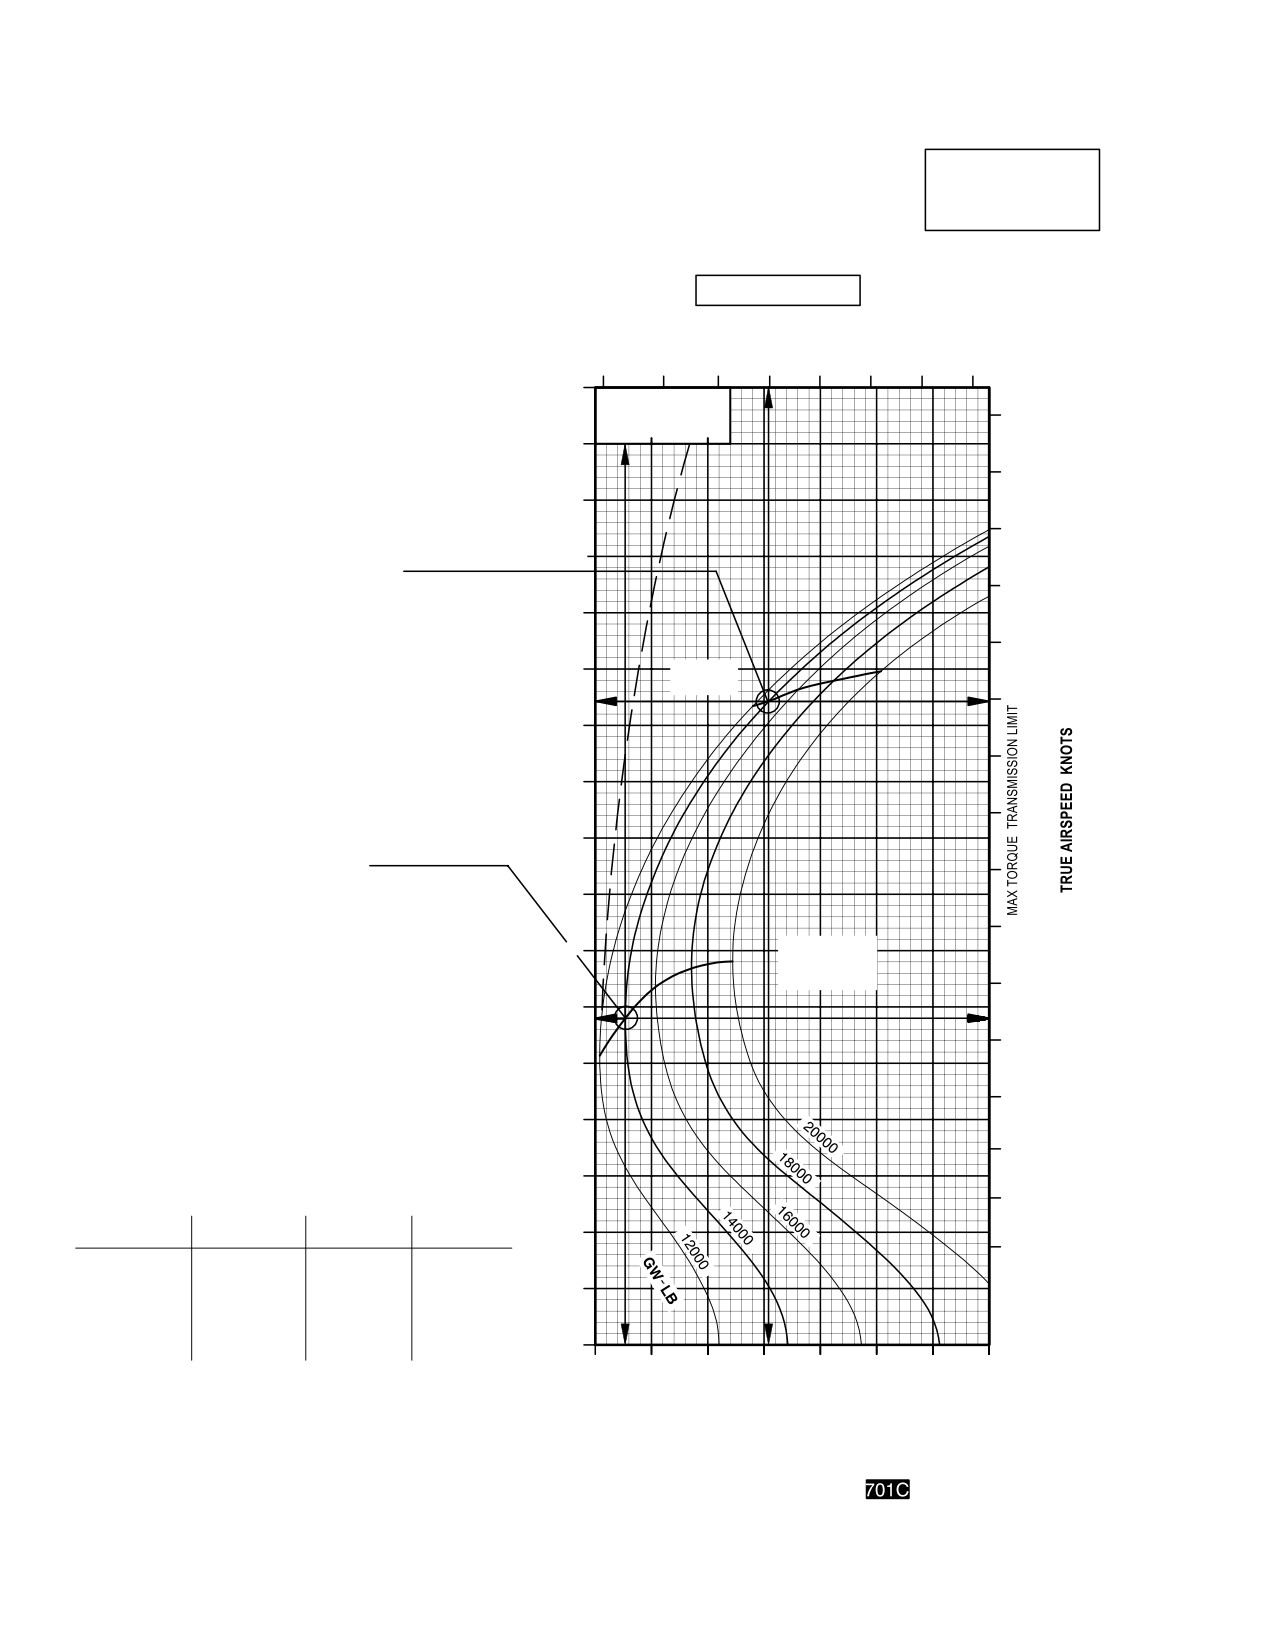
TM 1-1520-251-10
CRUISE
CRUISE
AH64D
PRESSURE ALTITUDE SEA LEVEL
T700GE701C
101% NR RPM, 8 HELLFIRE CONFIGURATION, JP8 FUEL
FAT=+10°C
INDICATED
AIRSPEED
TOTAL FUEL FLOW LB/HOUR
KNOTS
700
900
1100
1300
EXAMPLE I
170
∆ Q %
WANTED
170
∆ F = 10.0 SQ FT
TORQUE REQUIRED, AIRSPEED, AND FUEL FLOW
0
10
20
160
FOR MAXIMUM RANGE.
KNOWN
160
PRESSURE ALTITUDE = SL, FAT=+10 °C, AND
150
GROSS WEIGHT = 14,000 POUNDS.
METHOD
150
AT THE INTERSECTION OF THE MAXIMUM RANGE
140
LINE AND THE 14,000 POUND LINE
140
MOVE LEFT, READ IAS = 114 KT.
MOVE RIGHT, READ TAS = 120 KT.
130
MOVE UP, READ TOTAL FUEL FLOW = 1000 LB/HR.
130
MOVE DOWN, READ INDICATED TORQUE/ENGINE = 61%.
120
MAX
EXAMPLE II
RANGE
WANTED
120
TORQUE REQUIRED, AIRSPEED, AND FUEL FLOW
110
FOR MAXIMUM ENDURANCE.
110
KNOWN
100
PRESSURE ALTITUDE = SL, FAT = +10 °C, AND
GROSS WEIGHT = 14,000 POUNDS.
100
METHOD
90
AT THE INTERSECTION OF THE MAXIMUM RANGE
LINE AND THE 14,000 POUND LINE
90
MOVE LEFT, READ IAS = 58 KT.
80
MOVE RIGHT, READ TAS = 64 KT.
MOVE UP, READ TOTAL FUEL FLOW = 740 LB/HR.
80
MOVE DOWN, READ INDICATED TORQUE/ENGINE = 35%.
MAX R/C
70
EXAMPLE III
OR
MAX END
70
(INTERPOLATION NOT ILLUSTRATED)
WANTED
60
TORQUE REQUIRED, AIRSPEED, AND FUEL FLOW,
60
AND TORQUE.
50
KNOWN
PRESSURE ALTITUDE = 1000 FEET FAT = +15 °C,
50
AND GROSS WEIGHT = 14000 POUNDS.
40
METHOD
40
READ AIRSPEED, TORQUE, AND FUEL FLOW FOR EACH
30
ADJACENT ALTITUDE AND FAT, THEN INTERPOLATE
BETWEEN FAT AND ALTITUDE AS FOLLOWS:
30
SOLUTION:
20
ALTITUDE
SEA LEVEL
2000 FEET
1000 FEET
20
FAT
20
10
20
10
15
TORQUE
35
35
35
35
35
10
FUEL FLOW
740
740
720
715
730
IAS
58
58
59
59
58.5
TAS
65
64
68
67
66
0
30
40
50
60
70
80
90
100
INDICATED TORQUE PER ENGINE %
DATA BASIS: DERIVED FROM FLIGHT TEST AND ENGINE MODEL SPEC No. DARCOMCP22202701A, DATED 15 JANUARY 1987
LBA0196
Figure 7A-18. Cruise Chart, Sea Level, +10°C Example
Use or disclosure of this information is subject to the restriction(s) on the title page of this document.
7A-24
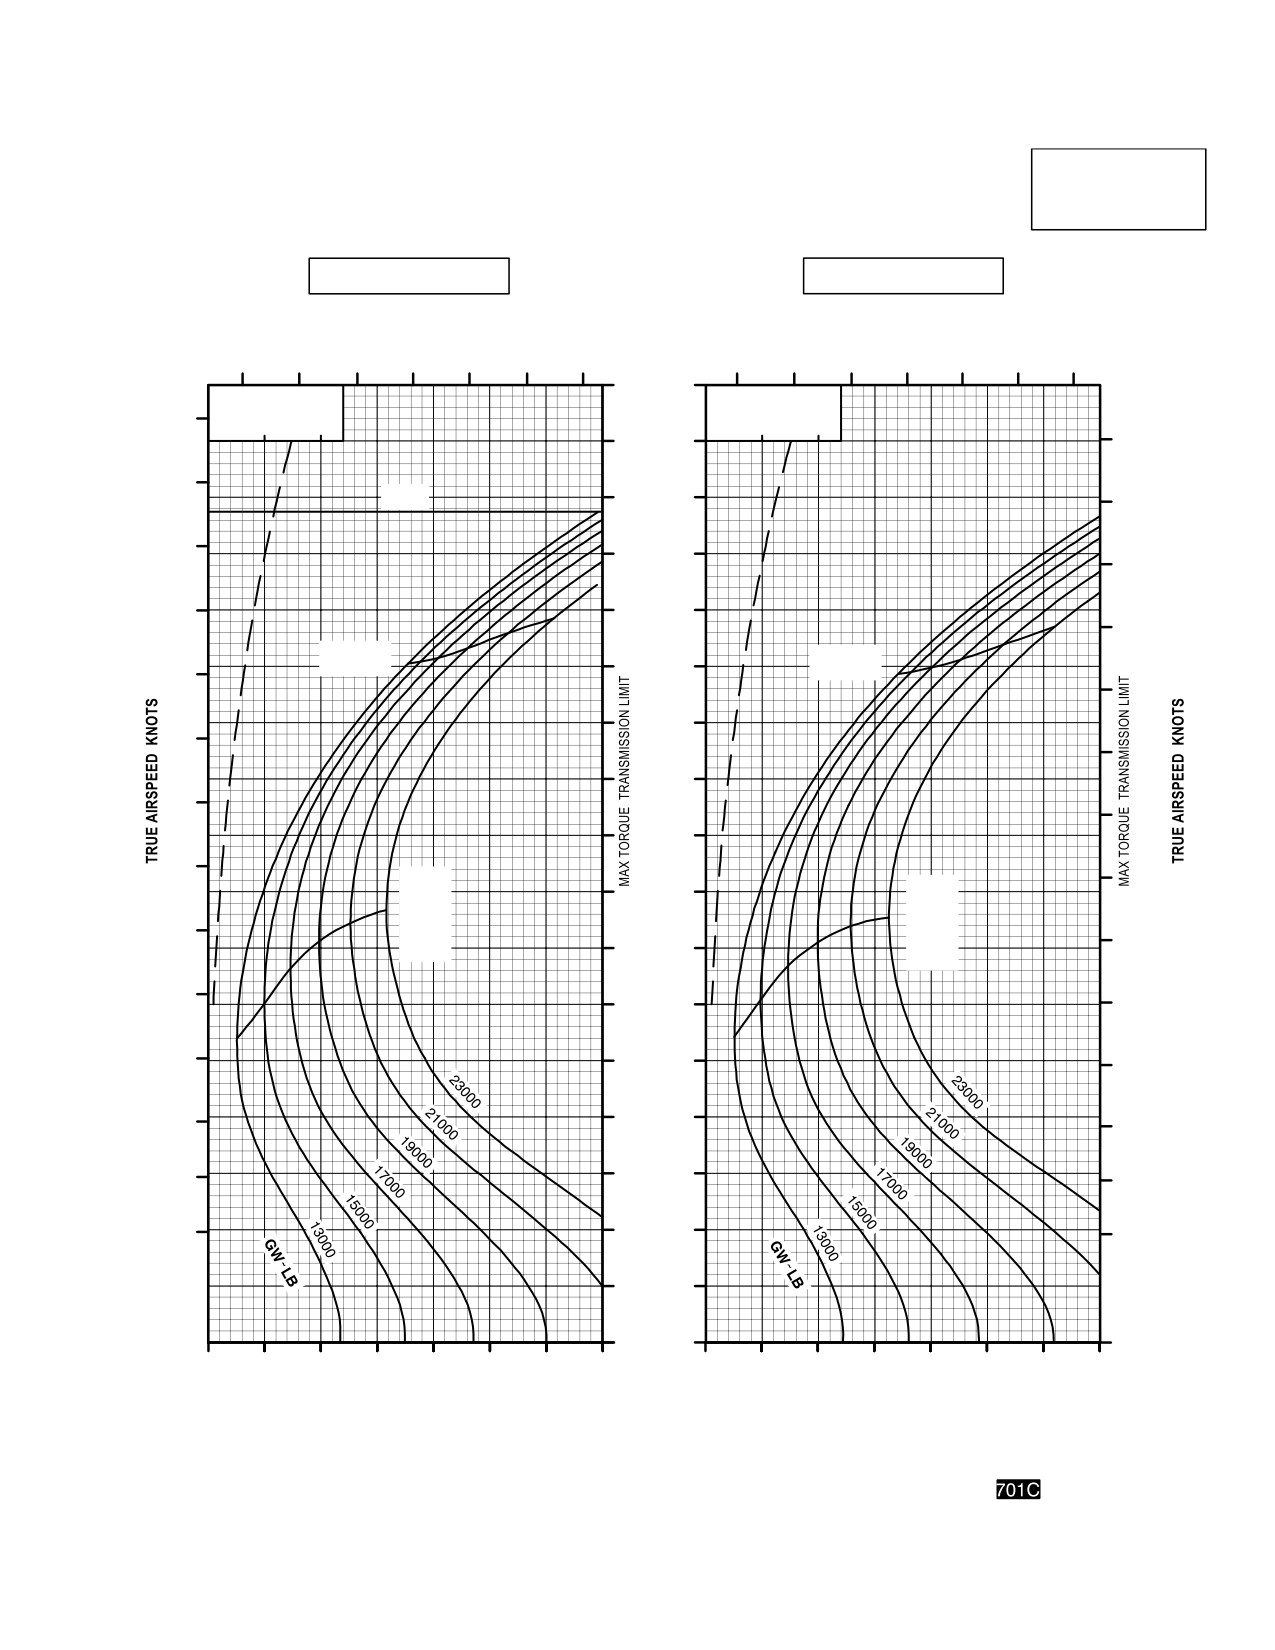
TM 1-1520-251-10
CRUISE
CRUISE
AH64D
PRESSURE ALTITUDE SEA LEVEL
T700GE701C
101% NR RPM, 8 HELLFIRE CONFIGURATION, JP8 FUEL
FAT = 50°C
FAT = 40°C
TOTAL FUEL FLOW LB/HOUR
INDICATED
TOTAL FUEL FLOW LB/HOUR
AIRSPEED
KNOTS
700
900
1100
1300
700
900
1100
1300
170
∆ Q %
∆ Q %
150
∆ F = 10.0 SQ FT
∆ F = 10.0 SQ FT
0
10
20
0
10
20
160
150
140
V NE
150
140
130
140
130
120
130
120
MAX
MAX
RANGE
120
110
RANGE
110
110
100
100
100
90
90
90
80
MAX
80
80
MAX
R/C
R/C
OR
70
OR
MAX
70
70
MAX
END
END
60
60
60
50
50
50
40
40
40
30
30
30
20
20
20
10
0
30
40
50
60
70
80
90
100
30
40
50
60
70
80
90
100
INDICATED TORQUE PER ENGINE %
INDICATED TORQUE PER ENGINE %
DATA BASIS: DERIVED FROM FLIGHT TEST AND ENGINE MODEL SPEC NO. E1290, 15 APRIL 1988
LBA0197
Figure 7A-19. Cruise Chart, Sea Level, - 50°C and - 40°C (sheet 1 of 6)
Use or disclosure of this information is subject to the restriction(s) on the title page of this document.
7A-25
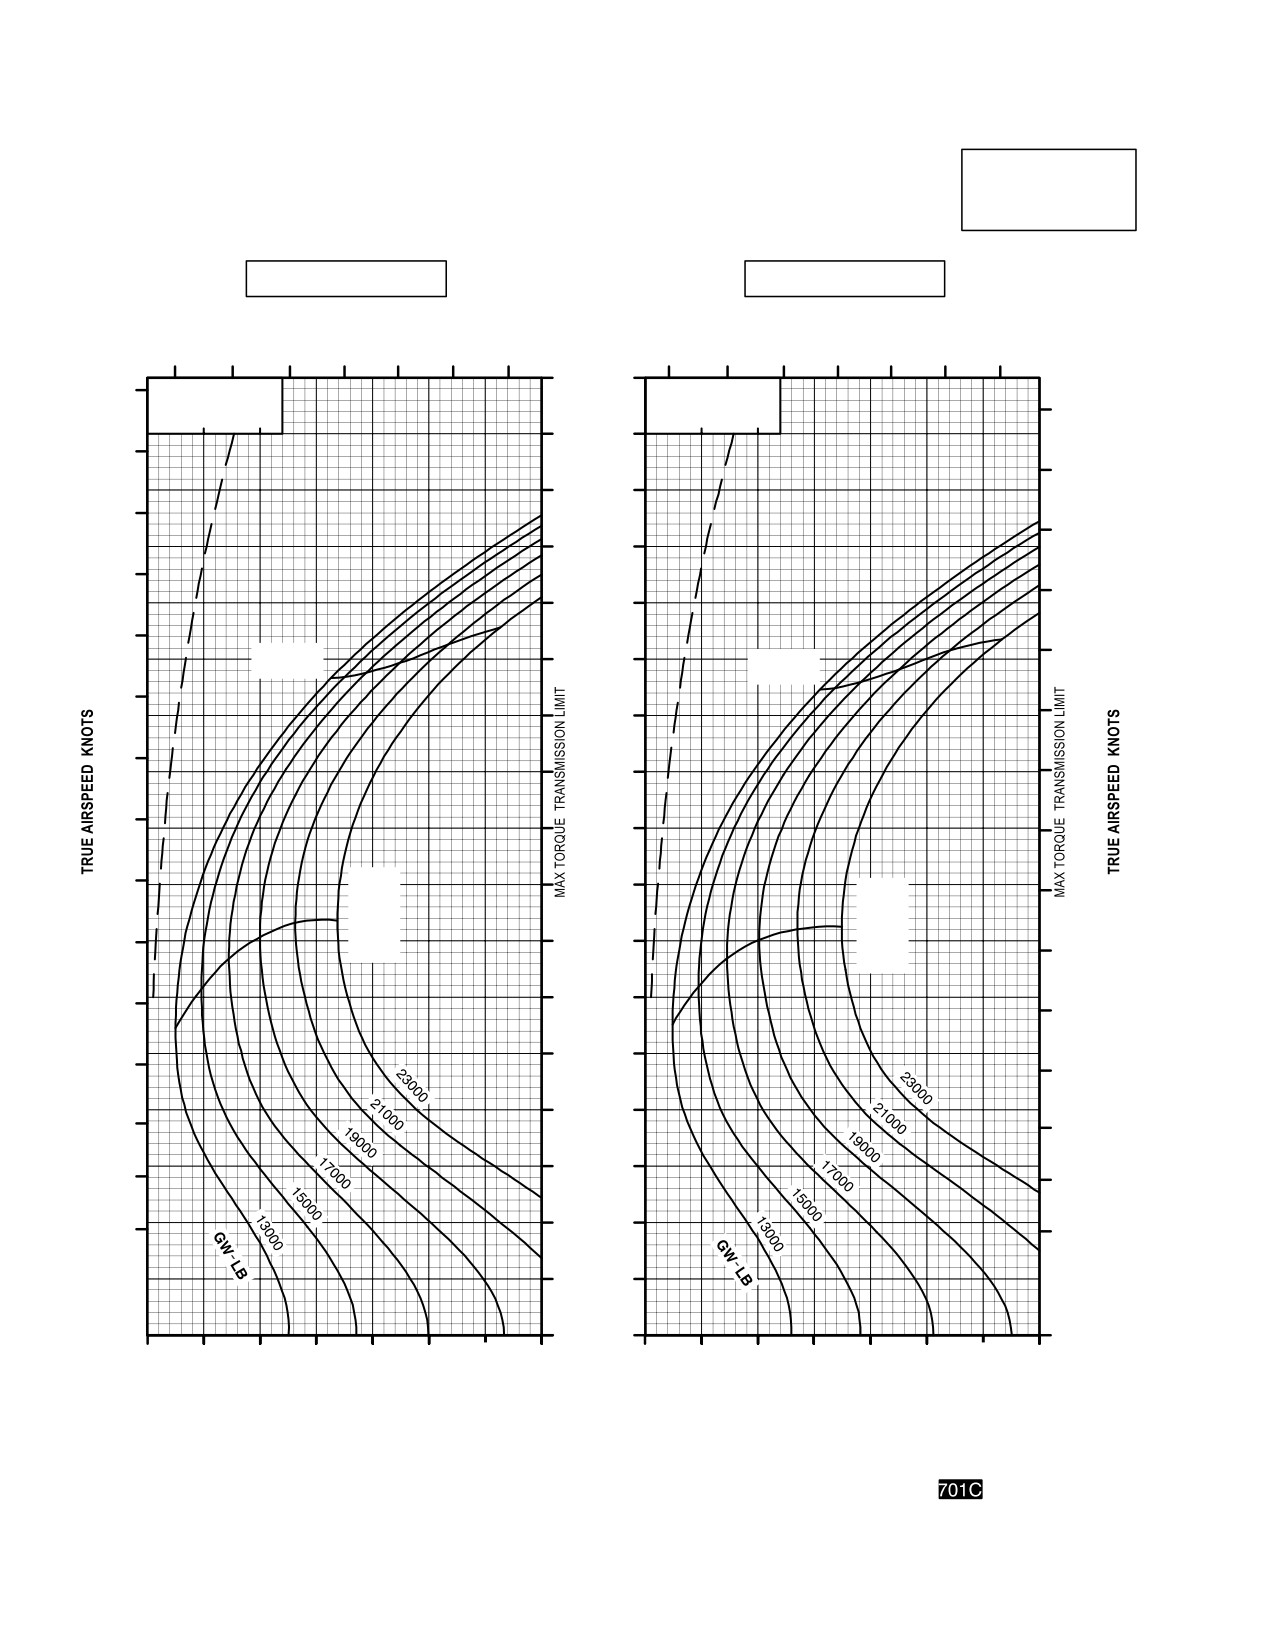
TM 1-1520-251-10
CRUISE
CRUISE
AH64D
PRESSURE ALTITUDE SEA LEVEL
T700GE701C
101% NR RPM, 8 HELLFIRE CONFIGURATION, JP8 FUEL
FAT = 30°C
FAT = 20°C
INDICATED
TOTAL FUEL FLOW LB/HOUR
AIRSPEED
TOTAL FUEL FLOW LB/HOUR
KNOTS
700
900
1100
1300
700
900
1100
1300
170
160
∆ Q %
∆ Q %
∆ F = 10.0 SQ FT
∆ F = 10.0 SQ FT
160
0
10
20
0
10
20
160
150
150
150
140
140
140
130
130
130
120
MAX
120
120
MAX
RANGE
RANGE
110
110
110
100
100
100
90
90
90
80
MAX
80
MAX
80
R/C
R/C
OR
OR
70
MAX
70
MAX
70
END
END
60
60
60
50
50
50
40
40
40
30
30
30
20
20
20
10
0
30
40
50
60
70
80
90
100
30
40
50
60
70
80
90
100
INDICATED TORQUE PER ENGINE %
INDICATED TORQUE PER ENGINE %
DATA BASIS: DERIVED FROM FLIGHT TEST AND ENGINE MODEL SPEC NO. E1290, 15 APRIL 1988
LBA0198
Figure 7A-19. Cruise Chart, Sea Level, - 30°C and - 20°C (sheet 2 of 6)
Use or disclosure of this information is subject to the restriction(s) on the title page of this document.
7A-26
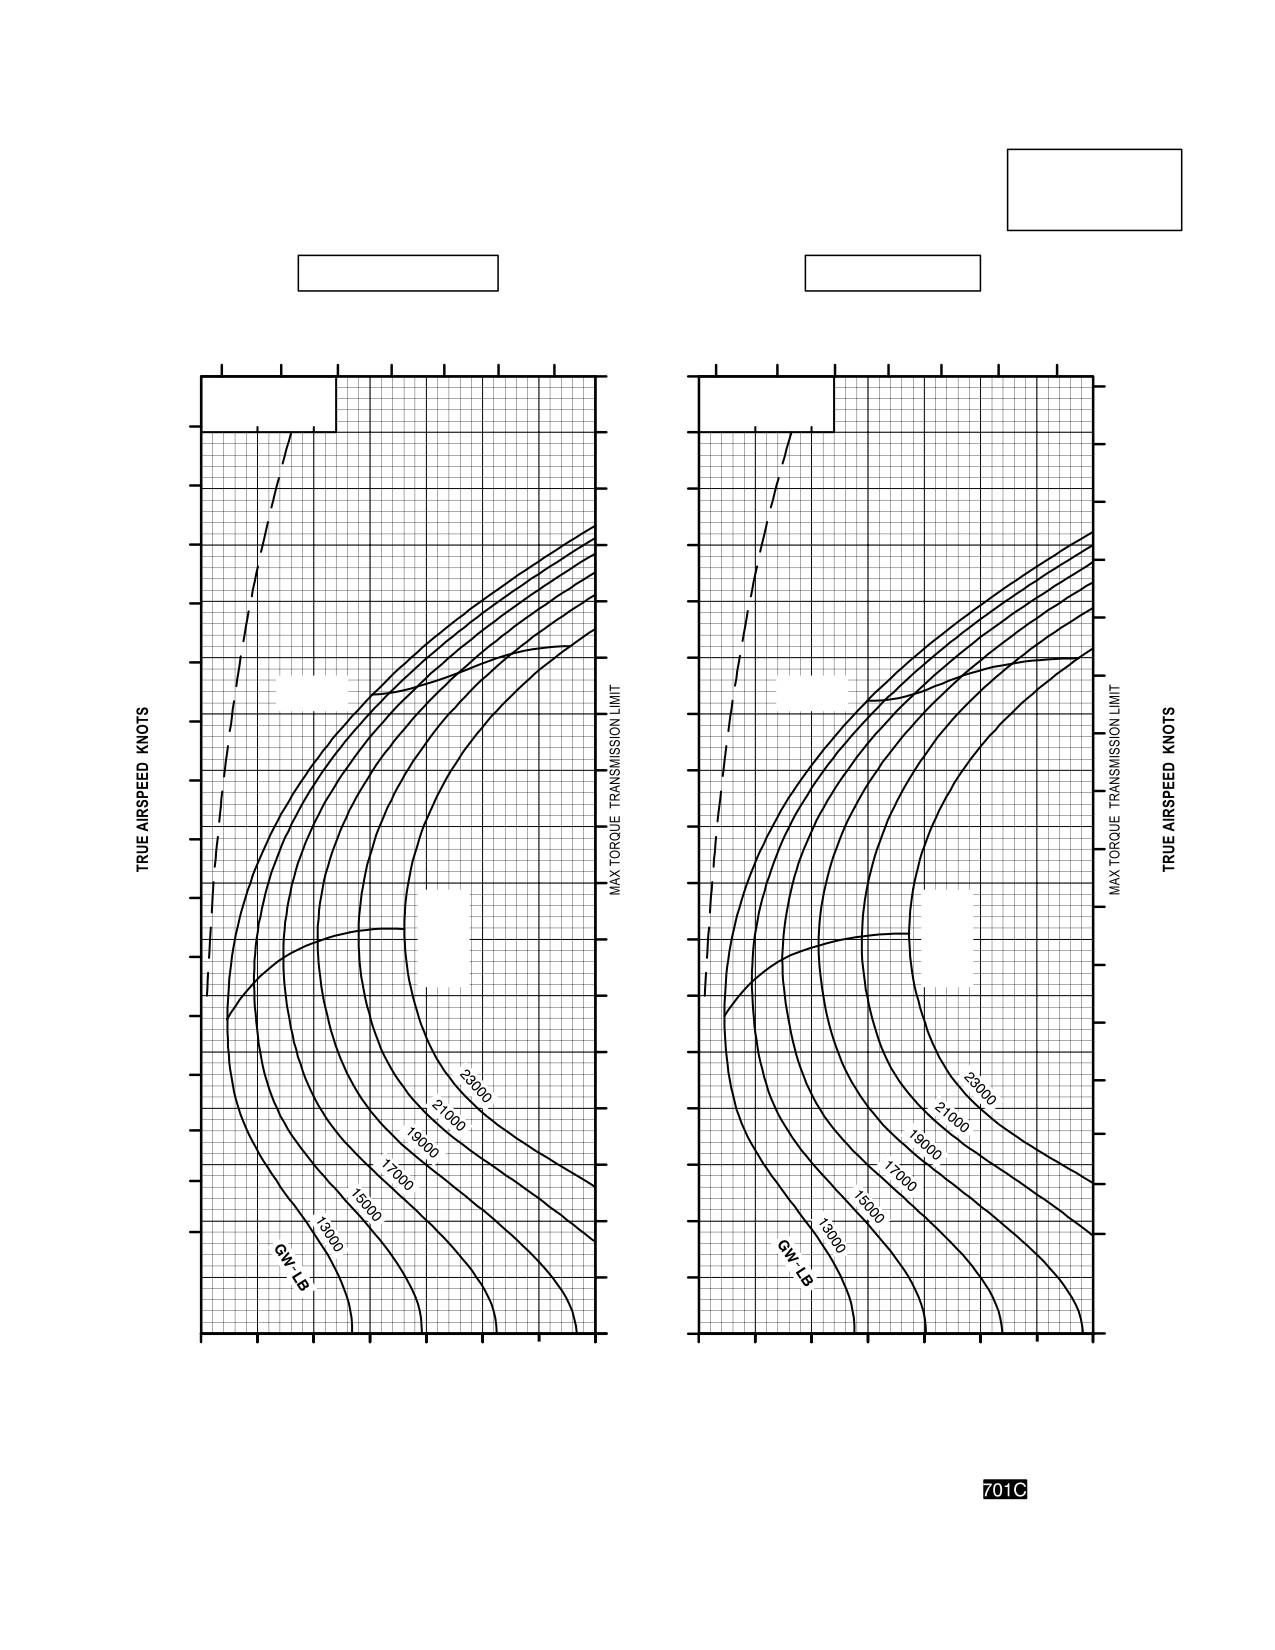
TM 1-1520-251-10
CRUISE
CRUISE
AH64D
PRESSURE ALTITUDE SEA LEVEL
T700GE701C
101% NR RPM, 8 HELLFIRE CONFIGURATION, JP8 FUEL
FAT = 10°C
FAT = 0°C
INDICATED
AIRSPEED
TOTAL FUEL FLOW LB/HOUR
TOTAL FUEL FLOW LB/HOUR
KNOTS
700
900
1100
1300
700
900
1100
1300
170
∆ Q %
∆ Q %
170
∆ F = 10.0 SQ FT
∆ F = 10.0 SQ FT
160
0
10
20
0
10
20
160
160
150
150
150
140
140
140
130
130
130
120
120
120
MAX
MAX
RANGE
RANGE
110
110
110
100
100
100
90
90
90
80
80
MAX
MAX
80
R/C
R/C
OR
70
OR
70
MAX
MAX
70
END
END
60
60
60
50
50
50
40
40
40
30
30
30
20
20
20
10
0
30
40
50
60
70
80
90
100
30
40
50
60
70
80
90
100
INDICATED TORQUE PER ENGINE %
INDICATED TORQUE PER ENGINE %
DATA BASIS: DERIVED FROM FLIGHT TEST AND ENGINE MODEL SPEC NO. E1290, 15 APRIL 1988
LBA0199
Figure 7A-19. Cruise Chart, Sea Level, - 10°C and 0°C (sheet 3 of 6)
Use or disclosure of this information is subject to the restriction(s) on the title page of this document.
7A-27
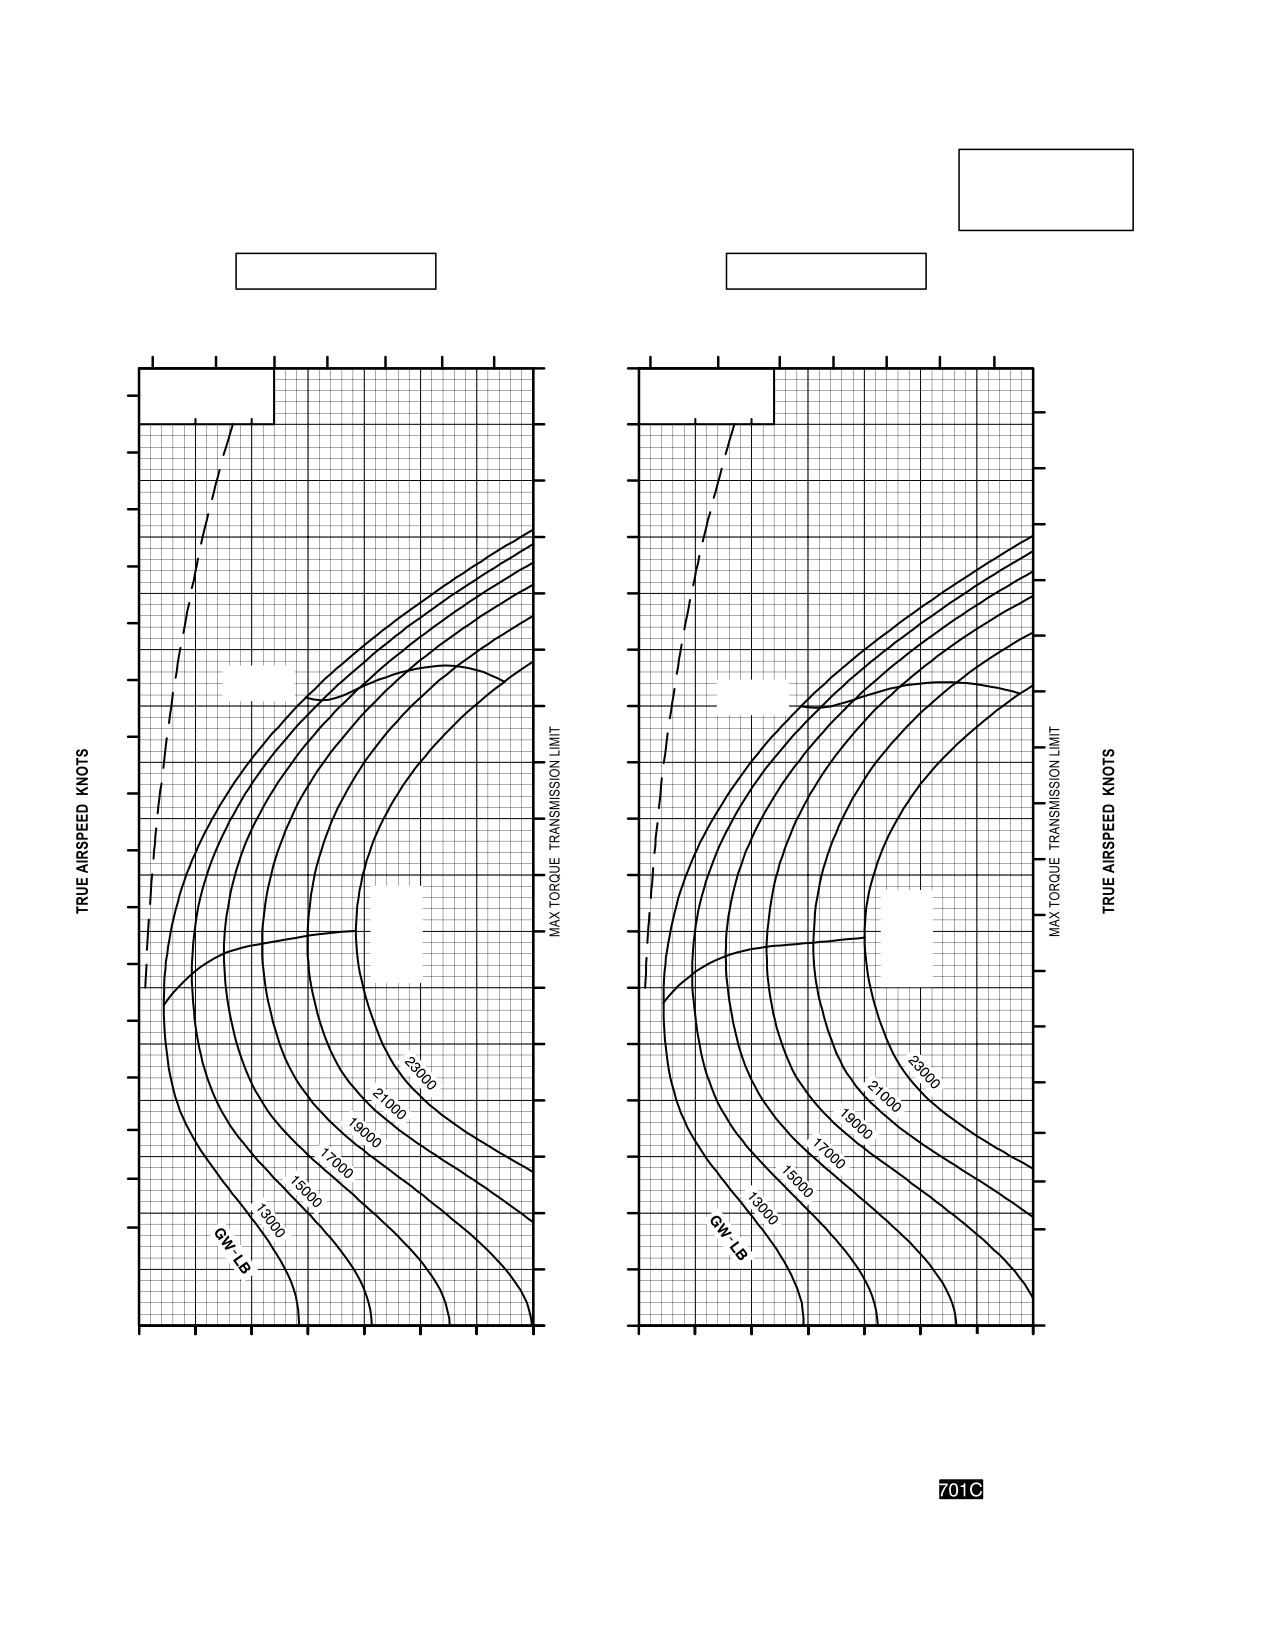
TM 1-1520-251-10
CRUISE
CRUISE
AH64D
PRESSURE ALTITUDE SEA LEVEL
T700GE701C
101% NR RPM, 8 HELLFIRE CONFIGURATION, JP8 FUEL
FAT = +10°C
FAT = +20°C
INDICATED
TOTAL FUEL FLOW LB/HOUR
AIRSPEED
TOTAL FUEL FLOW LB/HOUR
KNOTS
700
900
1100
1300
700
900
1100
1300
170
∆ Q %
∆ Q %
170
∆ F = 10.0 SQ FT
∆ F = 10.0 SQ FT
0
10
20
0
10
20
170
160
160
160
150
150
150
140
140
140
130
130
130
120
MAX
120
RANGE
MAX
120
110
RANGE
110
110
100
100
100
90
90
90
80
MAX
MAX
80
R/C
80
R/C
OR
70
OR
MAX
MAX
70
70
END
END
60
60
60
50
50
50
40
40
40
30
30
30
20
20
20
10
0
30
40
50
60
70
80
90
100
30
40
50
60
70
80
90
100
INDICATED TORQUE PER ENGINE %
INDICATED TORQUE PER ENGINE %
DATA BASIS: DERIVED FROM FLIGHT TEST AND ENGINE MODEL SPEC NO. E1290, 15 APRIL 1988
LBA0200
Figure 7A-19. Cruise Chart, Sea Level, +10°C and +20°C (sheet 4 of 6)
Use or disclosure of this information is subject to the restriction(s) on the title page of this document.
7A-28
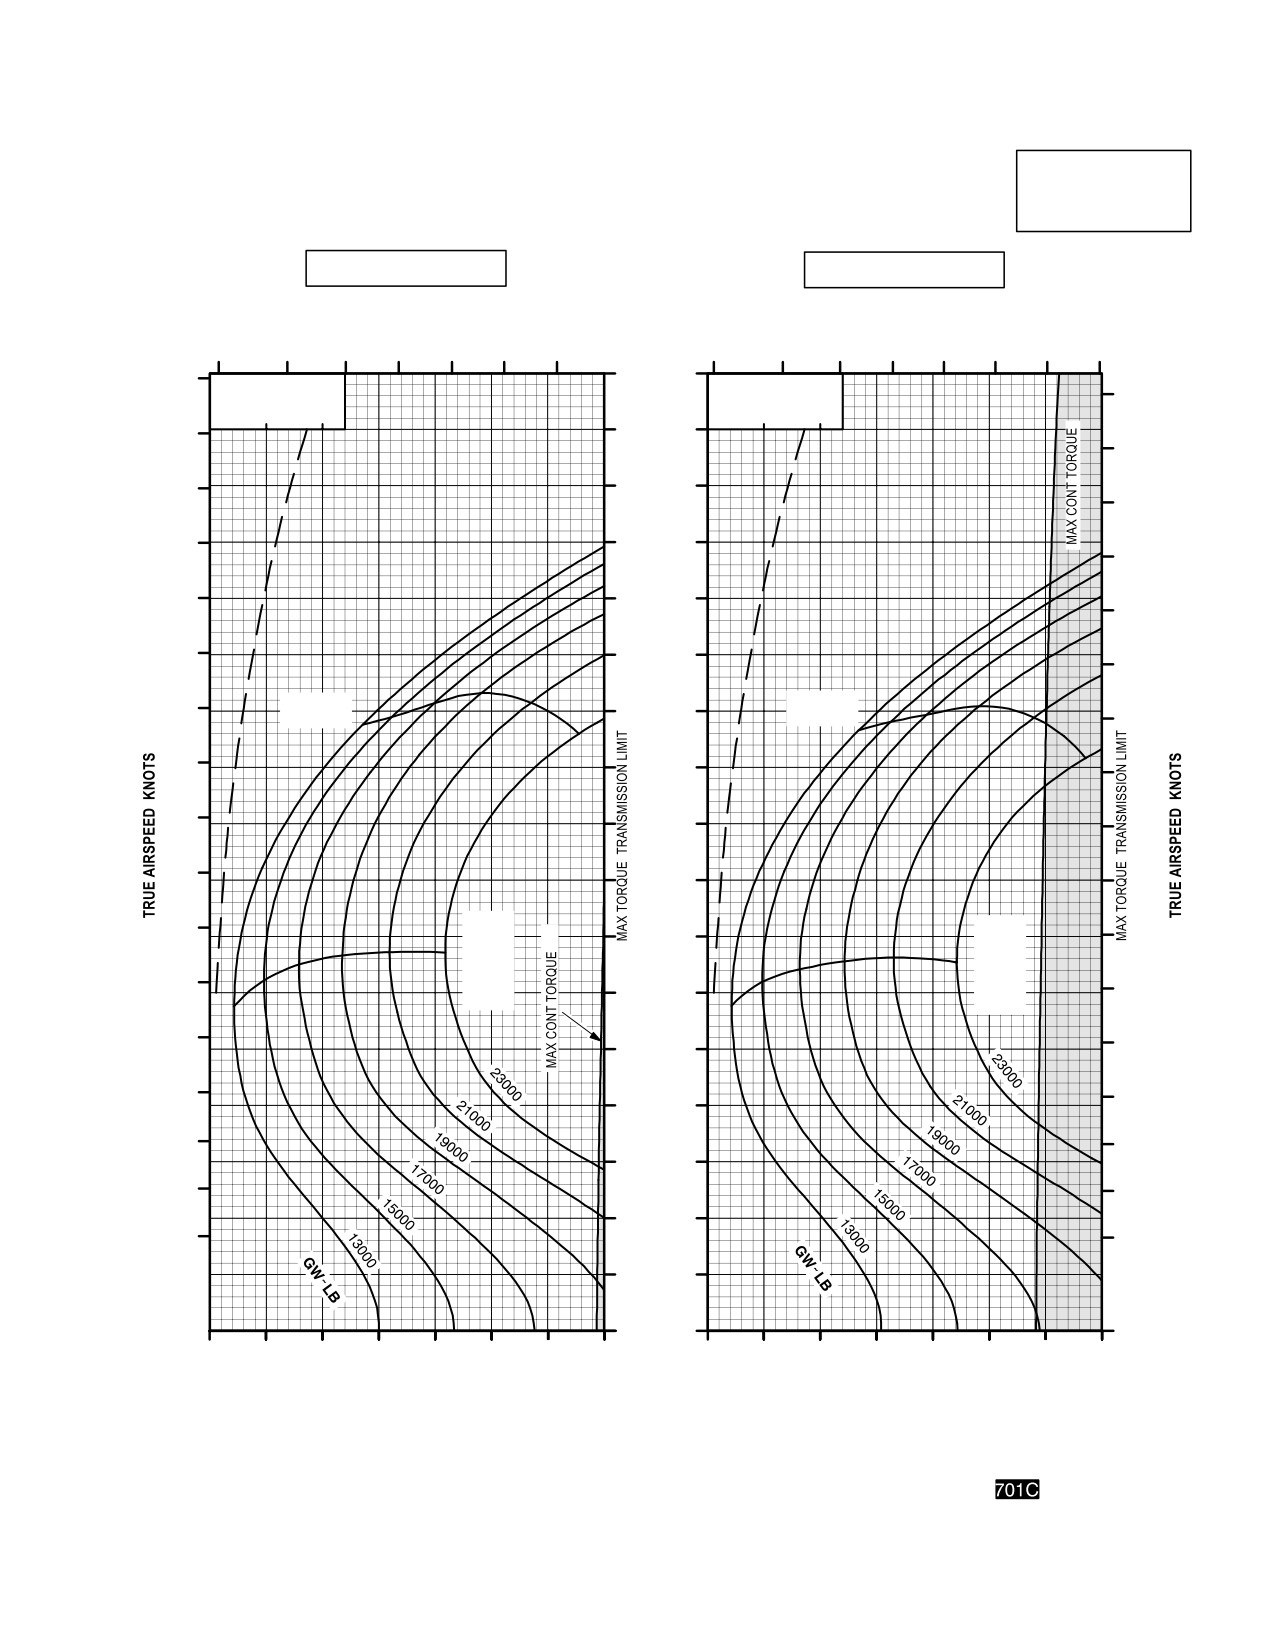
TM 1-1520-251-10
CRUISE
CRUISE
PRESSURE ALTITUDE SEA LEVEL
AH64D
T700GE701C
101% NR RPM, 8 HELLFIRE CONFIGURATION, JP8 FUEL
FAT = +30°C
FAT = +40°C
INDICATED
TOTAL FUEL FLOW LB/HOUR
AIRSPEED
TOTAL FUEL FLOW LB/HOUR
KNOTS
700
900
1100
1300
700
900
1100
1300
170
180
∆ Q %
∆ Q %
180
∆ F = 10.0 SQ FT
∆ F = 10.0 SQ FT
0
10
20
0
10
20
170
160
170
160
150
160
150
140
150
140
130
140
130
120
130
MAX
MAX
120
110
RANGE
RANGE
120
110
100
110
100
90
100
90
80
90
80
MAX
MAX
70
80
R/C
R/C
OR
OR
70
MAX
MAX
60
70
END
END
60
60
50
50
50
40
40
40
30
30
30
20
20
20
10
0
30
40
50
60
70
80
90
100
30
40
50
60
70
80
90
100
INDICATED TORQUE PER ENGINE %
INDICATED TORQUE PER ENGINE %
DATA BASIS: DERIVED FROM FLIGHT TEST AND ENGINE MODEL SPEC NO. E1290, 15 APRIL 1988
LBA0201
Figure 7A-19. Cruise Chart, Sea Level, +30°C and +40°C (sheet 5 of 6)
Use or disclosure of this information is subject to the restriction(s) on the title page of this document.
7A-29
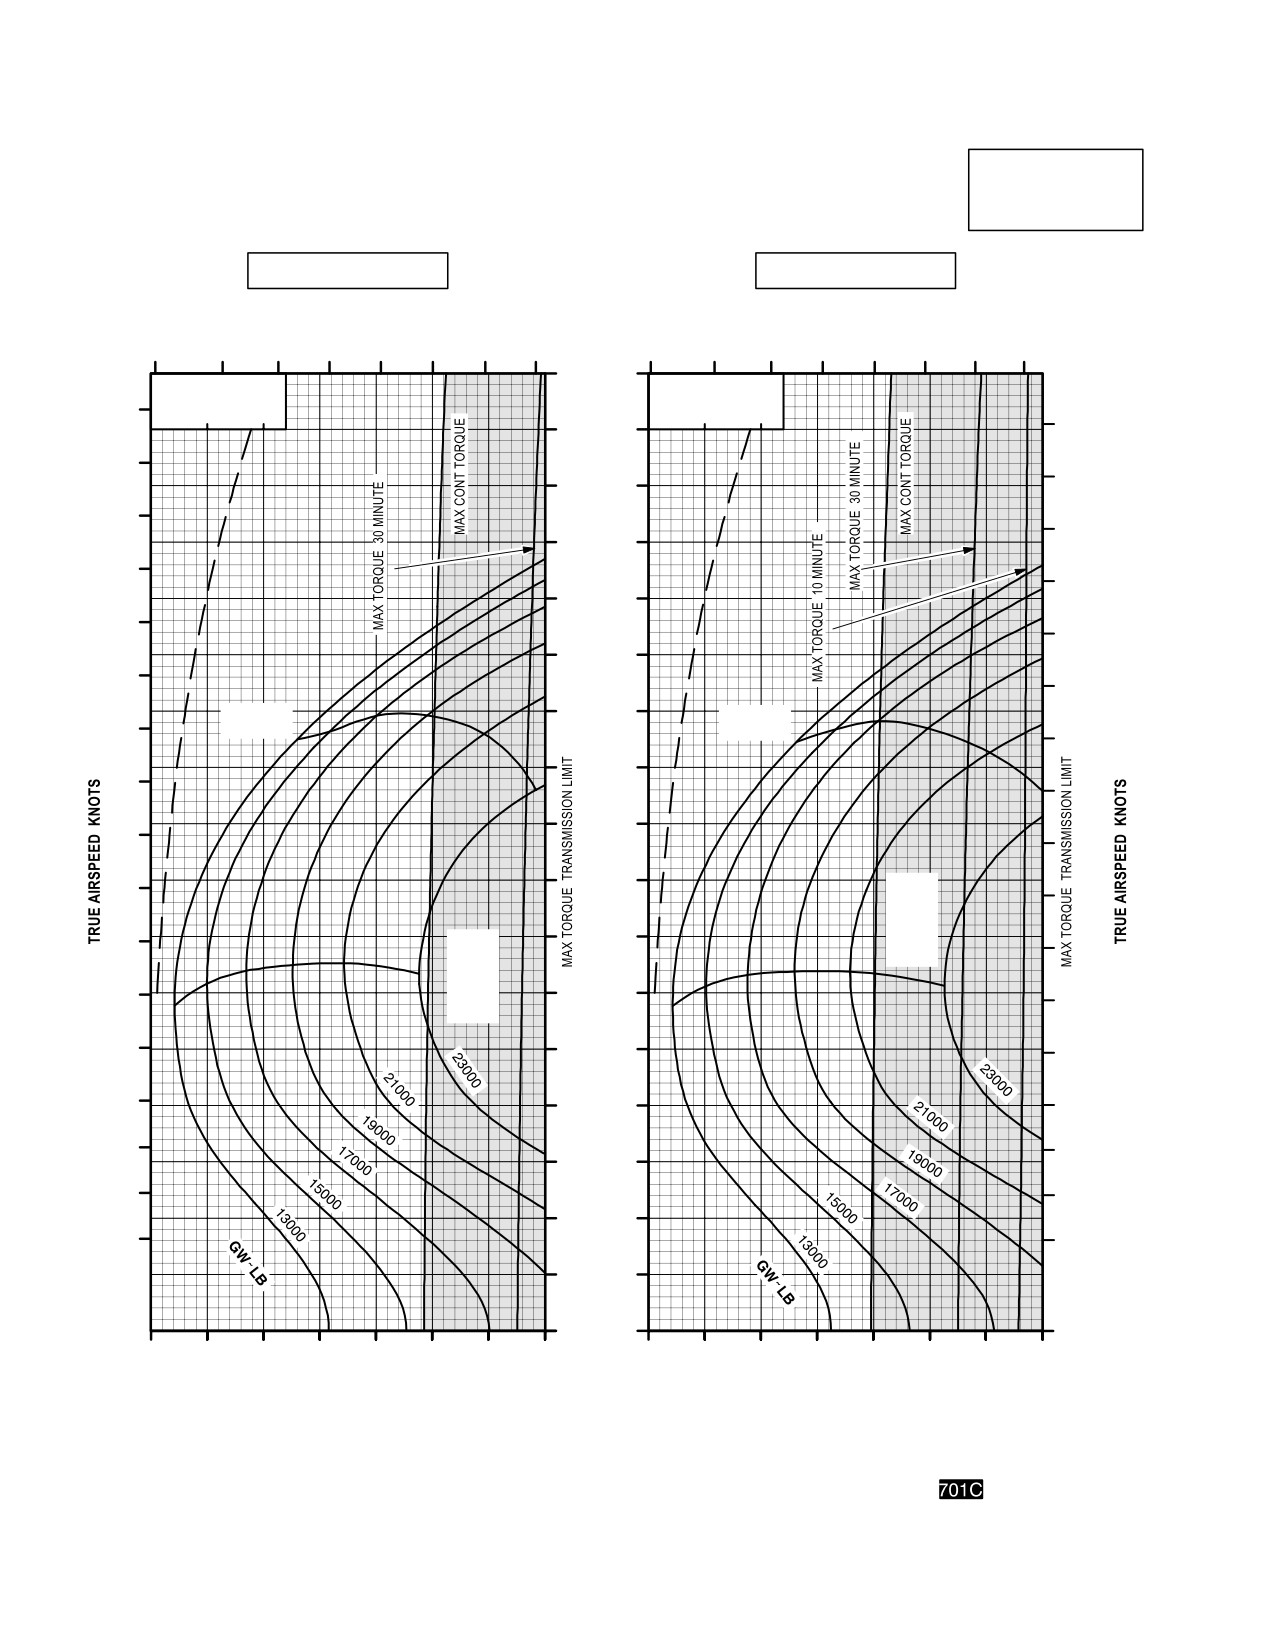
TM 1-1520-251-10
CRUISE
CRUISE
AH64D
PRESSURE ALTITUDE SEA LEVEL
T700GE701C
101% NR RPM, 8 HELLFIRE CONFIGURATION, JP8 FUEL
FAT = +50°C
FAT = +60°C
INDICATED
TOTAL FUEL FLOW LB/HOUR
AIRSPEED
TOTAL FUEL FLOW LB/HOUR
KNOTS
700
900
1100
1300
700
900
1100
1300
170
∆ Q %
∆ Q %
∆ F = 10.0 SQ FT
∆ F = 10.0 SQ FT
180
0
10
20
0
10
20
180
160
170
170
150
160
160
140
150
150
130
140
140
120
130
130
MAX
110
MAX
120
RANGE
RANGE
120
100
110
110
90
100
100
80
90
MAX
90
R/C
OR
80
MAX
70
MAX
80
R/C
END
OR
70
MAX
60
70
END
60
50
60
50
50
40
40
40
30
30
30
20
20
20
10
0
30
40
50
60
70
80
90
100
30
40
50
60
70
80
90
100
INDICATED TORQUE PER ENGINE %
INDICATED TORQUE PER ENGINE %
DATA BASIS: DERIVED FROM FLIGHT TEST AND ENGINE MODEL SPEC NO. E1290, 15 APRIL 1988
LBA0202
Figure 7A-19. Cruise Chart, Sea Level, +50°C and +60°C (sheet 6 of 6)
Use or disclosure of this information is subject to the restriction(s) on the title page of this document.
7A-30
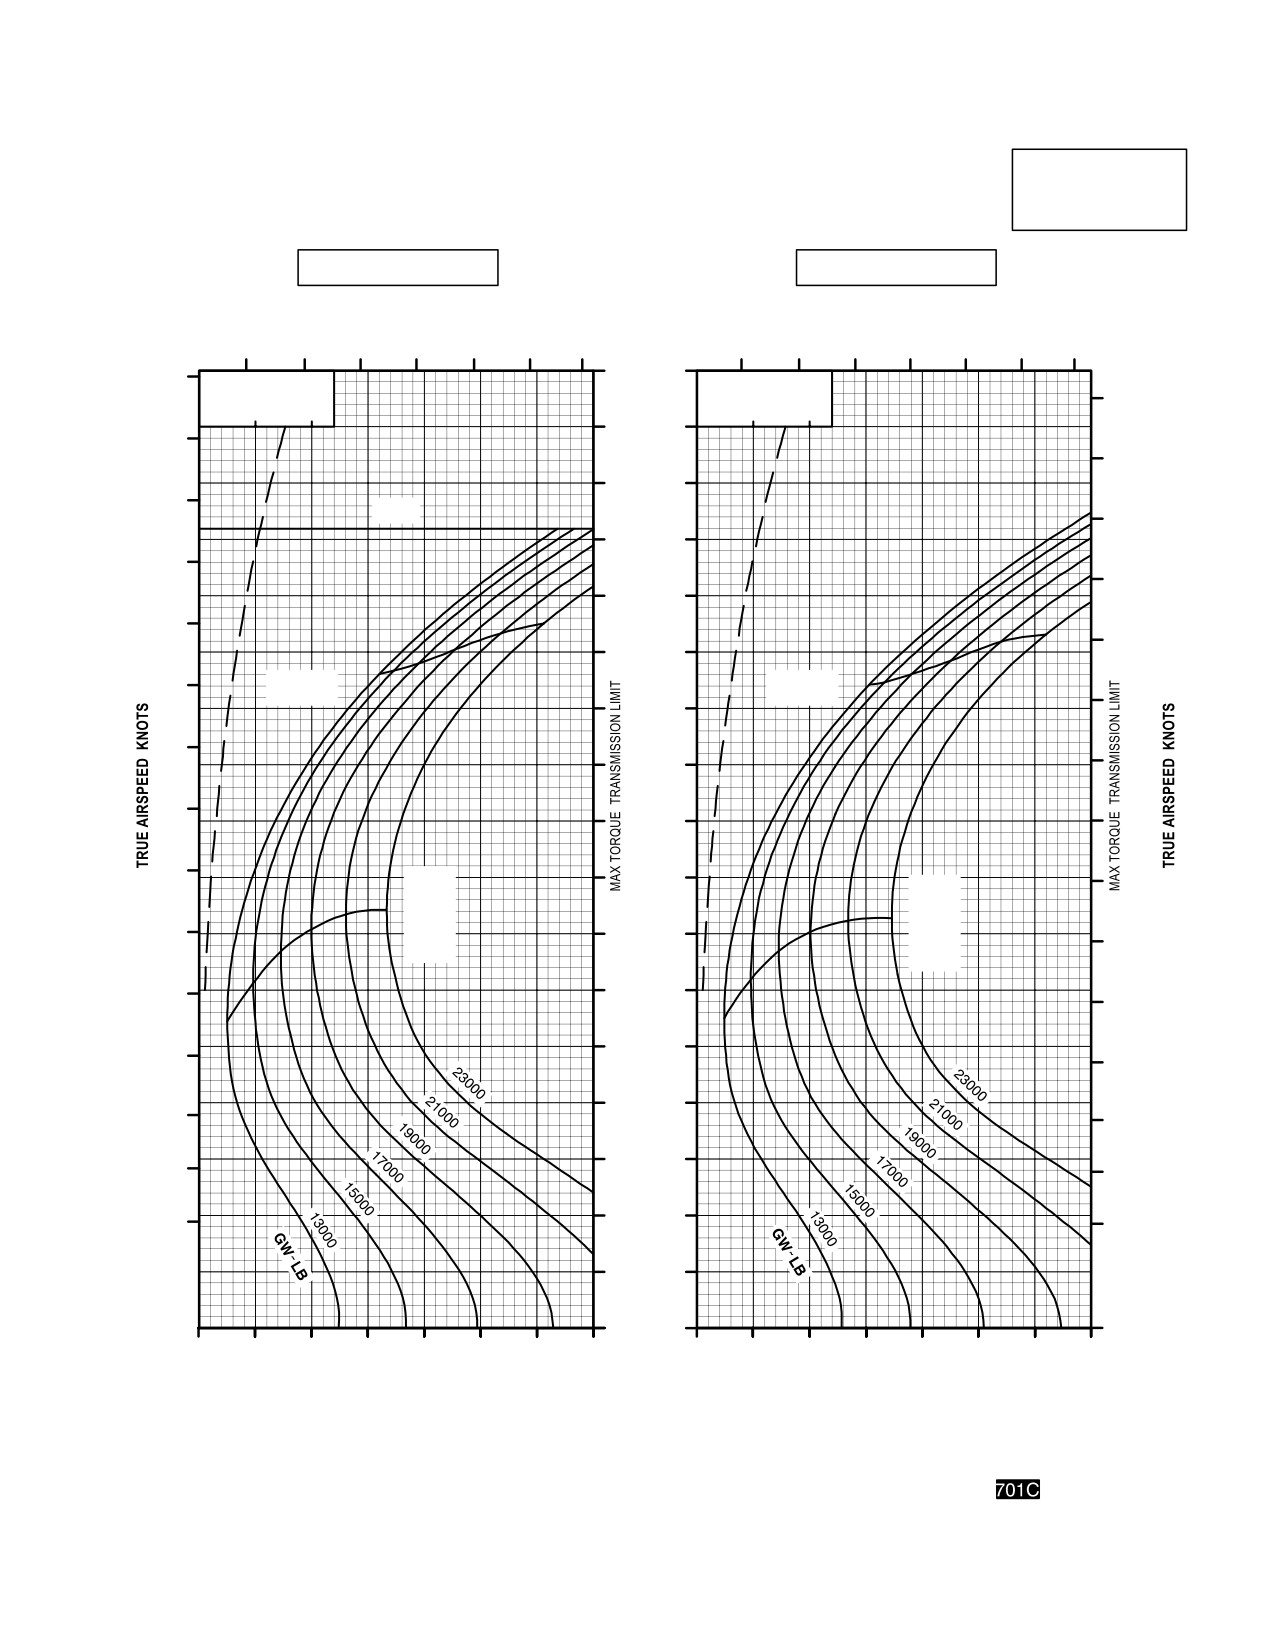
TM 1-1520-251-10
CRUISE
CRUISE
AH64D
PRESSURE ALTITUDE 2000 FEET
T700GE701C
101% NR RPM, 8 HELLFIRE CONFIGURATION, JP8 FUEL
FAT = 50°C
FAT = 40°C
INDICATED
AIRSPEED
TOTAL FUEL FLOW LB/HOUR
TOTAL FUEL FLOW LB/HOUR
KNOTS
700
900
1100
1300
700
900
1100
1300
170
160
∆Q %
∆ Q %
∆ F = 10.0 SQ FT
∆ F = 10.0 SQ FT
160
0
10
20
0
10
20
160
150
150
150
140
V
NE
140
140
130
130
130
120
120
120
MAX
MAX
110
RANGE
RANGE
110
110
100
100
100
90
90
90
80
MAX
80
80
MAX
R/C
R/C
OR
70
OR
MAX
70
MAX
70
END
END
60
60
60
50
50
50
40
40
40
30
30
30
20
20
20
10
0
30
40
50
60
70
80
90
100
30
40
50
60
70
80
90
100
INDICATED TORQUE PER ENGINE %
INDICATED TORQUE PER ENGINE %
DATA BASIS: DERIVED FROM FLIGHT TEST AND ENGINE MODEL SPEC NO. E1290, 15 APRIL 1988
LBA0203
Figure 7A-20. Cruise Chart, 2,000 Feet, - 50°C and - 40°C (sheet 1 of 6)
Use or disclosure of this information is subject to the restriction(s) on the title page of this document.
7A-31