PowerWorld Simulator version 11. Manual - page 3
Copying Onelines to Other Programs
The onelines can be easily copied to other programs. This allows you to add PowerWorld onelines to your word
processor documents or slide presentations. The simplest way to copy a oneline diagram to another program is to use
the Windows Clipboard. This is accomplished as follows:
· In Simulator or Viewer, zoom and/or pan the display to the portion of the oneline diagram you would like to copy.
· Right-click on an empty portion of the oneline to display the local menu.
· Select Copy Window to Clipboard menu item. This places a copy of the oneline into the Window's clipboard.
· In the other program, use Paste or Paste Special to copy the contents of the clipboard into that program. The
oneline is pasted into the program using the Metafile format.
In addition, oneline diagrams can also be saved as image files by right-clicking on an empty portion of the diagram and
choosing Export Image to File.
62
Using Oneline Diagrams
GIS Tools
Great Circle Distance Dialog
To find the Great Circle Distance between any two points of longitude, latitude, select Tools > GIS Tools > Great
Circle Distance and the Great Circle Distance Dialog will be displayed. This can be done in Edit or Run Mode.
The Great Circle Distance Dialog allows the calculation of distance between two points of longitude, latitude. The
Great Circle Distance Calculation assumes that the earth is a sphere and makes no adjustments for the actual
flattening of the earth. The two longitude, latitude points can either be entered manually for any two valid points or can
be chosen from valid longitude, latitude values stored with either buses or substations. Valid longitude values are
between -180 and 180 degrees. Valid latitude values are between -90 and 90 degrees. The calculated distance is
given in either kilometers or miles.
63
Convert XY to LL Dialog
To convert x,y screen coordinates of buses and substations to longitude, latitude coordinates select Tools > GIS
Tools > Convert Screen X,Y to Longitude,Latitude from the menu. The Convert X,Y to Longitude, Latitude Dialog
will be displayed. This can be done in either Edit or Run Mode. The dialog will show which map projection is currently
in use for the oneline. Users should be careful to not change the map projection once one has been established so
that all objects on the oneline are consistently using the same projection. If no projection has been set, the dialog
shows ‘None (x,y)’ as the map projection, then selecting a map projection will establish that map projection as the
current oneline map projection.
Map Projection
None (x,y)
No map projection is in use.
North American (simple conic)
This projection is better when dealing with longitude, latitude points in North America. This is the projection that
has been used in Simulator for years in defining geographic borders and placing then on a one-line.
Entire World (Mercator)
This projection is better when dealing with longitude, latitude points spread throughout the world.
Click Convert X,Y to Longitude.Latitude to complete the conversion. The longitude, latitude values converted from
screen x, y coordinates can be viewed on the bus and substation case information displays or the information dialogs.
64
Using Oneline Diagrams
Geography/Coordinates
The option is available to display screen coordinates in longitude, latitude instead of x,y. This option can be set from
Options > Oneline Display Options under the Geography/Coordinates tab.
Map Projection in Use
The map projection indicates which projection has been selected for inserting objects on the oneline. Users should
be careful to not change a projection once one has been established. Otherwise, there is the risk that different
objects will be inserted with different projections.
Show longitude, latitude coordinates when showing x, y coordinates
Longitude, latitude coordinates will be displayed anywhere that x,y screen coordinates are normally displayed.
65
Shape File Import
Simulator allows you to import ESRI shapefiles (*.shp/*.dbf pairs) as a group of background lines or points on an
oneline diagram. To open the GIS Shapefile Data Dialog, choose the menu option Insert > Background Graphic >
Insert GIS Data from Shapefile .
The GIS Shapefile Data Dialog has the following sections:
Control
Modify Shapes or Projection
Modify Colors and Format
Shapefile Objects
66
Using Oneline Diagrams
GIS Shapefile Data: Control
This is the first page of the GIS Shapefile Data dialog, which can be opened from Insert > Background Graphic >
Insert GIS Data from Shapefile . The control page contains the controls for reading a shapefile into Simulator, and
provides some basic information on the shapes read from the file.
Read in Shapefile
Pressing this button will allow you to choose a shapefile, and will load it into Simulator for placement on the
currently selected oneline diagram.
Shapefile Information
Once the shapefile has been loaded into memory, this section will be populated with general information on the
number of shapes loaded, and the maximum and minimu m X and Y values (usually in longitude and latitude.)
Transfer Shapefile Objects to Oneline
If you are ready to place the shapes on the oneline diagram, but want to continue working with existing shapes or
read more shapes from another file, press the Transfer Shapes to Oneline and Clear button. This will keep the
dialog open following the transfer. It also gives you options of what should happen to the current shapes in memory
after you have transferred them to the diagram. You can choose to clear none of the shapes, which will keep them
all in memory, clear all the shapes from memory, or to clear only the shapes that were transferred. The last choice
relates to options you have on the Shapefile Objects page regarding whether or not to transfer certain shapes from
the shapefile to the diagram.
Insert Into Layer
Before transferring the shapes to the oneline diagram, you can choose which layer the shapes should be assigned
to. If you wish to place the shapes into a new undefined layer, click on the Define Layer button to access the
Screen Layers table.
Transfer Shapes to Oneline and Close
If you wish to transfer the currently loaded shapes to the oneline and close the dialog (clearing the shapes from
memory), press this button to complete the process.
67
GIS Shapefile Data: Modify Shapes or Projection
Before placing the shapes read from a shapefile from the Control page, you can modify the XY attributes of the shapes
before they are placed from the Modify Shapes or Projection page.
Map Projection
There are two map projections you can choose from when placing the shapes onto an oneline diagram. The
choices are:
· North American (simple conic)
· Entire World (Mercator)
Once you have selected which projection to use, click on the Convert to Specified Map Projection button to
process the conversion on the shapes currently in memory.
Shift/Scale Shapefile X/Y Data
You also have to option to shift the XY coordinates of shapes or scale them by scalar values. To shift shapes, enter
scalar shift values for the X value and Y value and press the Shift XY Data button. To scale the XY coordinates,
enter scalar scaling factors for the X and Y value, and press the Scale XY Data button.
68
Using Oneline Diagrams
GIS Shapefile Data: M odify Colors and Format
Before placing the shapes read from a shapefile from the Control page, you can modify the appearance attributes of
the shapes from the Modify Colors and Format page.
Change Shape Format Characteristics
Point Size
For points read from the shapefile, you can increase the size of the points.
Line/Border Thickness
Choose the pixel thickness of the shapefile lines when transferred to the oneline diagram.
Line/Border Color
Set the line color of the shapefile lines when transferred to the oneline diagram.
Fill Color for Points/Polygons
Set the fill color of the shapefile points and polygons when transferred to the oneline diagram. The box labeled
Use Fill Color must be checked as well.
Stack Level
Indicate which stack level should be applied to the shapes when they are transferred to the oneline diagram.
Immobile
Check this box if you wish for the shape file objects to be immobile once they are transferred to the oneline
diagram. This will prevent you from inadvertently selecting and moving the shapefile objects on the oneline
diagram while in Edit mode.
Set all shape format attributes to the values above
Once you have finished changing the format settings for the shapes, press this button to apply them for the
transfer of shapes to the oneline diagram.
Automatic Color Mapping
Available Attributes
To customize an attribute of the shapefile, select an attribute from the list read from the dbf file.
Color Map
Select a color map to apply to the selected attribute. To modify existing or create new color maps, click on the
Modify Color Maps button.
Change Border Color, Change Fill Color
These two boxes allow you to choose if the color map selected should apply to the border color, the fill color, or
both.
Change Color Based on Attribute/Color M ap
Once you have finished setting the color map for a selected attribute, press this button to apply the settings
before the transfer of shapes to the oneline diagram.
69
GIS Shapefile Data: Shapefile Objects
Before placing the shapes read from a shapefile from the Control page, you can flag shapes for inclusion in the
transfer and customize the appearance attributes of specific shapes from the Shapefile Objects page.
This page will be blank until you have actually read a shapefile into memory. Once you have done so, you will see a
list of all shapes read from the file. The table allows you to customize the appearance and attributes of a specific
shape, similar to the options on the Modify Colors and Format page.
In addition, you also can choose to include or exclude shapes from the transfer to the oneline diagram. This gives you
the greatest flexibility for hand-picking which shapes you want to add to an oneline diagram.
70

Using Oneline Diagrams
Changing the Oneline View
Oneline Screen Coordinates
Onelines can be any size and can contain any number of objects. The size and position of objects on the screen are
specified in terms of x -y "oneline screen coordinates." When the zoom level is 100% the size of the oneline in screen
coordinates is 100 by 100. More generally, the size of the oneline is 1002 divided by the zoom level in both the x and y
directions.
The default screen center is the point (50,50) but this can be easily changed (See Oneline Panning and Zooming.)
Negative screen coordinates are allowed. Usually you will not have to be concerned about an object's location in
screen coordinates.
The Status Bar displays the current cursor screen coordinates while in Edit Mode.
Status Bar Showing Screen Coordinates
71
Oneline Zooming and Panning
All oneline diagrams permit zooming and panning. Zooming and panning are very important tools for building and
investigating large oneline diagrams that occupy more than a single screen of viewing area. Moreover, the display of
various objects can be set to depend on the zoom level. See Oneline Conditional Display of Objects for more
information on this feature.
The following mechanisms are provided for zooming or panning a oneline:
Zooming on Onelines
Zooming involves adjusting the oneline diagram's display area by changing the magnification of the view. Zoom in
on a oneline to have the screen display less of the complete oneline diagram, and zoom out on a oneline to have
the screen display more of the complete oneline diagram.
To zoom on a oneline diagram using the keyboard, follow these instructions:
· Use CTRL-up arrow to zoom in
· Use CTRL-page up to zoom in quickly
· Use CTRL-down arrow to zoom out
· Use CTRL-page down to zoom out quickly
· The Zoom Toolbar offers additional zooming options:
· Use the Zoom in on Area button of the toolbar to select a region on which to zoom.
· Use the Show Full Oneline button of the toolbar to zoom the display out to show the entire oneline.
· Use the Find button of the toolbar to display the Pan/Zoom Dialog.
· Use the Save View button of the toolbar to display the Save View Dialog, or click on the drop down arrow on the
Save View button to choose from a list of saved views.
· Use the Rectangular Zoom Selector to select a section of the diagram to zoom into using a selection box.
After clicking button (symbolized with a magnifying glass over a dashed rectangle,) left click and hold the mouse
button down on the diagram, drag the mouse to select part of the diagram inside a box, then release the mouse
button. Simulator will zoom into the region selected inside the box.
Finally, clicking the '+' button on the Pan/Zoom Toolbar of the PowerWorld Toolbar will zoom in on the oneline,
while clicking the '-' button will zoom out.
Panning on onelines
Panning moves the screen's focus point around the oneline diagram. You can pan left, right, up, or down to view
different portions of the complete oneline diagram.
To pan around the oneline using the keyboard, follow these instructions:
· Use the arrow keys to move in the desired direction
· Use page up to move up quickly
· Use page down to move down quickly
· Use the Home key to move left quickly
· Use the End key to move right quickly
· Left-click and hold the mouse button down anywhere on the background of the diagram. Make sure you do not
click on an object on the diagram. While holding the left mouse button down, drag the mouse in any direction to
"drag" the diagram in that direction.
You can also use the Pan/Zoom Dialog to pan to a specific location, or even to a specific bus. You can display the
Pan/Zoom Dialog either by pressing the Pan/Zoom Button on the Zoom Toolbar of the PowerWorld Toolbar or by
selecting Find Bus On Oneline or Pan/Zoom Control from the oneline diagram's local menu.
72
Using Oneline Diagrams
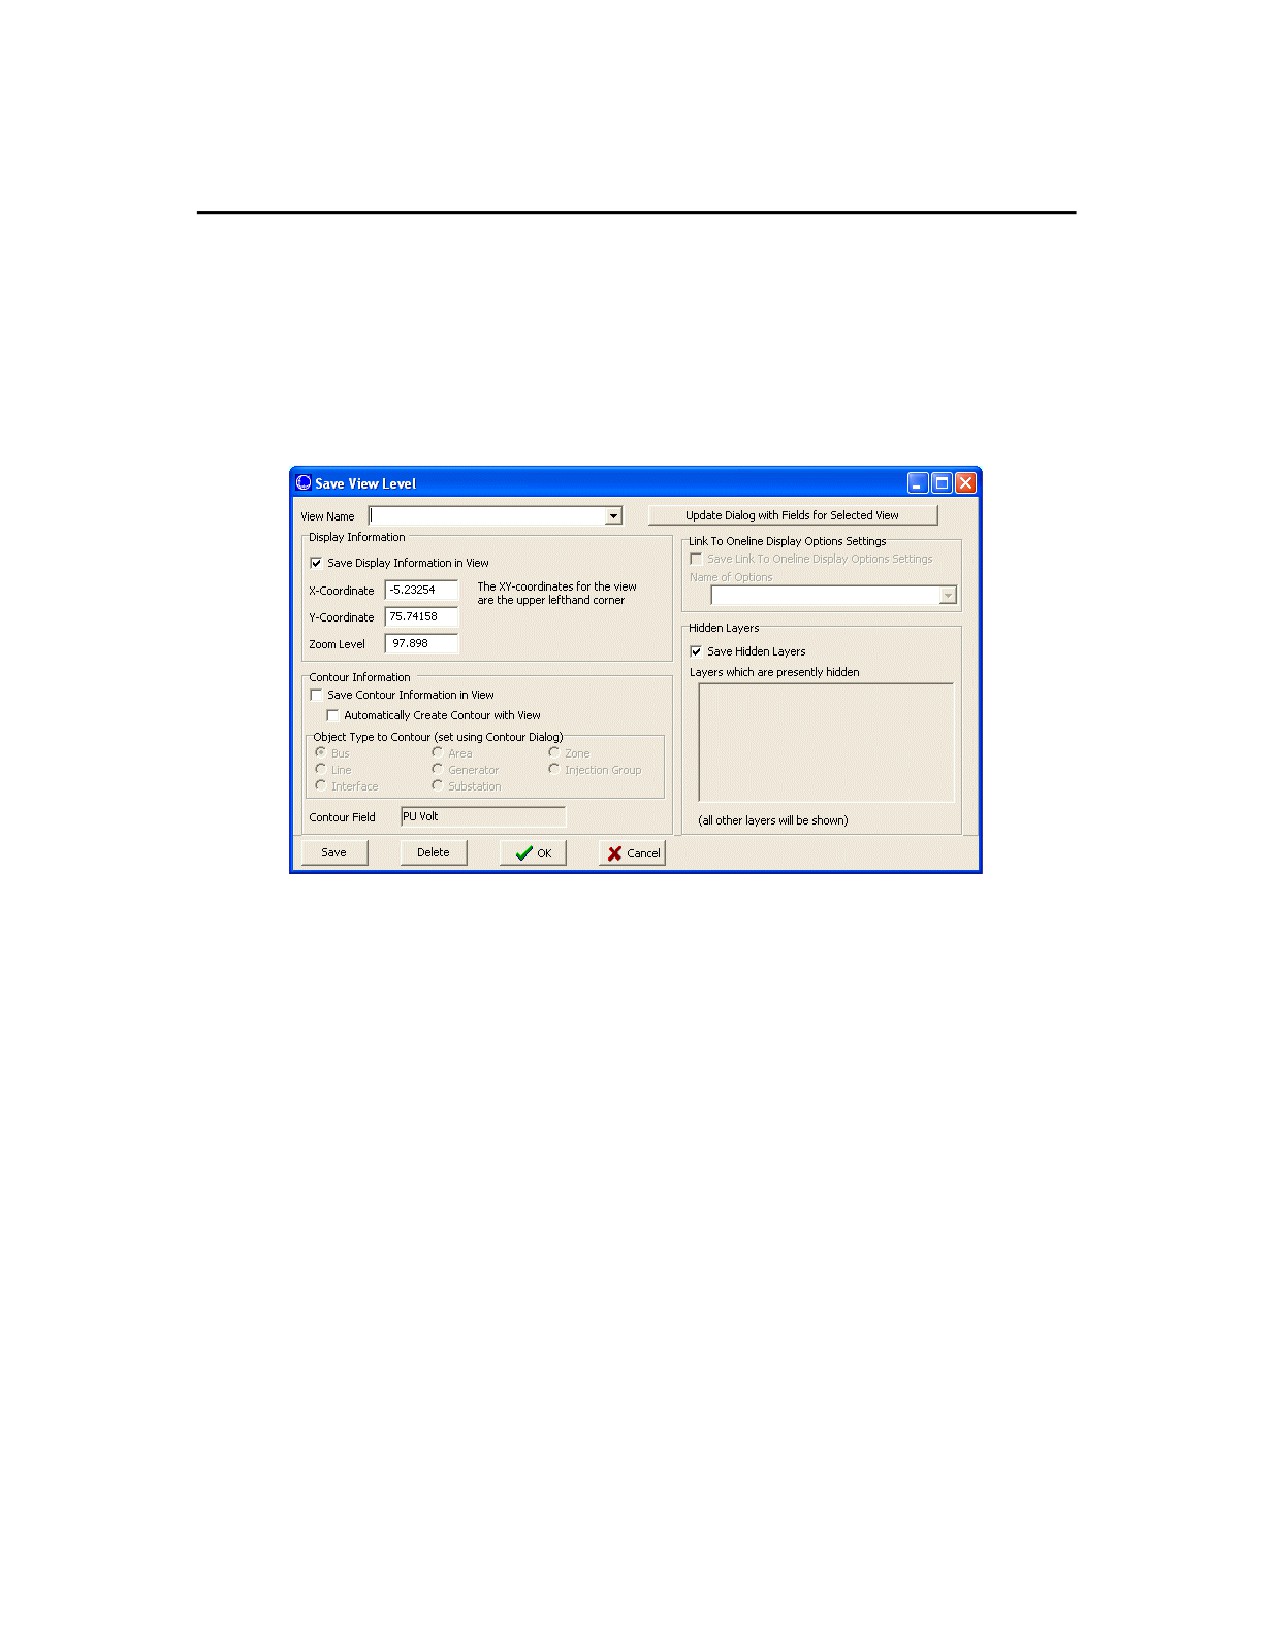
Save View Level Dialog
The Save View Level Dialog is used to save an (x,y) location and zoom level, contour description, and/or hidden
layer application for a oneline diagram in an easily accessible list for quick recall and application to the diagram. This
dialog can be called by selecting the Save/Edit/Delete View option from the oneline local menu, or by clicking the
Save View button on the Zoom Toolbar.
Recalling a saved view can be done by either right-clicking on the background to access the oneline local menu and
choosing a view from the Go To View list, or by clicking on the drop down arrow on the Save View button and
selecting a view from the resulting list. Selecting a saved view automatically moves the oneline diagram location to
the (x,y) coordinates and zoom level, applies a stored contour, and/or applies hidden layers stored with the selected
view.
Save View Level Dialog
This dialog can be used for creating a new view, editing an existing view, or deleting an existing view. The Save View
Level Dialog has the following options:
View Name
This is the name that the view will be stored under in the saved view list. This must be a unique name for each view
saved with the oneline diagram. By default this field is blank. To edit an existing view, choose the desired view
from the drop down list.
Update Dialog with Fields for Selected View
If you wish to display the fields for a different view than being presently displayed, select the name of the view from
the View Name list and click on this button to update the information in the dialog.
Save Display Information in View
When checked, the view will store an x -y coordinate and zoom level to associate with the view. When the view is
selected for display, the diagram will center on the x -y coordinate at the defined zoom level.
X-Coordinate
The x-coordinate for the view. This value will default to the current x -coordinate for the oneline diagram, or
ll
change to a saved value if a saved view is chosen from the View Name drop down list. This value can be modified
by the user.
Y-Coordinate
The y-coordinate for the view. This value will default to the current y -coordinate for the oneline diagram, or
ll
change to a saved value if a saved view is chosen from the View Name drop down list. This value can be modified
by the user.
Zoom Level
The zoom level for the view. This value will default to the current zoom level for the oneline diagram, or will change
to a saved value if a saved view is chosen from the View Name drop down list. This value can be modified by the
user.
73
Save Contour Information in View
If a contour is being displayed when the view is created, you can choose to save the contour information with the
view by checking this box. Saving a contour with a view will display that contour when you switch to that view. You
also have the option of saving a blank contour with the view. This is indicated by a Contour Object of ‘None’ and a
Contour Field of ‘None.’ If you save a blank contour, no contour will be displayed when switching to that view. If
you don’t save any contour with the view, then any existing contour will be applied when switching to that view.
Automatically Create Contour with View
If contour information is stored with the view, checking this box will result in the contour automatically being drawn
when the view is selected for display on the diagram.
Object Type to Contour
This section displays the type of object the stored contour pertains to. This field cannot be changed from this
location.
Contour Field
Displays the type of value the stored contour pertains to. This field cannot be changed from this location.
Link to Oneline Display Options Settings
In the Oneline Display Options in Simulator, you can save various sets of options with a case for quickly recalling
oneline diagram settings by name. This option allows you to include a custom defined option set by name with the
current view. Note that you first must have created and saved a custom set of options for a diagram from the
Oneline Display Options dialog before this option on the Save Views dialog will be enabled.
Save Hidden Layers
Since Simulator allows the use of layers to display or hide objects on the diagram, views also can optionally store
the layer settings when the view is created. The window below this checkbox will list the layers that are presently
hidden on the diagram. When this view is recalled, the layers in this list will be hidden if they were stored with the
view.
Save
This button will save a new view or modify the values for an existing view of the name in the View Name field.
Delete
This button will delete the currently open view from the saved view list. The dialog information will default to the
saved view information of the previous view in the list.
OK
This button will save a new view or modify the values of an existing view of the name in the View Name field, and
will close the Save View Level Dialog.
74
Using Oneline Diagrams
Window Menu Command
The Window menu tree contains several commands that affect the appearance of the windows shown on the screen,
and it lists the children windows that are currently open in Simulator. To make a particular window active (and fully
visible), simply click on its name.
The Window menu tree houses the following commands by default:
Keyboard Shortcuts
It opens the Keyboard Short Cut Actions dialog, which can be used to assoc iate a keyboard shortcut to a oneline
diagram and/or a view of such a oneline diagram.
Tile
Rearranges the open oneline diagrams such that the total window area is divided equally among all of them and
each is completely visible.
Cascade
Rearrange all open windows such that all they appear on top of each other while leaving the title bars visible.
Refresh Displays
Redraws (refreshes) each of the open windows. Simulator usually automatically refreshes the open windows as
necessary. However, this option allows you to trigger the refresh when you want it.
Toolbars
Provides the user control over which toolbars are visible. The submenu lists all available toolbars. Those that are
currently visible are marked with a checkmark. Click on the name of a toolbar toolbar to show or to hide it.
Toolbars > Customize
The Customize Toolbar dialog allows the user to customize specific toolbars to suit its personal needs.
Toolbars > Toolbar Settings > Reset All Toolbars
Resets all the toolbars and menus to the state they were when PowerWorld Simulator was installed.
Toolbars > Toolbar Settings > Save Toolbar Settings
Saves the current settings (such as position and order) of all the toolbars to the specified INI file.
Toolbars > Toolbar Settings > Load Toolbar Settings
Loads the toolbar settings stored in the specified INI file.
Switch to free-floating windows
Choosing this option toggles Simulator from containing all diagrams within the Simulator program shell to all
windows related to Simulator being free-floating on your display.
Toggle Full Screen
Toggle full screen makes the currently selected diagram window switch to full screen mode. Full screen mode will
dedicate the screen to the window, with all other windows, including the Simulator menus and toolbars, to be
hidden. To get back to normal mode, right-click on the diagram in full screen mode and select Toggle Full Screen
from the popup menu.
75
Oneline Conditional Display of Objects
Along with supporting zooming and panning, the onelines permit the conditional display of objects. That is, it is
possible to specify display objects so they are visible only at particular zooming ranges. This enables the oneline to
show additional details as the user zooms in and fewer details when the user zooms out.
Please note that the zoom levels are defined as percentages. If you want an object to display only between 50% and
150%, you must select 50 and 150 as the zoom level boundaries.
This option is available by assigning objects on the diagram to a Layer. Layers can be defined and set to objects on
the Format Multiple Objects dialog.
76

Using Oneline Diagrams
Keyboard Short Cut Actions Dialog
The Keyboard Short Cut Actions dialog allows the user to associate a keyboard shortcut to a determined oneline
diagram, and even to a particular view of that diagram. When the keyboard shortcut is pressed, the oneline diagram is
opened (if it was closed) and brought to the front. When a view is also associated, then the user is taken to such a
view.
To open the Keyboard Short Cut Actions Dialog, select Window > Keyboard Sh ortcuts from the main menu.
Keyboard Short Cut Actions Dialog
The dialog has the following controls:
Keyboard Shortcuts
Lists all the keyboard shortcuts. When selecting a keyboard shortcut, it will show the oneline and the view
associated to the selected keyboard shortcut. If your keyboard has an extra row of function keys, then you can
check the box labeled Include F13-F24. If a shortcut has been defined for the respective key, then it will be
highlighted and a string will summarize the action of the shortcut
Clear All
Clicking this button will delete all the associations of all the listed shortcuts.
Save Shortcut
Click this button after entering a oneline diagram and eventually a view so they can be associated with the selected
keyboard shortcut.
Delete Shortcut
Click this button to delete the associations of the selected keyboard shortcut with any oneline diagram and view.
Oneline and View: Oneline
Shows the path and the name of the oneline diagram which will be opened when the selected keyboard shortcut is
pressed. If the field is blank, then no oneline diagram is associated to the keyboard shortcut. You can click
Browse to find the oneline diagram.
Oneline and View: View
Shows the name of the view belonging to the associated oneline diagram to whic h the user will be taken when the
selected keyboard shortcut is pressed. If the field is blank, then no view is associated to the keyboard shortcut.
Action for already open onelines
If the oneline being requested by the shortcut key is already open, then this option determines what should be done.
Choices are to close the oneline, bring the oneline to the front, or to open a new oneline.
Where to open oneline
When opening a oneline via a shortcut key, you may do one of the following:
· Separate Window (open the oneline as normal)
77
· Separate Window - Toggle Full Screen (open normal and then toggle it to full screen)
· Embed the Active Oneline Window (opens the oneline and embeds it inside the presently active oneline
diagram)
Note: if onelines already exist which have been toggled to full screen, and a short cut key is used to open a window
that will not be toggled to full screen, then all other onelines present open will be switched to normal mode instead
of full screen mode.
Make embedded oneline borderless
When embedding the oneline inside the presently active oneline, this option will make the embedded oneline
borderless.
Size and Location
This specifies the relative size and location you would like the oneline to be opened at. When opening the oneline
normally, the percentage is relative to the size of the container window. When opening the oneline embedded in
the active oneline, the percentage is relative to the size of the active oneline.
Save/Load shortcuts to/from an Auxiliary File
Click the Save button to save all the shortcuts to an auxiliary file. Click the Load button to load the shortcuts saved
in an auxiliary file. The shortcuts saved in the auxiliary file will replace the shortcuts saved in the dialog.
Close
Closes this dialog.
In addition to the shortcuts displayed on this dialog, Simulator also offers standard windows editing shortcuts such as:
Ctrl + x - Cut Command
Ctrl + c - Copy Command
Ctrl + v - Paste Command
78
Using Oneline Diagrams
Printing Oneline Diagrams
Printing Oneline Diagrams
To print a oneline diagram, select File > Print Oneline from the main menu, click the Print Window button on the File
Toolbar, or right-click on the oneline background and select Print Window from the popup menu. This opens the Print
Options Dialog, which you can use to configure the print job, including its size, orientation, border, and title bar. You
can even choose to print a oneline to multiple pages using Simulator's multi-page printing.
79

Print Options Dialog
The Print Options Dialog is used to configure the printing of oneline diagrams (including bus view displays) and of strip
charts. To print a oneline diagram, select File > Print Oneline from the main menu. To print a strip chart, right-click
on it to invoke its local menu, and then select Print Window. In both cases, Simulator will open the Print Options
Dialog.
Print Options Dialog
The Print Options Dialog has three tabs:
Page Layout
This tab sheet contains options for how the diagram will appear on the printed page. It presents the following controls:
Margins
Specify the horizontal and vertical margins in either inches or centimeters.
Scaling
Set this option to Proportional to print the oneline diagram or strip chart such that the screen’s aspect ratio is
maintained. Set this option to Fit to Page to force the printout to take up all available space on the page in both
horizontal and vertical directions.
Draw Border
Places a border to be drawn around the oneline diagram or strip chart.
The second tab controls the printing of a title bar. Check the Print Title Bar box to print a title bar at the bottom of
the diagram. Checking this box displays a number of options that allow you to specify various items to include in
the title bar. If you don’t want to include certain items on the plot, simply leave those fields blank.
The title bar is split horizontally into three sections. If you specify values for all requested items, they will be
arranged in the title bar as follows:
Company
|
Description Line 1
|
Date
Department
|
Description Line 2
|
Drawing #
Author
|
Description Line 3
|
Title
Title Bar
This tab is used to specify whether or not to include a title bar on the diagram, along with the information that would be
contained in the title bar.
Multi-Page
80
Using Oneline Diagrams
This tab allows the oneline diagram to be "divided" into a specified number of sections for printing the oneline to
several pages. A multi-page oneline can be useful for including "close-up" views of areas of a diagram in a report, or
the multiple pages can be cut and combined to form a larger printed oneline if a plotter is not available. The Multi-
Page tab presents the following controls:
Grid Size
Choose this value to subdivide the oneline into an N by N grid. You can then choose which sections of the oneline
to print based on the grid overlay. The maximum size is 10 x 10.
Choosing What to Print
A low resolution picture of your oneline is shown on the Multi-Page tab. Gridlines are drawn over the diagram to
show where the oneline has been subdivided based on the Grid Size chosen.
To remove a grid section from the printout, click on the oneline image in the corresponding section of the grid. The
selected section of the grid will become dark to indicate you wish to prevent the section from printing.
To add a grid section back into the print job, click on a darkened section of the grid to allow that section of the
oneline to be printed.
The number of pages you have chosen to print will be shown on the dialog. When printing out a multi-page oneline
with a title bar, the page number will appear on the title bar in the form "Column Letter"-"Row Number". For
example, if the Grid Size is 4, the pages are numbered A-1 through D-4.
Click Print to send the document to the printer, or Cancel to abort the print. Click Setup to view the default Windows
printer dialog, which will allow you to specify whether to print the figure in portrait or landscape modes and to set
various printer-specific properties.
81
Printer Setup
Choose File > Printer Setup from the main menu to configure the printer using the standard Windows printer setup
dialog. This dialog allows you to define which printer to use for printing from Simulator, the size of the printed page,
the page’s orientation, and additional properties that are specific to the printer you are using.
82
Creating, Loading, and Saving Simulator Cases
Chapter 3: Creating, Loading, and Saving Simulator Cases
This chapter describes the File and Simulation Control Menus. The File Menu is used to open and save either full
cases or oneline diagrams, or to create new cases or new onelines (Edit Mode). The menu is also used to exit
Simulator or to validate a case (Edit Mode).
The Simulation Control Menu controls the actual simulation. You can use this menu to do either a time-domain
simulation or a single Power Flow Solution.
The following material is included:
· File Menu
· Case Formats
· Validating a Case
· Opening Files
· Creating Files
· Closing Files
· Additional File Formats
83
File Menu
The file menu is used to open and save either full cases or oneline diagrams, to create new cases, to validate cases,
to switch between modes (Run/Edit) or to exit Simulator. The buttons on the File Toolbar provide access to many of
the same options housed by the File Menu.
84
Creating, Loading, and Saving Simulator Cases
Case Formats
Simulator supports a number of case formats. You can open and save cases using any of the following formats:
PowerWorld Binary (*.pwb) (Preferred Format)
For most users, the best choice of power flow case formats is the PowerWorld Binary format. This format stores the
most complete set of case information but requires the smallest file sizes. Information stored in this format includes
power flow data, economic parameters, case time variation/options values, and screen customizations. The only
potential disadvantage of this format is that it is stored in binary form, which means that it cannot be viewed using a
standard text editor. All the other formats are ASCII and thus readable in text editors such as Notepad.
PowerWorld Auxiliary File (*.aux)
Simulator can now save and load cases using the PowerWorld defined auxiliary file format. When the aux file
format is chosen as the save file type in Simulator, the data describing the entire case is written to a text file
described by Simulator’s auxiliary file format. These files can be considerably larger than PowerWorld Binary files,
and generally should not be used unless otherwise necessary. Note that not all auxiliary files represent an entire
case, and in fact in most cases do not. Only when an auxiliary file is created using the Save A s option in Simulator
does the auxiliary file contain all necessary information for loading the complete case in Simulator as an auxiliary
file.
PowerWorld Case (*.pwc)
The PowerWorld Case format is primarily included for backward compatibility with earlier versions of PowerWorld
packages. While this format does not include as much information as the PowerWorld binary format, it still includes
power flow data, economic parameters, and most case time variation/options values.
PTI Raw Data Format (*.raw) (versions 23 - 30)
This format is included primarily for interchange of power flow data with other packages. The PTI Raw Data format
only contains power flow data. When using this format, the generator participation factors are automatically set to
be proportional to the MVA rating of each generator.
GE PSLF Format (*.epc)
This format is included primarily for importing load flow data saved from GE's PSLF program. The EPC format is a
text file format. There are two major differences between the PSLF and Simulator load flow models. First, PSLF
models multi-section lines explicitly by storing a section number with transmission lines. In Simulator, the sections
are converted to their own individual line record, and dummy buses are placed at each internal point of the multi-
section line. Simulator also keeps track of these lines and reports them as part of a multi-section line, though each
section has its own entity in the load flow data. Second, PSLF explicitly models three winding transformers.
Simulator, thus far, does not explicitly model such transformers. Rather, Simulator converts the three winding
transformers to an equivalent model of three (or in special cases two) two winding transformers with a common bus
(also called an internal or star node.) The conversion of multi-section lines and three winding transformers is done
automatically when an EPC file is opened in Simulator.
Another issue with PSLF files is that they store quite a bit of excess information that is unused in Simulator. Rather
than loading all of this excess information in the computer's memory (which could hurt machine performance), the
excess information is automatically stored in an extra external text file created by Simulator. This text file has an
extension of .ecf, and is saved with the same name as the original case file in the same directory as the original
case file. As the case is saved in Simulator, possibly with a different name, the ECF file can also have its name
changed to reflect the name of the load flow file w hen it was saved as a PowerWorld Binary (.pwb) file. The ECF
file will never be needed unless the case is written back out to PSLF EPC format, at which time Simulator will locate
the ECF file, if it exists in the same directory under the same name as the PWB file, and rewrite the extra data back
out to the EPC file, along with the load flow data from Simulator.
IEEE Common Format (*.cf)
The IEEE Common Format is used to specify only power flow information. CAUTION: IEEE common format does
not support many of the formats used in the PowerWorld packages, such as multiple loads and generators at a bus.
Usually, IEEE Common Format is used only for inputting cases.
85
Validating a Case
Validation checks for both errors that would prevent a case from working properly in Simulator and for abnormal setup
of model objects. Validation errors and warnings are displayed in the Message Log. A sampling of the tasks
performed during case validation include:
· Ensures there is a system slack bus assigned
· Ensures the slack bus has an attached generator
· Ensures that no generator is assigned to remotely regulate the slack bus
· Checks for buses having multiple controllable devices attached (i.e. switched shunts)
· Checks all max/min enterable fields to ensure that the max value is greater than the min value
Case validation is performed automatically when switching from Edit Mode to Run Mode. If a case has validation
errors, Simulator will not allow the user to switch to Run Mode. Warnings will not prevent switching to Run Mode.
The user can initiate a case validation by selecting File > Validate Case.
Opening Files
Opening a Simulation Case
The most common first step in using Simulator is to open a case. When a case is opened, any associated oneline
files are also opened. To open a case, either select it from the list of recently opened cases in the file menu or
· Select File > Open Case from the main menu or Open Case button on the File Toolbar to display the Open Dialog.
· In the Type of Files box, select the desired file type. By default, the PowerWorld Binary type is selected (*.PWB).
The PowerWorld Binary is the preferred file type, providing the most comprehensive power system information
along with the smallest size and quickest load time. Other file types include the PowerWorld Case type,
PowerWorld Auxiliary file, PTI Raw Data formats versions 23 through 30, GE EPC text format, and IEEE Common
Format. Please see Case Formats for more details.
· In the list of cases, click on the desired case.
· Click OK.
When opening an existing Simulator case, you may see one or more oneline diagrams pop up. When opening a
power flow case created with another program, a oneline may not be available. However, you can easily create a
oneline for such a case using the Edit Mode.
If you are in the Edit Mode, you can modify the case. See Edit Mode Overview for details.
If you are in the Run Mode, the Clock Window may be displayed. This window shows the simulation start time, end
time and current time. You may choose to close or open the clock at any time.
If the case has validation errors, the mode is immediately switched to Edit Mode. You must correct the validation
errors shown in the message log before you can use the Run Mode to solve the case.
86
Creating, Loading, and Saving Simulator Cases
Opening a Oneline Diagram
Simulator supports oneline diagrams that have been developed using its Edit Mode tools. PowerWorld can also
import PTI Draw Files (*.drw).
When a case is opened, any associated onelines are usually opened, as well. Additionally, oneline diagrams can be
opened directly from any existing onelines using oneline links. However, you may also directly open a oneline
diagram using the following procedure:
· Select File > Open Oneline from the main menu, or select the Open Oneline button on the File Toolbar.
· Choose the file type you would like to open (One Line Display File or PTI Draw File).
· In the list of available oneline files, click on the desired oneline.
· Click OK.
You may open as many onelines as you like, and even multiple copies of the same oneline.
87
Recently Opened Cases
A numbered list of the most recently opened cases appears at the end of the File Menu. Simply click on the case’s
name in the menu to open the case.
Creating Files
Building a New Case
To create a new case in Simulator, select File > New Case from the main menu, or select the New Case button on the
File Toolbar. After asking you whether or not to save the current working case (if one exists), Simulator will
automatically switch to Edit Mode. The screen will turn to the default background color, indicating that you can begin
to build the new case.
New users may wish to view the tutorial Creating a New Case from Scratch for further guidance.
88
Creating, Loading, and Saving Simulator Cases
Building a New Oneline
This option enables you to create a new oneline diagram. It is accessible from either the Edit or Run modes by
choosing File > New Oneline from the main menu or pressing the New Oneline button on the File Toolbar. When
you select it, the application will automatically switch to Edit Mode, from which you can construct the new oneline.
New users may wish to view the tutorial Creating a New Case from Scratch for further guidance.
89
Closing Files
Saving Cases
Simulator allows users to save case information in several different formats. To call up the Save As dialog, select File
> Save As from the main menu. The format in which the file will be saved depends upon the value of the Save File
Type field shown in the lower-left corner of the dialog. Simulator can save cases in PowerWorld binary format (the
default), PowerWorld Auxiliary file format, PTI versions 23 through 30 raw data, GE PSLF format, and the IEEE
common format. Please see Case Formats for more details on the various case formats available.
To convert a case to a different format, follow this procedure:
· Select File > Open Simulation Case.
· In the Type of Files box, select the desired file type. By default, the PowerWorld Binary type is selected (*.PWB).
· Select the name of the desired case and click OK.
· Select File > Save Case As from the main menu.
· Change the Type of Files setting to match the desired file type, designate the name with which to save the file, and
click OK.
To simply save the case with its current name and format, select either File > Save from the main menu or the Save
Case button on the File Toolbar.
90
Creating, Loading, and Saving Simulator Cases
Saving a Oneline
Select File > Save Oneline from the main menu to save the currently selected oneline file. Alternatively, you may
select the Save Oneline button from the File Toolbar.
Select File > Save Oneline As from the main menu to save the currently selected oneline file with a different name.
You may overwrite existing files.
For both the Save Oneline and Save Oneline As options, only the oneline diagram is saved; the case (i.e. the power
flow model) is not written to disk.
91
Close Oneline
To close a oneline diagram, go to File > Close Oneline, or right-click on the background of the oneline diagram and
select Close from the local menu. This will prompt you to save the oneline if changes have been made since the last
save. Note that this does not close the current case, just the oneline diagram. The power system data is still loaded,
and case simulations can be run with the oneline closed.
92
Creating, Loading, and Saving Simulator Cases
Additional File Formats
Area/Zone Load Schedule Format (*.shd)
These files are outdated for Simulator version 8.0 and later. Their descriptions are still maintained here as they can
still be read into Simulator. However, they can no longer be saved. These records are now stored in Auxiliary
Script/Data Files.
The schedule files store the area and zone load variation schedules. The files have the following format:
For a desired area or zone, the first line of the record is either AREA or ZONE, followed by the area/zone’s number or
name in single quotes.
The next lines in the file must have the format timepoint, schedule value. The timepoint format is either hh:mm, where
hh is the hour and mm is the minutes, or hh:mm:ss, where ss is the seconds. Multiple timepoints and schedule values
can be on the same line.
The record is terminated by a line with a single negative number.
Example
AREA
1
06:00 1.0000 10:00 3.0000
-1
ZONE 2
06:00 1.5000
9:00 2.5000 10:00 1.5000
-1
93
Automatic Area Controls Format (*.aac)
These files are outdated for Simulator version 8.0 and later. Their descriptions are still maintained here as they can
still be read into Simulator. However, they can no longer be saved. These records are now stored in Auxiliary
Script/Data Files.
The automatic area controls file stores the control settings for areas in the case. The automatic area controls files
have the following format, with one area per line:
AREA areaname areacontroltype autotaps autoshunts
where
areaname
the area’s name in single quotes,
areacontroltype
the dispatch control for the area, in single quotes (Off AGC, Part. AGC, ED,
Area Slack, OPF),
autotaps
the status of automatically switching taps (1 for automatically switching taps, 0
otherwise),
autoshunts
the status of automatically switching shunts (1 for automatically switching
shunts, 0 otherwise).
94
Creating, Loading, and Saving Simulator Cases
Auxiliary File Format (*.aux)
Simulator Auxiliary Files have now been greatly enhanced to include both Script sections for running Simulator
commands in a "batch" process, and Data sections for changing mass amounts of load flow information. Many
auxilliary file formats used in early versions of Simulator can not be saved in current versions. The older f ormats can
still be read into Simulator.
Auxiliary file format and use now has its own help chapter titled Auxiliary Script/Data Files.
95
Generator Capability Curves Format (*.gcp)
These files are outdated for Simulator version 8.0 and later. Their descriptions are still maintained here as they can
still be read into Simulator. However, they can no longer be saved. These records are now stored in Auxiliary
Script/Data Files.
The generator capability curves are used to model the dependence of the generator reactive power limits and the
generator’s real power output. The generator reactive capability curves files have the following format, with one
generator per line:
num or name, ID, P1, Q1,max,Q1,min, P2, Q2,max, Q2,min ... Pn, Qn,max, Qn,min
where
num/name
the generator’s bus number or the bus’ name in single quotes,
ID
the generator’s single character id,
Pi
a generator MW output value,
Qi,max and Qi,min
the associated maximum and minimum reactive power limits.
Version 11 and later of Simulator allow for an unlimited number of capability curve points to be read from the gcp file.
Up to 10 different P/Qmax/Qmin values may be specified in older versions of Simulator.
96
Creating, Loading, and Saving Simulator Cases
Generator Cost Data Format (*.gcd)
These files are outdated for Simulator version 8.0 and later. Their descriptions are still maintained here as they can
still be read into Simulator. However, they can no longer be saved. These records are now stored in Auxiliary
Script/Data Files.
The generator cost data file contains the parameters used to model the generator operating costs. Each record in the
generator cost data file specifies the operating cost model for a single generator. The cost model may be either a
cubic polynomial or a piecewise linear curve. When reading a file of generator cost data records, Simulator will open
the Cost Curve Data Options Dialog. This dialog gives you additional control over the input and process of generator
cost information.
Each generator cost data record begins with the fields
num or name, ID,
where
num/name
the generator’s bus number or the bus’ name in single quotes,
ID
the generator’s single character id,
Following the ID field is an optional single-character field CostModel that specifies the type of cost model. If
CostModel is ‘CUBIC’ or is not specified, the record describes a cubic cost model and thus concludes with the
following fields:
ai, bi, ci, di, FuelCost ParFac
where
ai, bi, ci, di
input-output curve coefficients; see Generator Cost Information for details,
fuelcost
fuel cost, expressed in price per Mbtu,
ParFac
generator participation factor.
If, on the other hand, CostModel is ‘PLIN’, the record describes a piecewise linear cost model. The remainder of the
record specifies pairs of generator output and corresponding generator cost:
FixedCost MW1 IncCost1 MW2 IncCost2 … MWn IncCostn MWneg ParFac
where
FixedCost
Operation cost independent of the generator’s MW output; expressed in $/Hr,
MWi, IncCosti
Output/incremental cost data point pairs that define the incremental cost model
for the generator (note IncCosti has the units $/MWhr),
MWneg
An arbitrary negative value used to terminate the record,
ParFac
generator participation factor.
97
Generator Cost Curve Data Options
The Cost Curve Data Options Dialog gives you additional control over the input and processing of generator cost
information. It appears when you try to read generator cost information from an auxiliary data file (either .aux or .gcd).
To command Simulator to turn all units onto automatic generation control (AGC) for which it reads a cost data record,
check the first checkbox. This box has the rather lengthy label "If a unit for which a cost curve is read is not on AGC,
Simulator should set it on AGC." In other words, if a cost curve is read for a particular generator, that generator will be
set on AGC if this box is checked.
Cross-compound is a generator architecture sporting a single boiler and two turbines, one operating at high pressure
and the other operating at low pressure. The existence of cross-compound units may complicate the modeling of
generator cost characteristics, because sources for this information tend to describe the cost associated with the
tandem, whereas Simulator’s economic dispatch will try to dispatch the two parts of the cross-compound unit as two
separate units. To address this problem, Simulator gives you the option to lump the properties of the high- and low -
pressure turbines into a single unit. It consolidates the two components by adding together their maximum MW
outputs, minimum MW outputs, and present output levels, assigning these quantities to one of the units, and setting
the other unit off AGC and at 0 MW of output. To have Simulator perform this function for you, check the box in the
Cross Compound Units panel.
To tell Simulator how to identify units that belong to the same cross-compound generator, click the box labeled "How
To Identify…". This will open the How to Identify Cross-Compound Units dialog.
98
Creating, Loading, and Saving Simulator Cases
Identify Cross Compound Units
Simulator regards cross-compound units as those that are connected to the same bus and that have generator id’s
that match any of a number of specified pairs. You must define for Simulator the pairs of generator id’s that should be
used to identify cross-compound units. Use the "How to identify cross-compound units " dialog to do this.
Specify the pair of generator id’s in the small text boxes below the text labeled "Specify a new pair of id’s that identify
two units that belong to the same cross-compound set." Then, click the Add button to include the pair of id’s you just
entered in Simulator’s cross-compound identification procedure. The box on the right lists all the pairs of identifiers
Simulator will use to identify parts of a cross-compound set. To remove a pair of identifiers from this list, select it from
the box and click the Delete key.
The list of cross-compound identifier pairs is stored in the pwrworld.ini file, so there is no need to specify these pairs
each time you load in a new case.
99
Injection Groups Format (*.inj)
These files are outdated for Simulator version 8.0 and later. Their descriptions are still maintained here as they can
still be read into Simulator. However, they can no longer be saved. These records are now stored in Auxiliary
Script/Data Files.
The injection group files store the information for defined injection groups (also referred to as participation groups).
The files have the following format:
GROUP groupname
POINTS
Devtype busnum id participation pointtype
END
where
groupname
the name of the injection group, in single quotes,
devtype
either GEN or LOAD,
busnum
bus number of the device,
id
the device’s single character ID,
participation
relative amount each device will contribute during a transfer,
pointtype
either FIXED or DYNAMIC.
Multiple GROUP sections can be put in the file, each marked with END to signify the end of that group’s data.
100
Creating, Loading, and Saving Simulator Cases
Interface Data Format (*.inf)
These files are outdated for Simulator version 8.0 and later. Their descriptions are still maintained here as they can
still be read into Simulator. However, they can no longer be saved. These records are now stored in Auxiliary
Script/Data Files.
The interface data files store the interface data. The files have the following format:
INTERFACE intname lima limb limc
Elemtype from to id checktoend fromto
where
intname
the interface name, in single quotes,
lima, limb, limc
the three limits for the interface, in MW,
elemtype
one of three valid element types: AREA, LINE, or ZONE
from
for AREA and ZONE, the first area or zone number; for LINE, the from bus
number,
to
for AREA and ZONE, the second area or zone number; for LINE, the to bus
number,
id
only included for LINE, the two character circuit identifier; otherwise left blank,
checktoend
only included for LINE, if this field equals 1, the flow is checked at the to bus,
otherwise the flow is checked at the from bus; otherwise left blank,
fromto
only included for LINE, if this field equals 1, the positive flow is assumed to be
from the from bus to the to bus, otherwise the flow is assumed to be in the
opposite direction; otherwise left blank.
Multiple interface records can be listed in the file, and multiple interface elements can be listed in each interface
record.
101
Sequence Data Format
The sequence data files store the sequence data needed to run a fault analysis. The sequence data format has the
following five different types of records:
· Generator
· Load
· Branch
· Switched Shunt
· Mutual Impedance
Each of these four types of sequence data records has a different format, since they each store different information
for the sequence data. The format of each record is given below:
Generator
GEN busnum ID Rpos Xpos Rneg Xneg Rzer Xzer RN XN
where
busnum
generator terminal bus,
id
generator identifier,
Rpos, Xpos
positive sequence resistance and reactance,
Rneg, Xne g
negative sequence resistance and reactance,
Rzer, Xzer
zero sequence resistance and reactance,
RN, XN
neutral-to-ground resistance and reactance.
Load
LOAD busnum Gneg Bneg Gzer Bzer
where
busnum
load terminal bus,
Gneg, Bneg
negative sequence total conductance and susceptance for all loads at bus,
Gzer, Bzer
zero sequence total conductance and susceptance for all loads at bus.
Branch
BRANCH fbusnum tbusnum ckt Rzer Xzer Czer fGzer fBzer tGzer tBzer Xftype
where
fbusnum, tbusnum
from and to bus numbers for the branch,
ckt
branch circuit identifier,
Rzer, Xzer
zero sequence branch resistance and reactance,
Czer
total zero sequence line charging,
fGzer, fBzer
zero sequence line shunt conductance and susceptance at the from bus end of
the branch,
tGzer, tBzer
zero sequence line shunt conductance and susceptance at the to bus end of
the branch,
Xftype
Transformer configuration, entered as an integer based on the following table.
Note that the default for a transmission line is 3, since a grounded wye -
grounded wye transformer connection has the same equivalent model as a
transmission line.
0
Wye - Wye
1
Grounded Wye - Wye
2
Wye - Grounded Wye
3
Grounded Wye - Grounded Wye
4
Wye - Delta
102