OPERATOR’S MANUAL FOR ARMY CH-47D HELICOPTER (EIC: RCD, 2003) - page 12
TM 1-1520-240-10
Figure 7A-7-47. 100% Rotor RPM,
10_ and 20_C, 10,000 Feet
7A-7-53
TM 1-1520-240-10
Figure 7A-7-48. 100% Rotor RPM,
30_ and 40_C, 10,000 Feet
7A-7-54
TM 1-1520-240-10
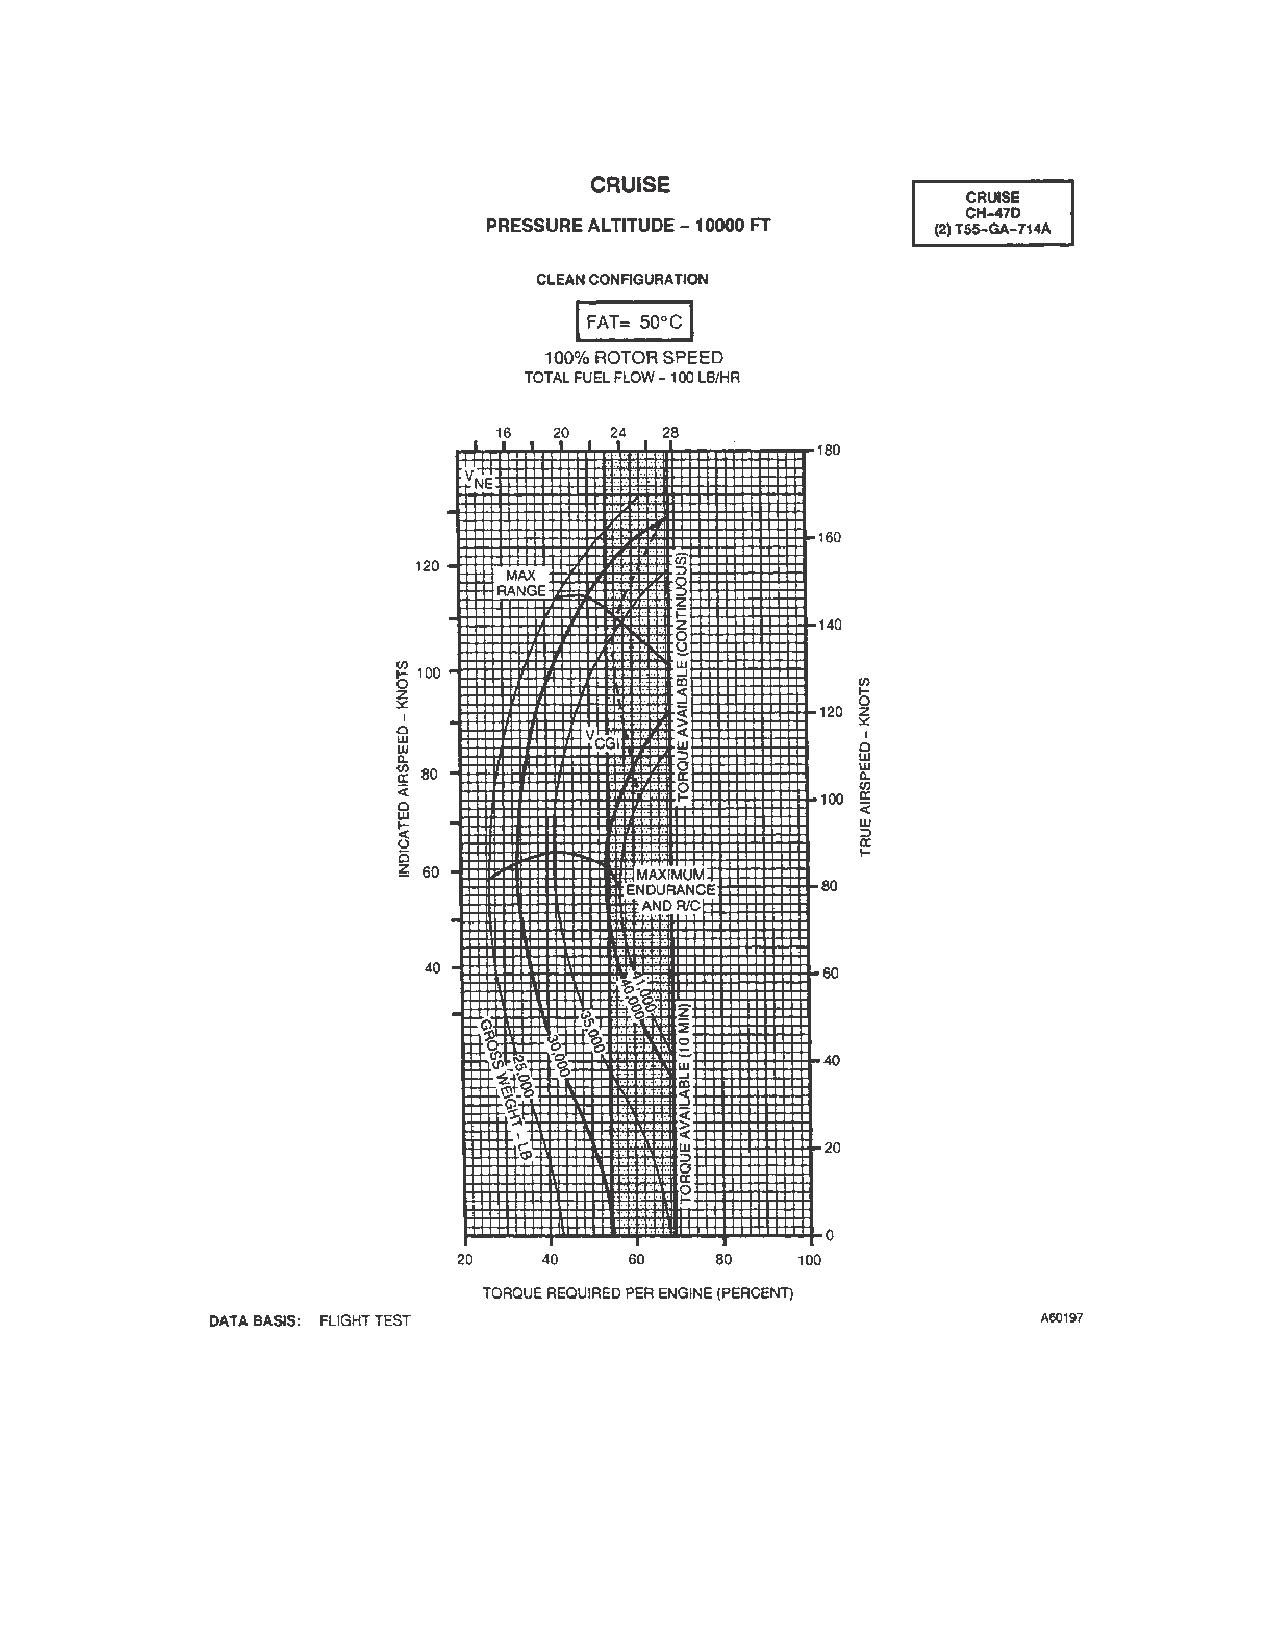
Figure 7A-7-49. 100% Rotor RPM,
50_C, 10,000 Feet
7A-7-55
TM 1-1520-240-10
Figure 7A-7-50. 98 and 100% Rotor RPM,
-50_C, 12,000 Feet
7A-7-56
TM 1-1520-240-10
Figure 7A-7-51. 98 and 100% Rotor RPM,
-40_C, 12,000 Feet
7A-7-57
TM 1-1520-240-10
Figure 7A-7-52. 98 and 100% Rotor RPM,
-30_C, 12,000 Feet
7A-7-58
TM 1-1520-240-10
Figure 7A-7-53. 98 and 100% Rotor RPM,
-20_C, 12,000 Feet
7A-7-59
TM 1-1520-240-10
Figure 7A-7-54. 100% Rotor RPM,
-10_ and 0_C, 12,000 Feet
7A-7-60
TM 1-1520-240-10
Figure 7A-7-55. 100% Rotor RPM,
10_ and 20_C, 12,000 Feet
7A-7-61
TM 1-1520-240-10
Figure 7A-7-56. 100% Rotor RPM,
30_ and 40_C, 12,000 Feet
7A-7-62
TM 1-1520-240-10
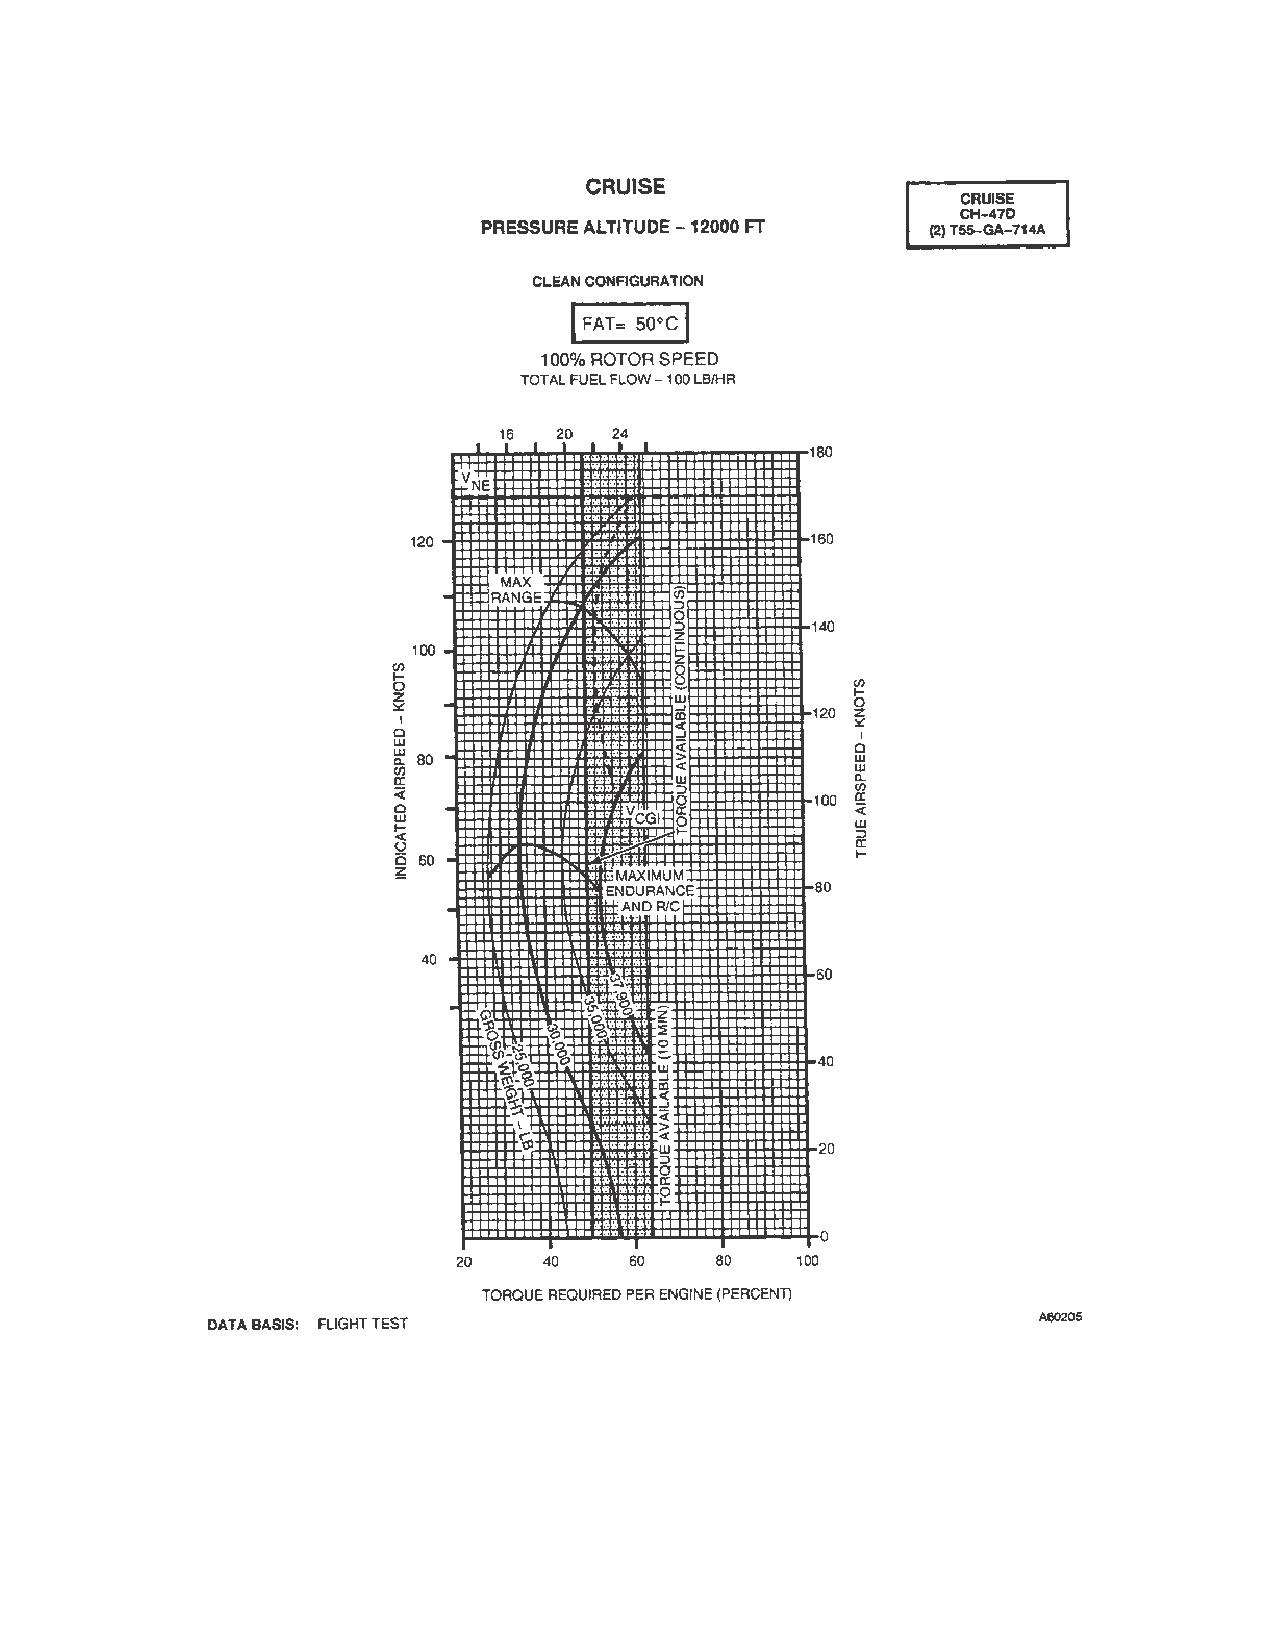
Figure 7A-7-57. 100% Rotor RPM, 50_C, 12,000 Feet
7A-7-63
TM 1-1520-240-10
Figure 7A-7-58. 98 and 100% Rotor RPM,
-50_C, 14,000 Feet
7A-7-64
TM 1-1520-240-10
Figure 7A-7-59. 98 and 100% Rotor RPM,
-40_C, 14,000 Feet
7A-7-65
TM 1-1520-240-10
Figure 7A-7-60. 98 and 100% Rotor RPM,
-30_C, 14,000 Feet
7A-7-66
TM 1-1520-240-10
Figure 7A-7-61.
98 and 100% Rotor RPM,
-20_C, 14,000 Feet
7A-7-67
TM 1-1520-240-10
Figure 7A-7-62. 100% Rotor RPM,
-10_ and 0_C, 14,000 Feet
7A-7-68
TM 1-1520-240-10
Figure 7A-7-63. 100% Rotor RPM,
10_ and 20_C, 14,000 Feet
7A-7-69
TM 1-1520-240-10
Figure 7A-7-64. 100% Rotor RPM,
30_ and 40_C, 14,000 Feet
7A-7-70
TM 1-1520-240-10
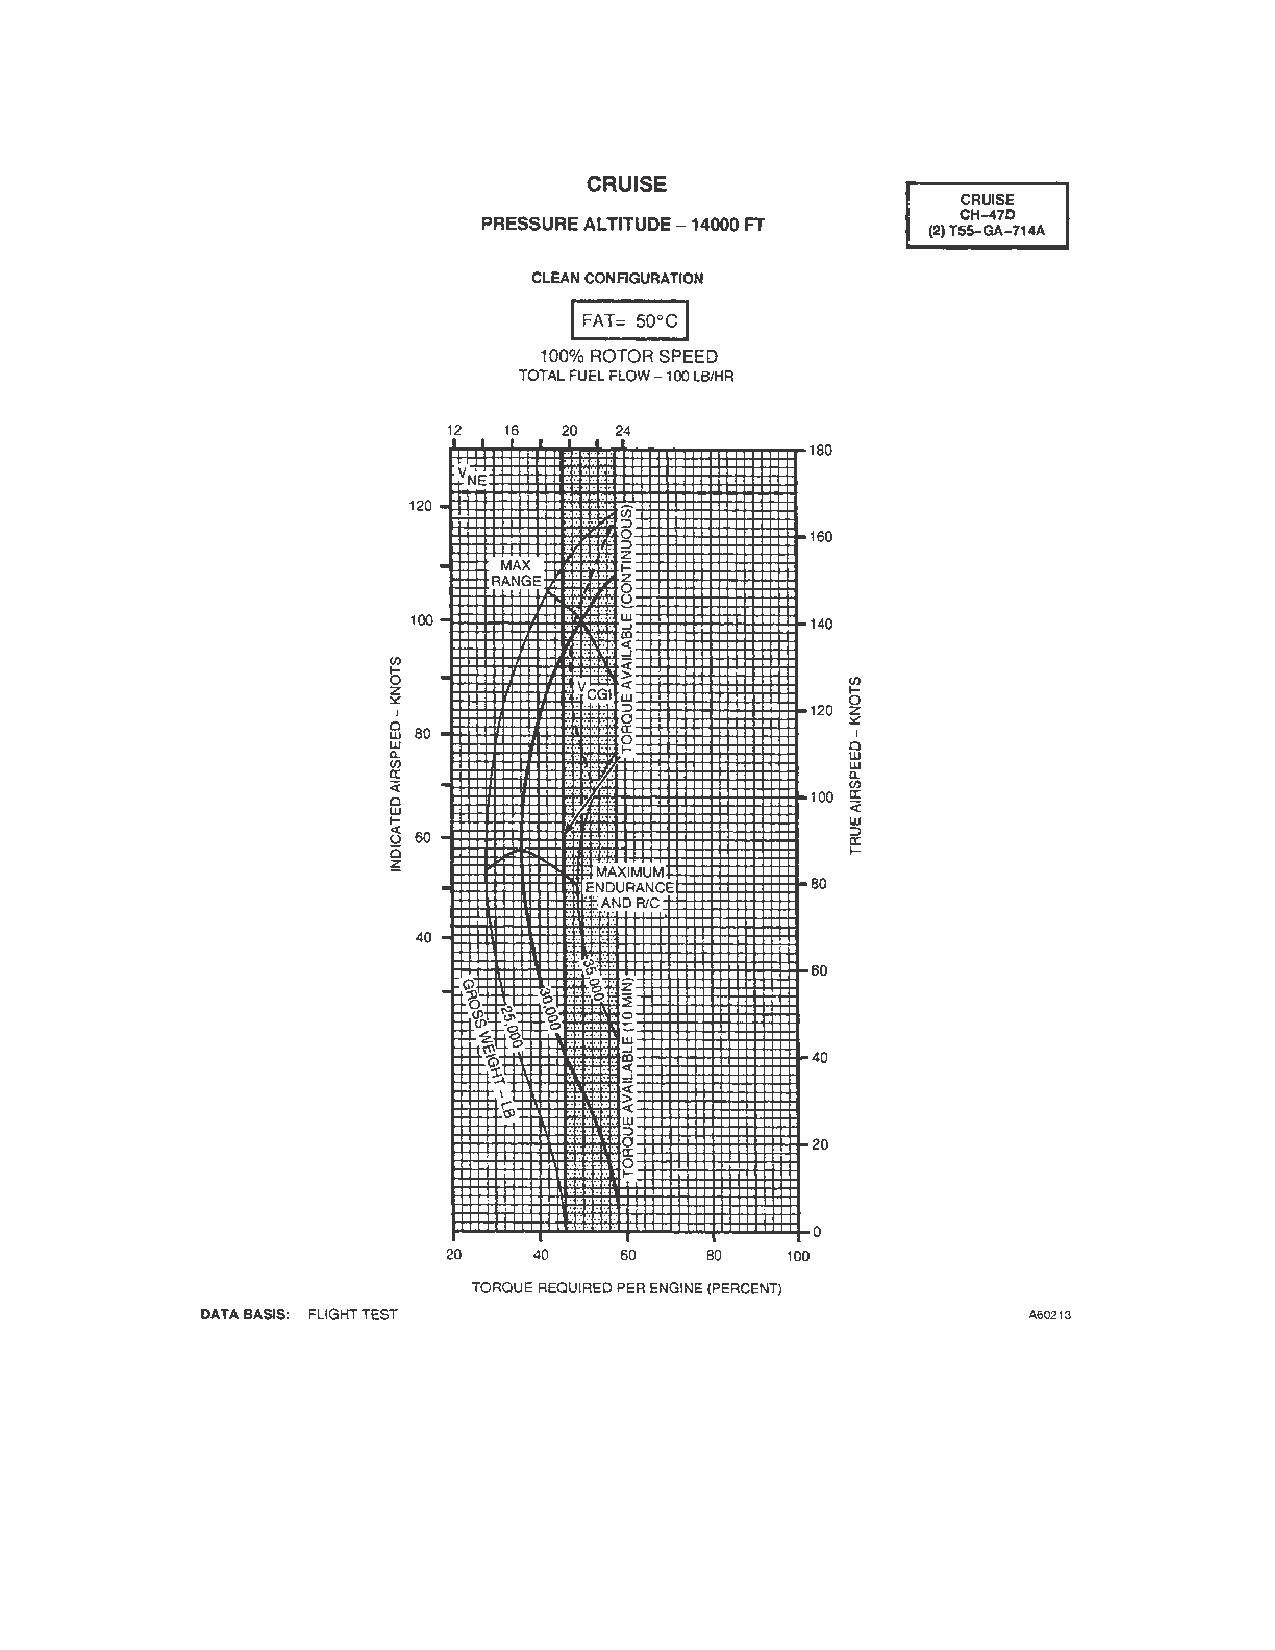
Figure 7A-7-65. 100% Rotor RPM,
50_C, 14,000 Feet
7A-7-71
TM 1-1520-240-10
Figure 7A-7-66. 98 and 100% Rotor RPM,
-50_C, 16,000 Feet
7A-7-72
TM 1-1520-240-10
Figure 7A-7-67. 98 and 100% Rotor RPM,
-40_C, 16,000 Feet
7A-7-73
TM 1-1520-240-10
Figure 7A-7-68. 98 and 100% Rotor RPM,
-30_C, 16,000 Feet
7A-7-74
TM 1-1520-240-10
Figure 7A-7-69. 98 and 100% Rotor RPM,
-20_C, 16,000 Feet
7A-7-75
TM 1-1520-240-10
Figure 7A-7-70. 100% Rotor RPM,
-10_ and 0_C, 16,000 Feet
7A-7-76
TM 1-1520-240-10
Figure 7A-7-71. 100% Rotor RPM,
10_ and 20_C, 16,000 Feet
7A-7-77
TM 1-1520-240-10
Figure 7A-7-72. 100% Rotor RPM,
30_ and 40_C, 16,000 Feet
7A-7-78
TM 1-1520-240-10
Figure 7A-7-73. 98 and 100% Rotor RPM, -50_C, 18,000 Feet
7A-7-79
TM 1-1520-240-10
Figure 7A-7-74.
98 and 100% Rotor RPM, -40_C, 18,000 Feet
7A-7-80
TM 1-1520-240-10
Figure 7A-7-75. 98 and 100% Rotor RPM, -30_C, 18,000 Feet
7A-7-81
TM 1-1520-240-10
Figure 7A-7-76. 98 and 100% Rotor RPM, -20_C, 18,000 Feet
7A-7-82
TM 1-1520-240-10
Figure 7A-7-77. 100% Rotor RPM, -10_ and 0_C, 18,000 Feet
7A-7-83
TM 1-1520-240-10
Figure 7A-7-78. 100% Rotor RPM, -10_ and 20_C, 18,000 Feet
7A-7-84
TM 1-1520-240-10
Figure 7A-7-79. 98 and 100% Rotor RPM, -50_C, 20,000 Feet
7A-7-85
TM 1-1520-240-10
Figure 7A-7-80.
98 and 100% Rotor RPM, -40_C, 20,000 Feet
7A-7-86
TM 1-1520-240-10
Figure 7A-7-81. 98 and 100% Rotor RPM, -30_C, 20,000 Feet
7A-7-87
TM 1-1520-240-10
Figure 7A-7-82. 98 and 100% Rotor RPM, -20_C, 20,000 Feet
7A-7-88
TM 1-1520-240-10
Figure 7A-7-83. 100% Rotor RPM, -10_ and 0_C, 20,000 Feet
7A-7-89
TM 1-1520-240-10
Figure 7A-7-84. 100% Rotor RPM, 10_ and 20_C, 20,000 Feet
7A-7-90
TM 1-1520-240-10
SECTION VIII. DRAG
7A-8-1. Description.
Table 7A-8-1. Change in Drag Area of Typical
External Loads
The drag chart (fig. 7A-8-1) shows the torque change
required for flight due to drag area change as a result of
DRAG AREA
external configuration changes.
CHANGE SQ
LOAD
FT
7A-8-2. Use of Chart.
CONTAINERS: (1)
The primary use of the chart is illustrated by the example.
To determine the change in torque, it is necessary to
8 FT x 8FT x 20 FT CONEX
150/100(2)
know the drag area change, TAS, PA, and FAT. From the
table below find the drag area change associated with
ISU-60
62
the configuration, or estimate if necessary. Enter chart
ISU-90
81
at known drag area change, move right to TAS, move
down to PA, move left to FAT, then move down and read
(2) ISU-90
115(2)
change in engine torque.
(2) 500 GAL FUEL CELLS
40
7A-8-3. Conditions.
(3) 500 GAL FUEL CELLS
60
The drag chart is based on operating at 100% RRPM.
(4) 500 GAL FUEL CELLS
80
TRUCKS: (1)
HMMWV (ENCLOSED VE-
49/28(2)
HICLE)
HMMWV (TOW LAUNCHER)
54/31(2)
M34 1/2 TON DUMP
100
M35 2 1/2 TON CARGO
80
HOWITZERS:
M2A1-105MM
50
M102-105MM
50
M198-105MM
149/50(2)
HELICOPTERS:
OH-58 HELICOPTER
93(3)
UH-60 HELICOPTER
175(3)
AH-64 HELICOPTER
170(3)
CH-47 HELICOPTER
230(2)(4)
(1)
RIGGED IN ACCORDANCE
DATA
WITH FM 10-450
BASIS:
(2)
WITH DUAL POINT SUSPEN
ESTIMATED/
SION
FLIGHT TEST
(3)
RIGGED IN ACCORDANCE
WITH TM-1-1670-260-12&P
(UNMARK)
(4)
RIGGED IN ACCORDANCE
WITH TM 1-1520-240-BD
7A-8-1
TM 1-1520-240-10
Figure 7A-8-1. Drag Chart
7A-8-2
TM 1-1520-240-10
SECTION IX. CLIMB DESCENT
7A-9-1. Description.
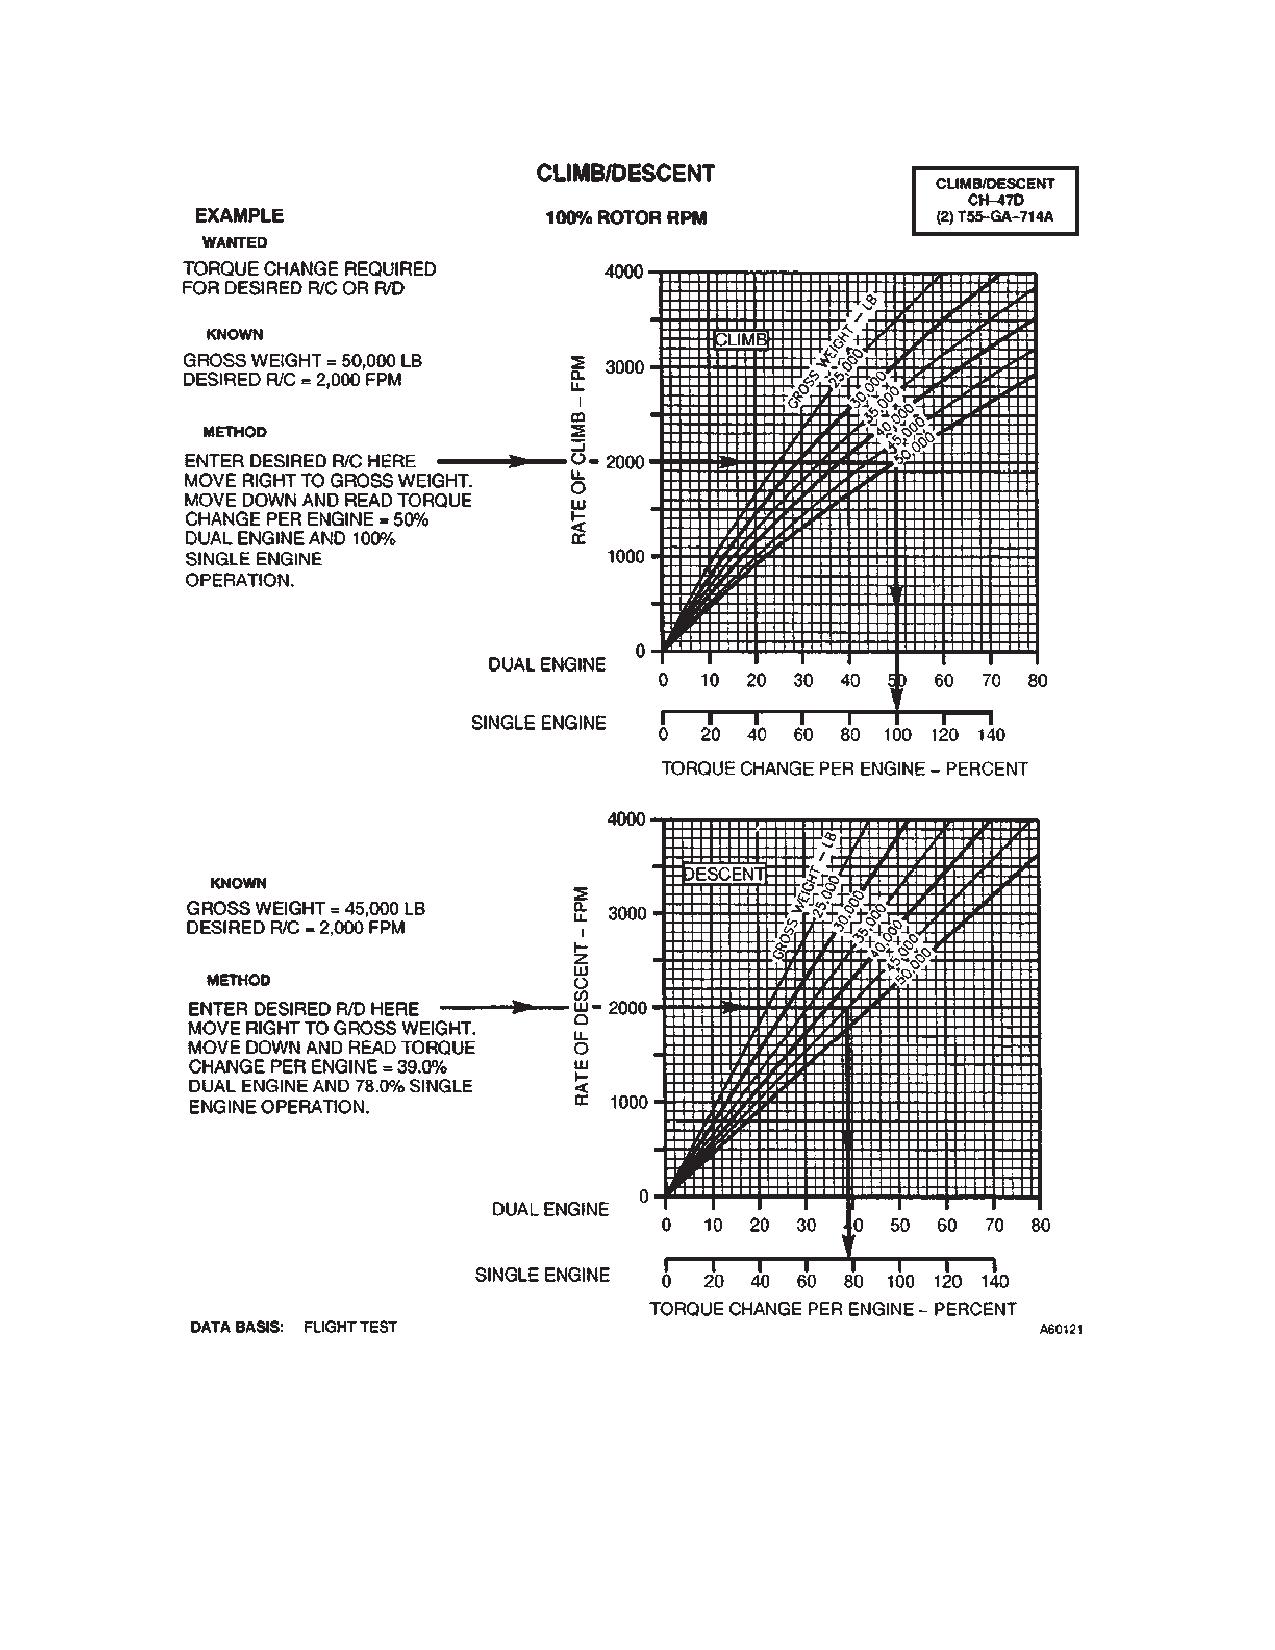
b. Rate of climb or descent may also be obtained by
entering with a known torque change, moving upward to
a. Climb and descent performance may be seen in
gross weight, moving left and reading rate of climb or
figure 7A-9-1, which represents change in torque to climb
descent.
or descend at selected GWs.
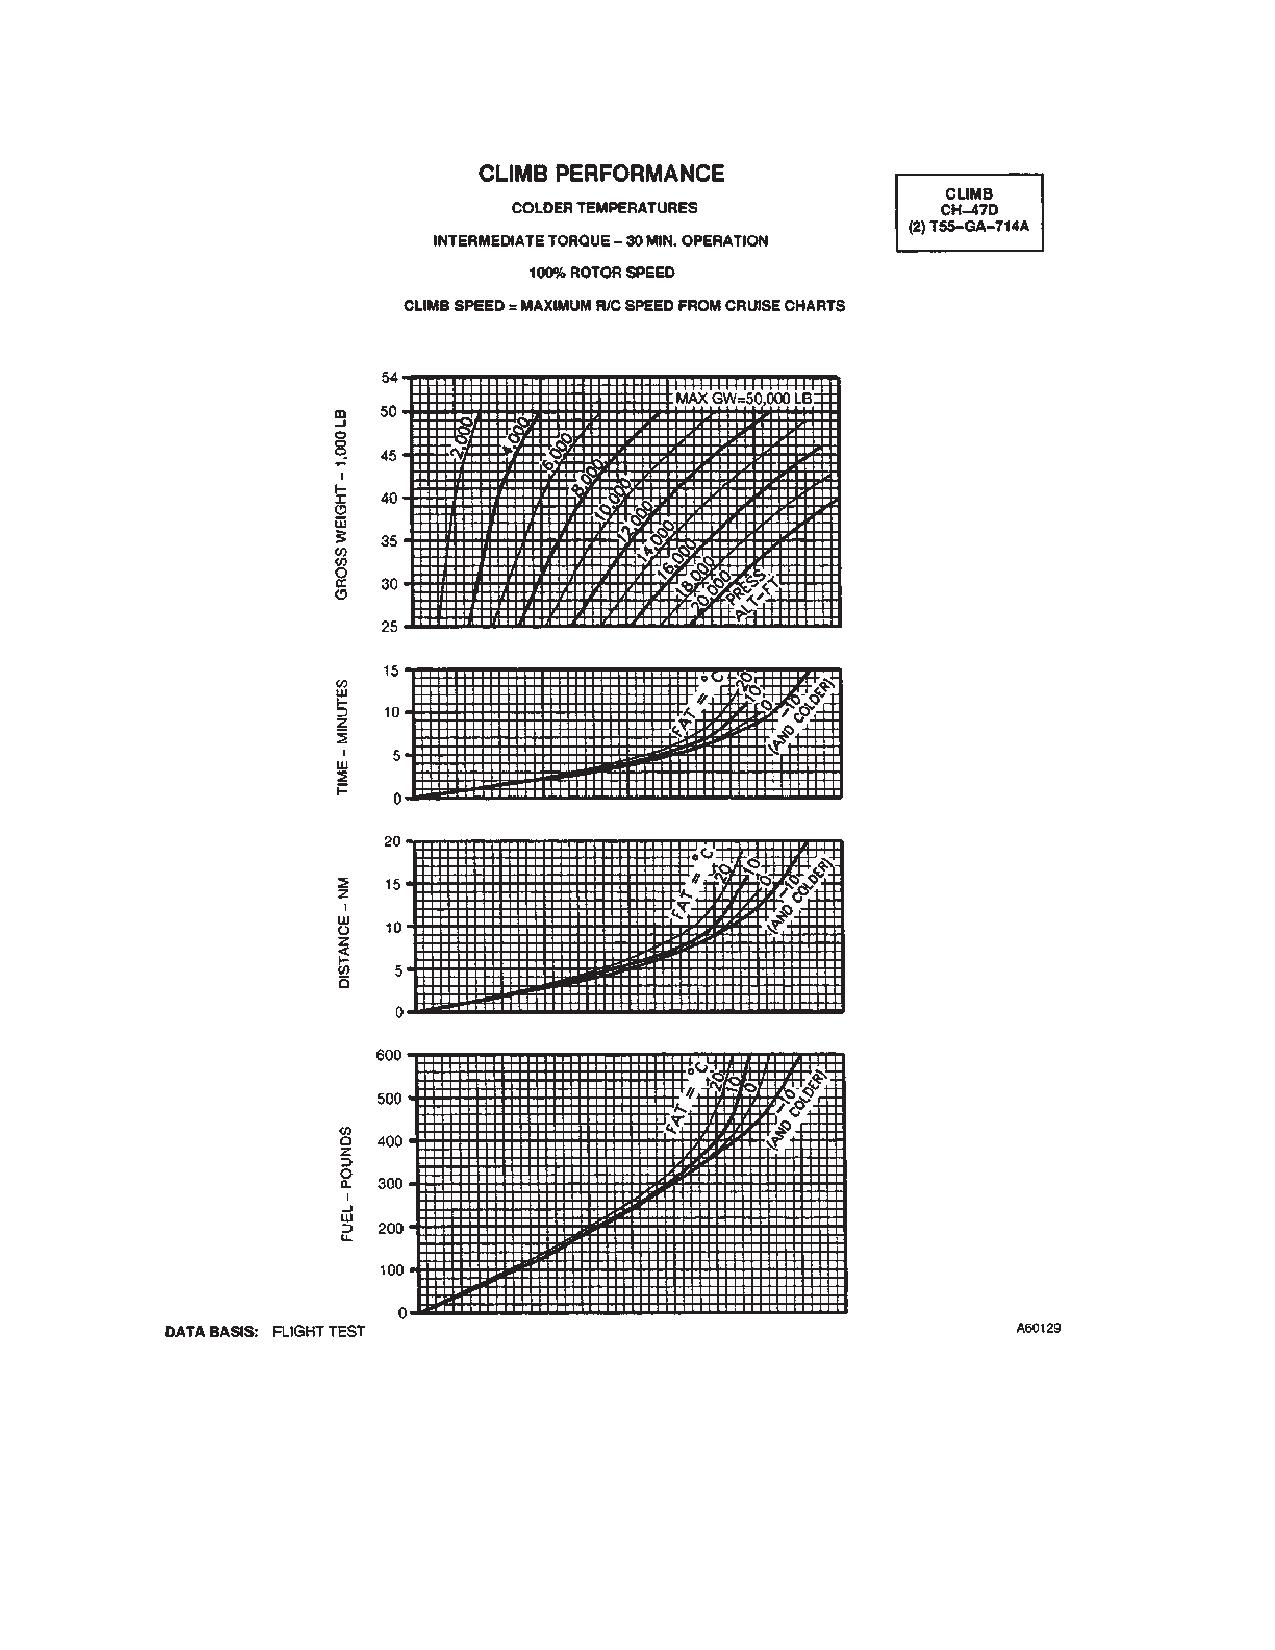
c. To use the climb performance charts (fig. 7A-9-2),
b. The climb performance charts, figure 7A-9-2,
enter at the top left at the known gross weight, move right
shows relationships between GW, initial and final altitude
to the initial press alt (pressure altitude), move down to
and temperatures, time to climb, and distance covered
the FAT at that altitude, and move left and record time,
and fuel used while climbing. The chart is presented for
distance, and fuel. Subtract the time, distance, and fuel
climbing at hotter and colder temperatures, intermedi-
values of the initial altitude-temperature condition from
ate torque (30 minute operation).
those of the final altitude-temperature condition to find
the time to climb, distance covered, and fuel used while
7A-9-2. Use of Chart.
climbing.
The primary use of the charts is illustrated by the chart
examples.
7A-9-3. Conditions.
a. To determine torque change for a specific rate of
The climb and descent charts are based on 100%
climb or rate of descent (fig. 7A-9-1), enter rate of climb
RRPM. The climb speed schedule shown in figure
or descent and move right to gross weight, move down
7A-9-2 (see insert) is for optimum climb, that is, minimum
and read change. This torque change must be added to
power required and maximum power available (30 min-
the torque required for level flight for climb, or subtracted
utes). It is an average schedule for the GW range and
for descent, to obtain total climb or descent torque.
atmospheric conditions for the CH-47D.
7A-9-1
TM 1-1520-240-10
Figure 7A-9-1. Climb - Descent Chart
7A-9-2
TM 1-1520-240-10
Figure 7A-9-2. Climb Performance (Sheet 1 of 2)
7A-9-3
TM 1-1520-240-10
Figure 7A-9-2. Climb Performance (Sheet 2 of 2)
7A-9-4
TM 1-1520-240-10
SECTION X. FUEL FLOW
7A-10-1. Description.
7A-10-3. Conditions.
a. Presented charts are based on the use of JP-4
The idle fuel flow chart (fig. 7A-10-1) presents engine fuel
fuel.
flow sensitivity to PA and FAT for ground idle and flight
b. Ground idle is defined at 50 to 59% N1.
idle.
c. Thrust ground detent is defined as engine condi-
tion levers at FLT, NR selected 97%, and thrust control at
the detent.
7A-10-2. Use of Chart..
d. The single engine fuel flow chart (fig. 7A-10-2)
baseline in 0_C. Increase or decrease fuel flow by 1
The primary use of charts is illustrated by the example.
percent for every 10_C change in temperature.
To determine idle fuel flow, it is necessary to know idle
7A-10-4. EAPS Installed.
condition, PA, and FAT. Enter PA, move right to FAT,
move down and read fuel flow.
Increase fuel flow by an additional 1%.
7A-10-1
TM 1-1520-240-10
Figure 7A-10-1. Idle Fuel Flow Chart
7A-10-2
TM 1-1520-240-10
Figure 7A-10-2. Single Engine Fuel Flow Chart
7A-10-3/(7A-10-4 blank)
TM 1-1520-240-10
SECTION XI. AIRSPEED CALIBRATION
7A-11-1. Description.
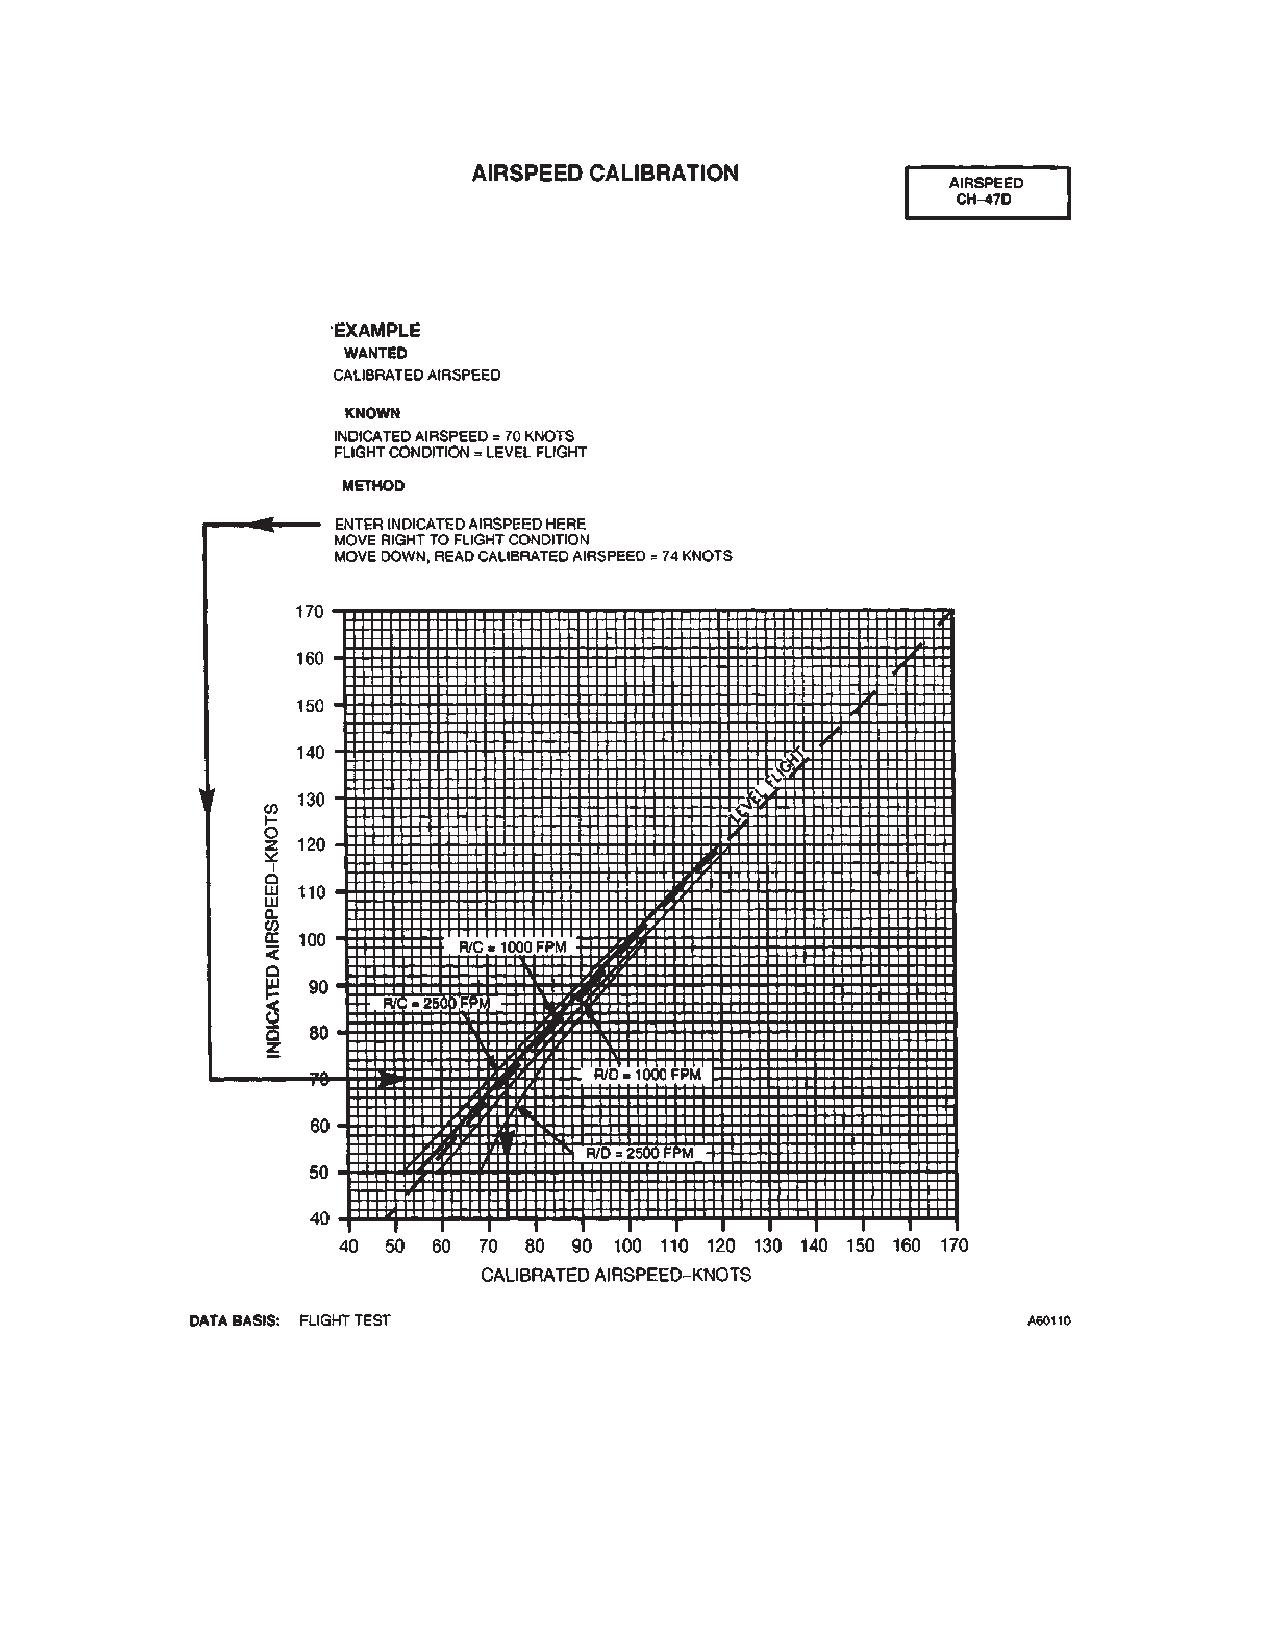
IAS and flight regime. Enter chart at indicated airspeed,
move right to appropriate flight regime, move down and
The airspeed calibration chart, figure 7A-11-1, defines
read calibrated airspeed.
the relationship between indicated (IAS), and calibrated
airspeed (CAS) for level flight, climb and autorotation.
7A-11-3. Conditions.
7A-11-2. Use of Chart.
The primary use of the chart is illustrated by the example.
Presented airspeed calibration charts are for CH-47D
To determine calibrated airspeed, it is necessary to know
helicopters with T55-GA-714A engines.
7A-11-1
TM 1-1520-240-10
Figure 7A-11-1. Airspeed Calibration Chart
7A-11-2