OPERATOR’S MANUAL FOR ARMY CH-47D HELICOPTER (EIC: RCD, 2003) - page 10
TM 1-1520-240-10
Figure 7-7-67.
98 and 100% Rotor RPM, -40_C, 16,000 Feet
7-7-73
TM 1-1520-240-10
Figure 7-7-68.
98 and 100% Rotor RPM, -30_C, 16,000 Feet
7-7-74
TM 1-1520-240-10
Figure 7-7-69.
98 and 100% Rotor RPM, -20_C, 16,000 Feet
7-7-75
TM 1-1520-240-10
Figure 7-7-70.
100% Rotor RPM, -10_ and 0_C, 16,000 Feet
7-7-76
TM 1-1520-240-10
Figure 7-7-71.
100% Rotor RPM, 10_ and 20_C, 16,000 Feet
7-7-77
TM 1-1520-240-10
Figure 7-7-72.
100% Rotor RPM, 30_ and 40_C, 16,000 Feet
7-7-78
TM 1-1520-240-10
Figure 7-7-73.
98 and 100% Rotor RPM, -50_C, 18,000 Feet
7-7-79
TM 1-1520-240-10
Figure 7-7-74.
98 and 100% Rotor RPM, -40_C, 18,000 Feet
7-7-80
TM 1-1520-240-10
Figure 7-7-75.
98 and 100% Rotor RPM, -30_C, 18,000 Feet
7-7-81
TM 1-1520-240-10
Figure 7-7-76.
98 and 100% Rotor RPM, -20_C, 18,000 Feet
7-7-82
TM 1-1520-240-10
Figure 7-7-77.
98 and 100% Rotor RPM, -10_ and 0_C, 18,000 Feet
7-7-83
TM 1-1520-240-10
Figure 7-7-78.
98 and 100% Rotor RPM, 10_ and 20_C, 18,000 Feet
7-7-84
TM 1-1520-240-10
Figure 7-7-79.
98 and 100% Rotor RPM, -50_C, 20,000 Feet
7-7-85
TM 1-1520-240-10
Figure 7-7-80.
98 and 100% Rotor RPM, -40_C, 20,000 Feet
7-7-86
TM 1-1520-240-10
Figure 7-7-81.
98 and 100% Rotor RPM, -30_C, 20,000 Feet
7-7-87
TM 1-1520-240-10
Figure 7-7-82.
98 and 100% Rotor RPM, -20_C, 20,000 Feet
7-7-88
TM 1-1520-240-10
Figure 7-7-83.
100% Rotor RPM, -10_ and 0_C, 20,000 Feet
7-7-89
TM 1-1520-240-10
Figure 7-7-84. 100% Rotor RPM, 10_ and 20_C, 20,000 Feet
7-7-90
TM 1-1520-240-10
SECTION VIII. DRAG
7-8-1. Description.
Table 7-8-1. Change in Drag Area of Typical Exter-
nal Loads
The drag chart (fig. 7-8-1) shows the torque change re-
quired for flight due to drag area change as a result of
DRAG
external configuration changes.
AREA
CHANGE
7-8-2. Use of Charts.
LOAD
SQ FT
The primary use of the chart is illustrated by the example.
CONTAINERS: (1)
To determine the change in torque, it is necessary to
know the drag area change, TAS, PA, and FAT. From the
8 FT x 8FT x 20 FT CONEX
150/100(2)
table below find the drag area change associated with
the configuration, or estimate if necessary. Enter chart
ISU-60
62
at known drag area change, move right to TAS, move
ISU-90
81
down to PA, move left to FAT, then move down and read
change in engine torque.
(2) ISU-90
115(2)
7-8-3. Conditions.
(2) 500 GAL FUEL CELLS
40
The drag chart is based on operating at 100% RRPM.
(3) 500 GAL FUEL CELLS
60
(4) 500 GAL FUEL CELLS
80
TRUCKS: (1)
HMMWV (ENCLOSED VEHICLE)
49/28(2)
HMMWV (TOW LAUNCHER)
54/31(2)
M34 1/2 TON DUMP
100
M35 2 1/2 TON CARGO
80
HOWITZERS:
M2A1-105MM
50
M102-105MM
50
M198-105MM
149/50(2)
HELICOPTERS:
OH-58 HELICOPTER
93(3)
UH-60 HELICOPTER
175(3)
AH-64 HELICOPTER
170(3)
CH-47 HELICOPTER
230(2)(4)
1)
RIGGED IN ACCORDANCE
DATA
WITH FM 10-450
BASIS:
(2)
WITH DUAL POINT SUSPEN
ESTIMATED/
SION
FLIGHT
(3)
RIGGED IN ACCORDANCE
TEST
WITH TM-1-1670-260-12&P
(UNMARK)
(4)
RIGGED IN ACCORDANCE
WITH TM 1-1520-240-BD
7-8-1
TM 1-1520-240-10
Figure 7-8-1. Drag Chart
7-8-2
TM 1-1520-240-10
SECTION IX. CLIMB DESCENT
7-9-1. Description.
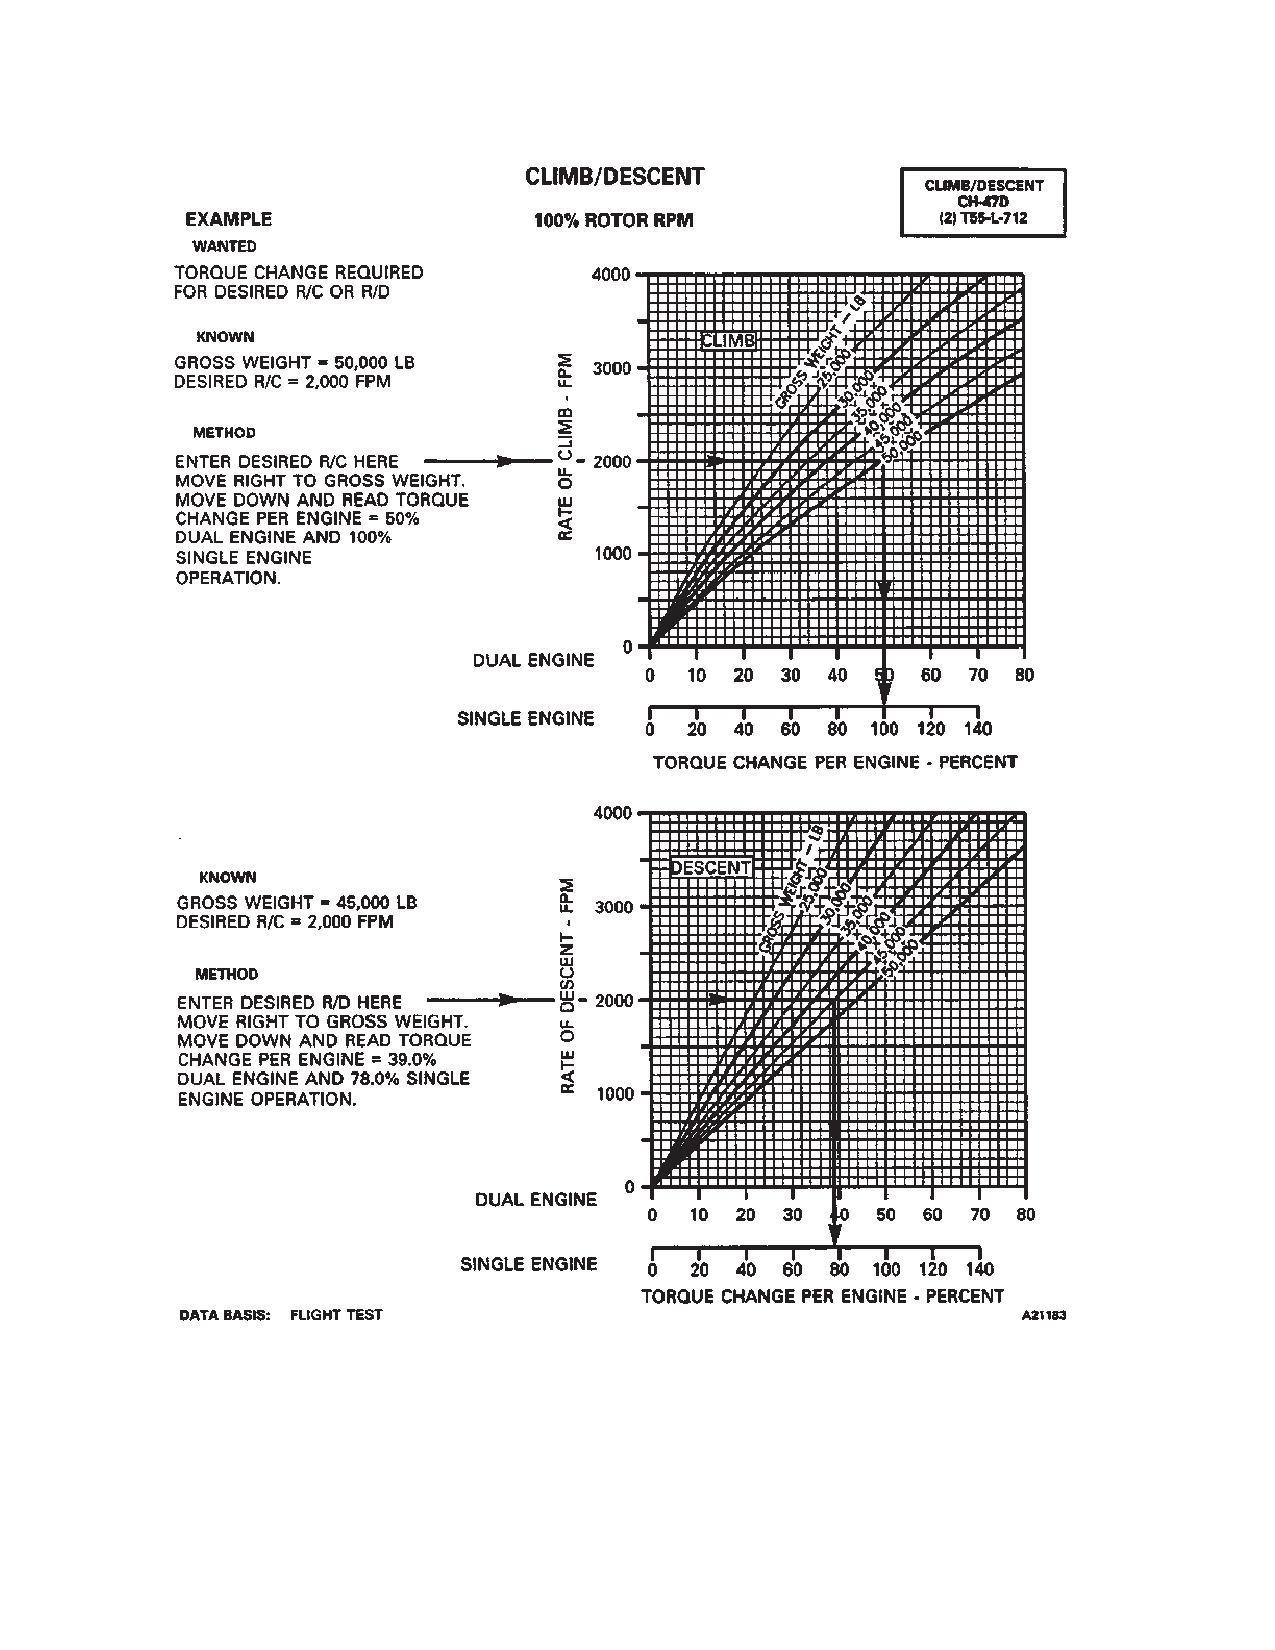
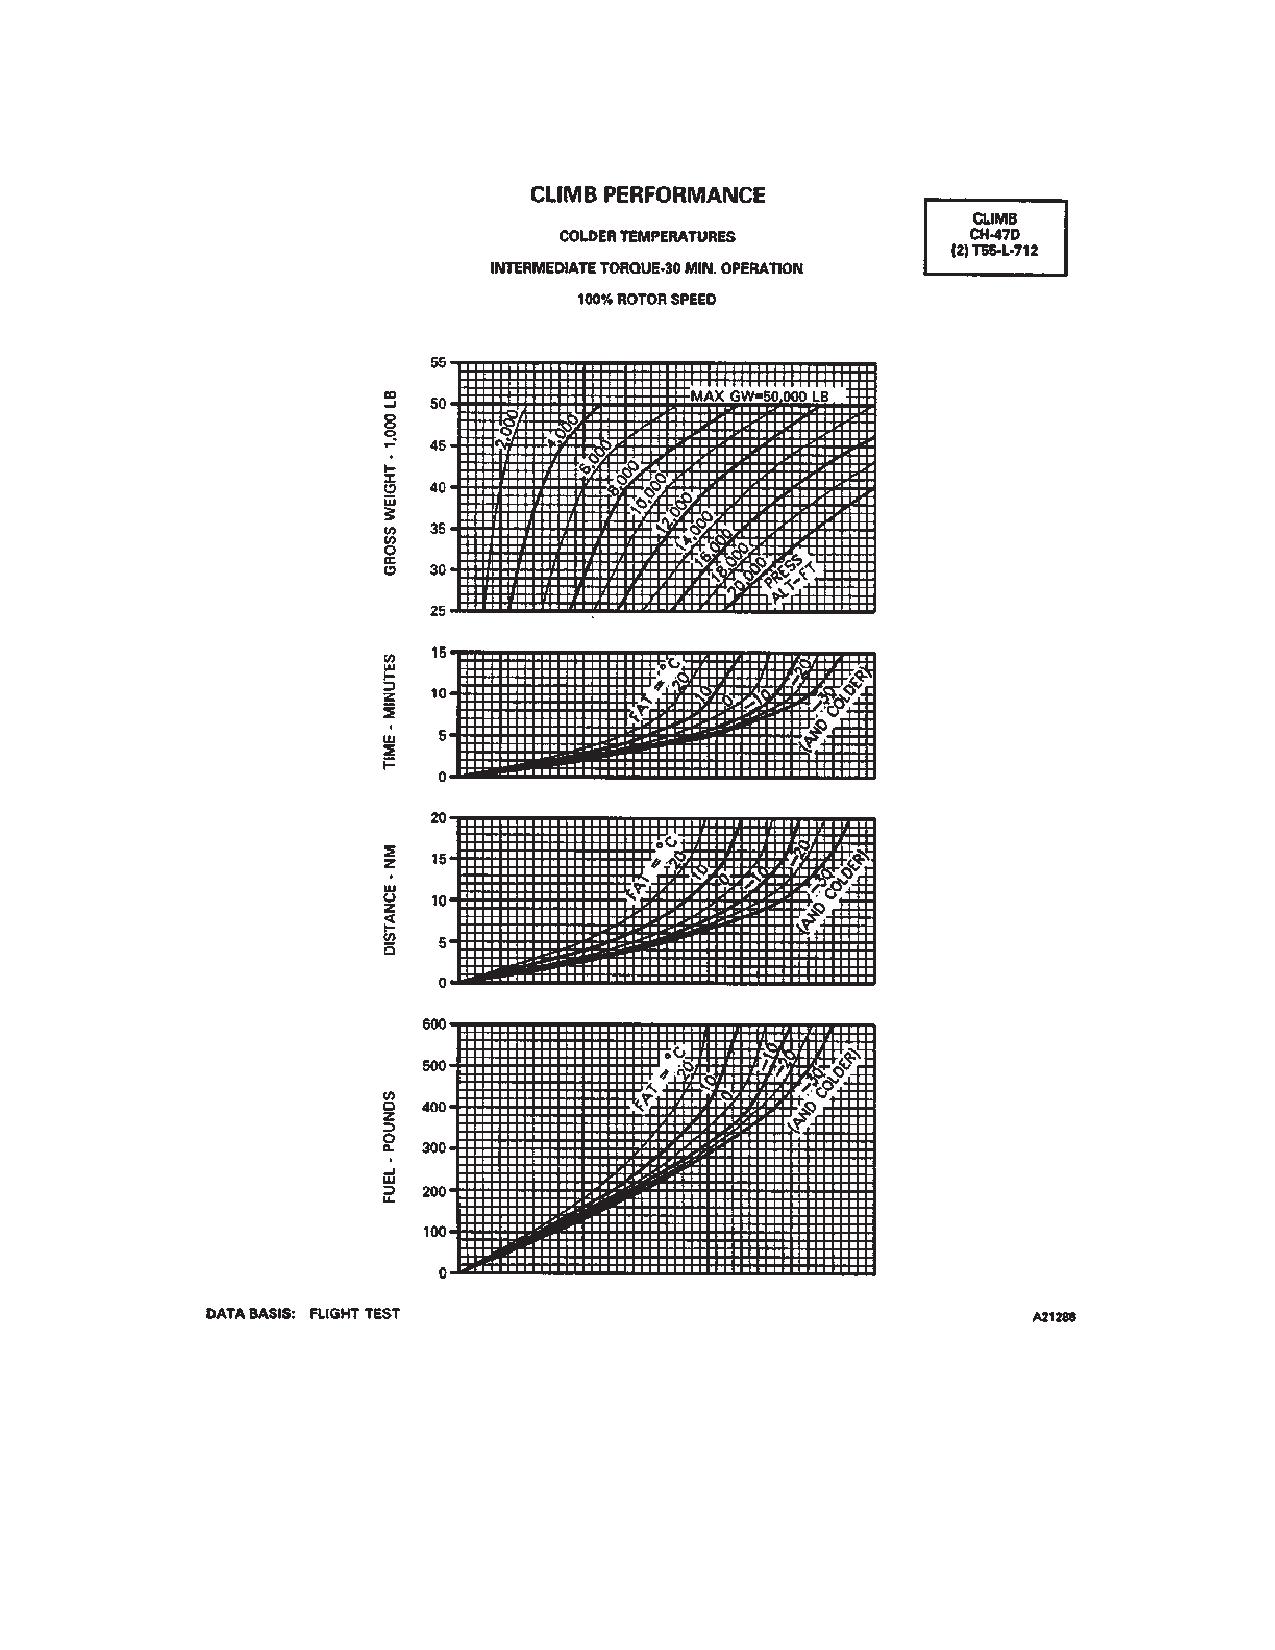
c. To use the climb performance charts (fig. 7-9-2),
enter at the top left at the known gross weight, (for heli-
a. Climb and descent performances may be seen in
copters with EAPS installed, enter chart at actual GW
figure 7-9-1, which presents change in torque to climb or
plus 1000 pounds), move right to the initial press alt
descend at selected GWs.
(pressure altitude), move down to the FAT at that altitude,
b. The climb performance charts, figure 7-9-2, shows
and move left and record time, distance and fuel. Enter
relationships between GW, initial and final altitude and
again at the GW, move right to the final altitude, and
temperatures, time to climb, and distance covered and
move down to the FAT at that altitude, and move left and
fuel used while climbing. The chart is presented for
record time, distance, and fuel. Subtract the time, dis-
climbing at hotter and colder temperatures, intermediate
tance, and fuel values of the initial altitude-temperature
torque (30 minute operation).
condition from those of the final altitude-temperature
condition to find the time to climb, distance covered, and
7-9-2. Use of Charts.
fuel used while climbing.
a. To determine torque change for a specified rate
of climb or rate of descent (fig. 7-9-1), enter rate of climb
or descent and move right to gross weight, move down
and read torque change. This torque change must be
7-9-3. Conditions.
added to the torque required for level flight for climb, or
subtracted for descent, to obtain total climb or descent
The climb and descent charts are based on 100%
torque.
RRPM. The climb speed schedule shown in figure 7-9-2
b. Rate of climb or descent may also be obtained by
(see insert) is for optimum climb, that is, minimum power
entering with a known torque change, moving upward to
required and maximum power available (30 minutes). It
gross weight, moving left and reading rate of climb or
is an average schedule for the GW range and atmo-
descent.
spheric conditions for the CH-47D.
7-9-1
TM 1-1520-240-10
Figure 7-9-1. Climb and Descent Chart
7-9-2
TM 1-1520-240-10
Figure 7-9-2. Climb Performance (Sheet 1 of 2)
7-9-3
TM 1-1520-240-10
Figure 7-9-2. Climb Performance (Sheet 2 of 2)
7-9-4
TM 1-1520-240-10
SECTION X. FUEL FLOW
7-10-1. Description.
7-10-3. Conditions.
a. Presented charts are based on the use of JP-4
The idle fuel flow chart (fig. 7-10-1) presents engine fuel
fuel.
flow sensitivity to PA and FAT for ground idle and flight
b. Ground idle is defined at 60 to 63 percent N1.
idle.
c. Ground detent minimum beep is defined as engine
condition levers at FLT, minimum beep and thrust control
at the detent.
7-10-2. Use of Chart.
d. The single engine fuel flow chart (fig. 7-10-2) base-
line is 0_C. Increase or decrease fuel flow by 1% for
The primary use of the chart is illustrated by the example.
every 10_C change in temperature.
To determine idle fuel flow, it is necessary to know idle
7-10-4. EAPS Installed.
condition, PA, and FAT. Enter PA, move right to FAT,
move down and read fuel flow.
Increase fuel flow by an additional 1%.
7-10-1
TM 1-1520-240-10
Figure 7-10-1. Idle Fuel Flow Chart
7-10-2
TM 1-1520-240-10
Figure 7-10-2. Idle Fuel Flow Chart
7-10-3/(7-10-4 blank)
TM 1-1520-240-10
SECTION XI. AIRSPEED CALIBRATION
7-11-1. Description.
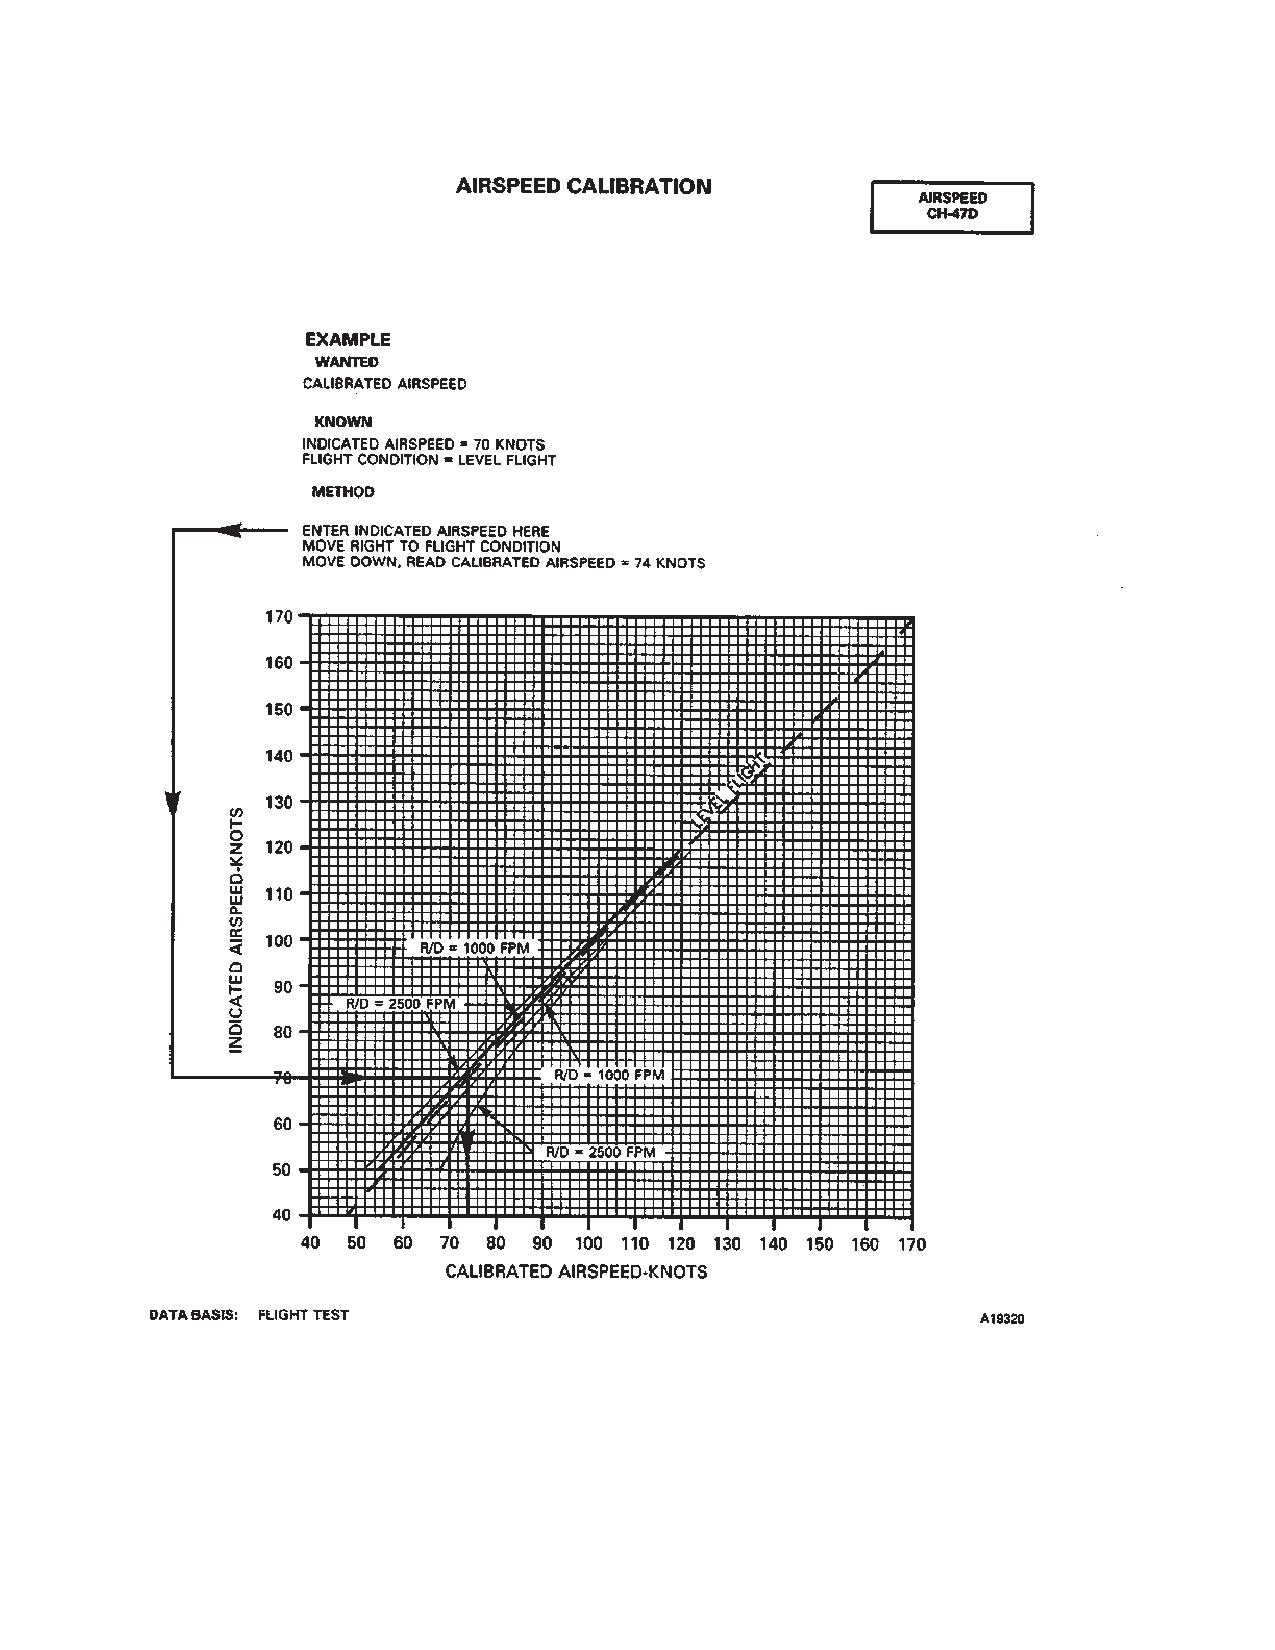
IAS and flight regime. Enter chart at indicated airspeed,
move right to appropriate flight regime, move down and
The airspeed calibration chart, figure 7-11-1, defines the
read calibrated airspeed.
relationship between indicated (IAS) and calibrated air-
speed (CAS) for level flight, climb, and autorotation.
7-11-3. Conditions.
7-11-2. Use of Chart.
The primary use of the chart is illustrated by example. To
Presented airspeed calibration charts are for CH-47D
determine calibrated airspeed, it is necessary to know
helicopters with T55-L-712 engines.
7-11-1
TM 1-1520-240-10
Figure 7-11-1. Airspeed Calibration Chart
7-11-2
TM 1-1520-240-10
CHAPTER 7A
714A PERFORMANCE DATA
SECTION I. INTRODUCTION
7A-1-1. Purpose.
limits with an operating cruise guide indicator (CGI).
Airspeed limits with the CGI inoperative are in Chapter
The purpose of this chapter is to provide the best avail-
5.If limits are exceeded, minimize the degree and time.
able performance data for the CH-47D helicopter. Regu-
7A-1-4. Use of Charts.
lar use of this information will enable you to receive maxi-
mum safe utilization from the aircraft. Although
a. Chart Explanation. The first page of each sec-
maximum performance is not always required, regular
tion describes the chart(s) and explains its use.
use of this chapter is recommended for the following
b. The primary use of each chart is given in an ex-
reasons.
ample and a guideline is provided to help you follow the
a. Knowledge of your performance margin will allow
route through the chart. The use of a straight edge (ruler
you to make better decisions when unexpected condi-
or page edge) and a hard fine point pencil is recom-
tions or alternate missions are encountered
mended to avoid cumulative errors. The majority of the
charts provide a standard pattern for use as follows:
b. Situations requiring maximum performance will
enter first variable on the top left scale, move right to the
be more readily recognized.
second variable, deflect down at right angles to the third
c. Familiarity with the data will allow performance to
variable, deflect left at right angles to the fourth variable,
be computed more easily and quickly
deflect down, etc. until the final variable is read out at the
final scale. In addition to the primary use, other uses of
d. Experience will be gained in accurately estimat-
each chart are explained in the text accompanying each
ing the effects of variables for which data are not present-
set of performance charts.
ed.
NOTE
7A-1-2. General Data.
An example of an auxiliary use of the charts
The data presented covers the maximum range of condi-
referenced above is as follows: Although the
tions and performance that can reasonably be expected.
hover chart is primarily arranged to find
In each area of performance, the effects of altitude, tem-
torque required to hover, by entering torque
perature, gross weight (GW), and other parameters re-
available as torque required, maximum wheel
lating to that phase of flight are presented. In addition to
height for hover can also be found. In general,
the presented data, your judgement and experience will
any single variable can be found if all others
be necessary to accurately obtain performance under a
are known. Also, the tradeoffs between vari-
given set of circumstances. The conditions for the data
ables can be found. For example, at a given
are listed under the title of each chart. The effects of
pressure altitude (PA), you can find the maxi-
different conditions are discussed in the text accompany-
mum GW capability as free air temperature
ing each phase of performance. Where practical, data is
(FAT) changes.
presented at conservative conditions. However, NO
c. Dashed Line Data. Data beyond conditions for
GENERAL CONSERVATISM HAS BEEN APPLIED. All
which tests were conducted, or for which estimates are
performance data presented is within the applicable lim-
used, are shown as dashed lines.
its of the aircraft.
7A-1-5. Data Basis.
CAUTION
The type of data used is indicated at the bottom of each
performance chart under DATA BASIS. The applicable
Exceeding operating limits can cause per-
report and date of the data are also given. The data
manent damage to critical components.
provided generally is based on one of the following cate-
Over limit operation can decrease perfor-
gories.
mance, cause immediate failure,or failure
on a subsequent flight.
a. Flight Test Data. Data obtained by flight test of
the aircraft by experienced flight test personnel at precise
7A-1-3. Limits.
conditions using sensitive calibrated instruments.
Applicable limit lines are shown on the charts. The
b. Calculated Data. Data based on tests, but not on
dashed lines on the cruise charts are estimated airspeed
flight test of the complete aircraft.
7A-1-1
TM 1-1520-240-10
c. Estimated Data. Data based on estimates using
e.
Airspeed Calibrations. The airspeed calibration
aerodynamic theory or other means but not verified by
chart presents the difference between indicated airspeed
flight test.
(IAS), and calibrated airspeeds (CAS) for different flight
conditions.
7A-1-6. Specific Conditions.
f.
Except as noted, all data is for clean configuration
The data presented is accurate only for specific condi-
(all doors installed, without armament).
tions listed under the title of each chart. Variables for
g. Types of Fuel. All flight performance data is
which data are not presented, but which may affect that
based on JP-5 fuel. The change in fuel flow and torque
phase of performance, are discussed in the text. Where
available, when using JP-4, JP-8, Aviation gasoline or
data is available or reasonable estimates can be made,
any other approved fuels, is insignificant.
the amount that each variable affects performance will be
given.
7A-1-8. Performance Discrepancies.
7A-1-7. General Conditions.
Regular use of this chapter will allow you to monitor in-
In addition to the specific conditions, the following gener-
struments and other aircraft systems for malfunction by
al conditions are applicable to the performance data.
comparing actual performance with planned perfor-
mance. Knowledge will also be gained concerning the
a. Rigging. All airframe and engine controls are
effects of variables for which data are not provided,
assumed to be rigged within allowable tolerances.
thereby increasing the accuracy of performance predica-
tions.
b. Pilot Technique. Normal pilot technique is
assumed.
7A-1-9. Definitions of Abbreviations.
c. Aircraft Variation. Variations in performance
Capitalization and punctuation of abbreviations varies,
between individual aircraft are known to exist: however,
depending upon the context in which they are used. In
they are considered to be small and cannot be accounted
general, full capital letter abbreviations are used in text
for individually.
material, charts and illustrations. Periods do not usually
d. Instrument Variations. The data shown in the
follow abbreviations; however, periods are used with ab-
performance charts does not allow for instrument
breviations that could be mistaken for whole words if the
inaccuracies or malfunctions.
period were omitted.
7A-1-2
TM 1-1520-240-10
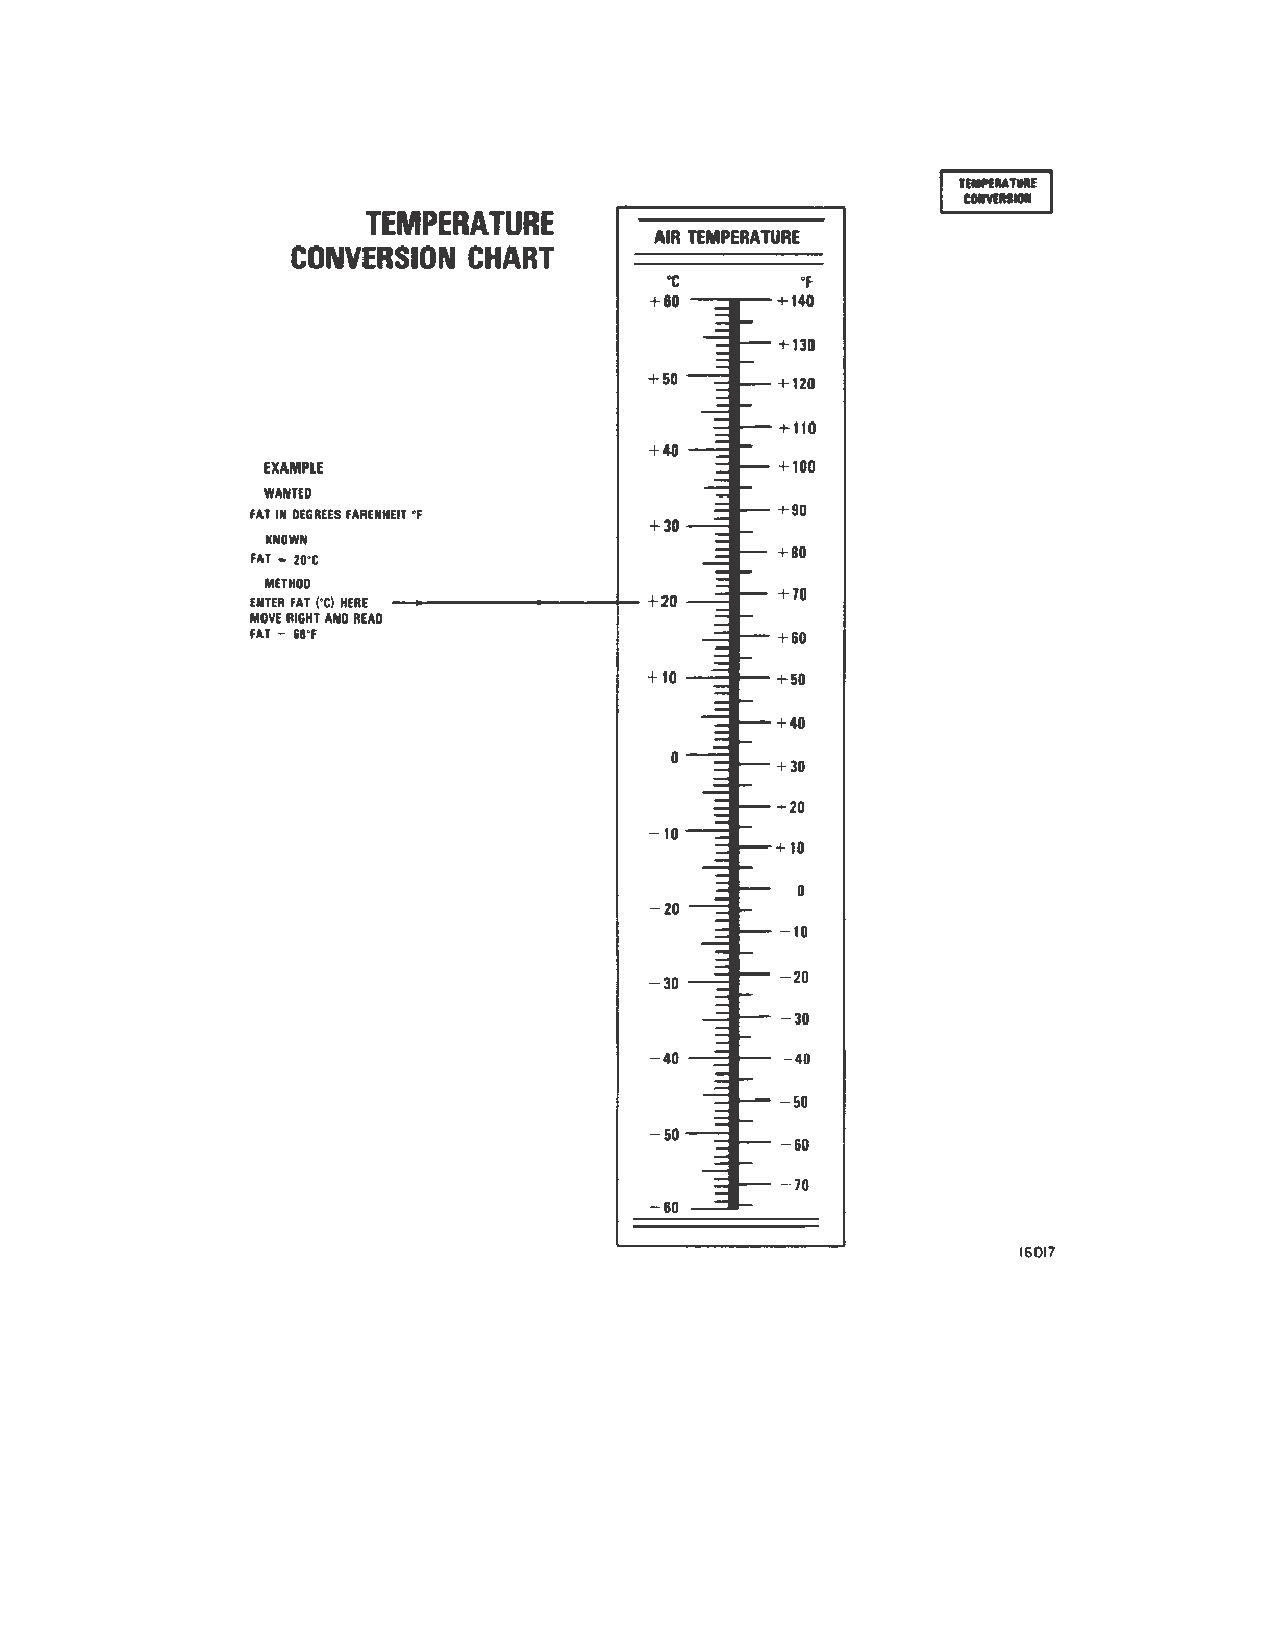
Figure 7A-1-1. Temperature Conversion Chart
7A-1-3/(7A-1-4 blank)
TM 1-1520-240-10
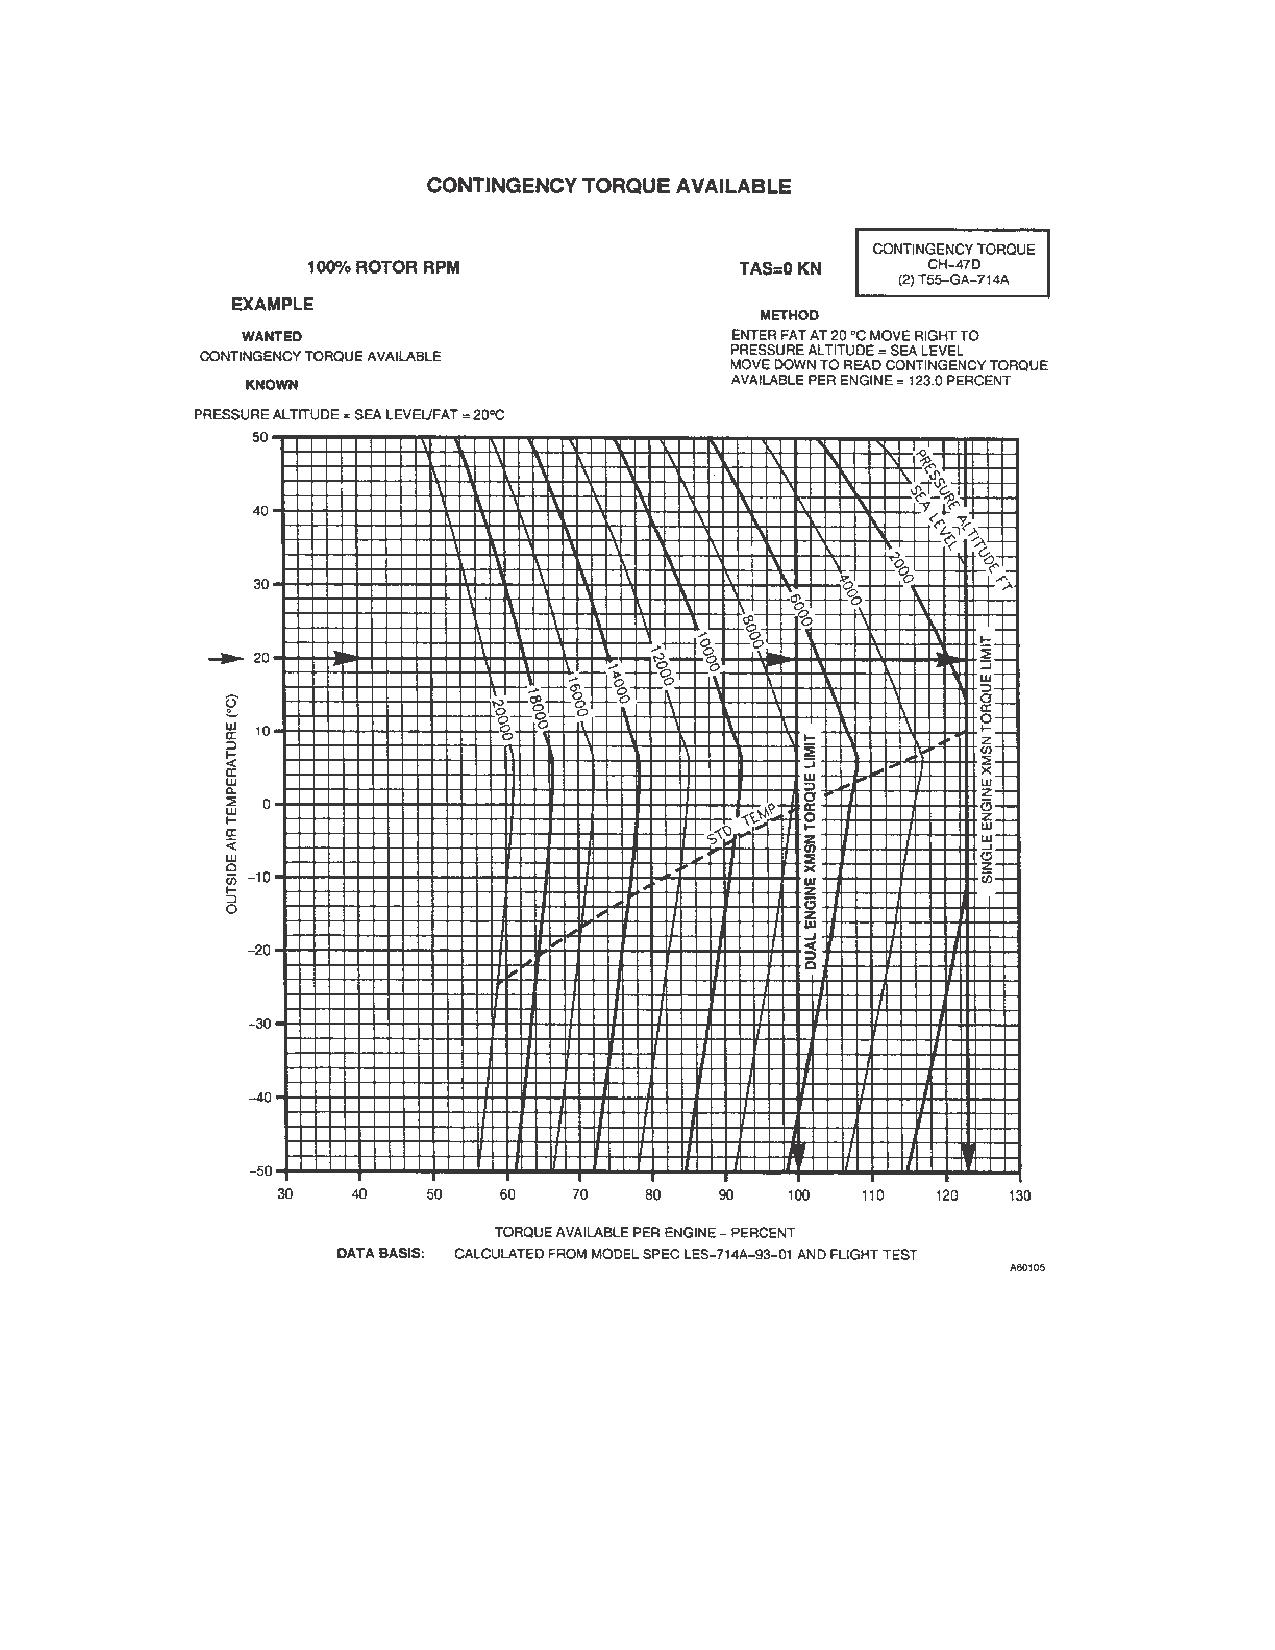
SECTION II. CONTINGENCY TORQUE AVAILABLE
7A-2-1. Contingency Torque Available.
to know PA, and FAT. Enter the left side of the chart at
known temperature, move right to known pressure alti-
Single engine contingency torque available may be ob-
tude, then down to read torque available.
tained from figure 7A-2-1. Available torque is presented
in terms of PA and FAT.
7A-2-3. Conditions.
The chart is based on a rotor speed of 100%.
7A-2-2. Use of Chart.
7A-2-4. EAPS Installed.
The primary use of the chart is to determine available
engine torque for various combinations of PA and tem-
Reduce the derived torque available by 2.0% however
perature. To determine torque available, it is necessary
not at transmission torque limit.
7A-2-1
TM 1-1520-240-10
Figure 7A-2-1. Contingency Torque Available
7A-2-2
TM 1-1520-240-10
SECTION III. MAXIMUM TORQUE AVAILABLE
7A-3-1. Maximum Torque Available (10 Minute Op-
7A-3-4. Conditions.
eration).
The chart is based on a rotor speed of 100%.
Maximum torque available (10 minute operation) may be
7A-3-5. Intermediate Torque Available (30 Minute
obtained from figure 7A-3-1. Available torque is present-
Operation).
ed in terms of pressure altitude and free air temperature.
Maximum Torque Available (30 Minute Operation) may
7A-3-2. Use of Chart.
be obtained from figure 7A-3-2. Available torque is pre-
sented in terms of PA and FAT.
The primary use of the chart is to determine available
engine torque for various combinations of pressure alti-
7A-3-6. Use of Chart.
tude and temperature. To determine torque available, it
is necessary to know pressure altitude and free air tem-
The chart is based on a rotor speed of 100%.
perature. Enter the left side of the chart at known temper-
ature, move right to known pressure altitude, then down
7A-3-7. Conditions.
to read torque available.
The chart is based on a rotor speed of 100%.
7A-3-3. EAPS Installed.
7A-3-8. EAPS Installed.
Reduce the derived torque available by 1.8% however
Reduce the derived torque available by 1.8% however
not at transmission torque limit.
not at transmission torque limit.
7A-3-1
TM 1-1520-240-10
Figure 7A-3-1. Maximum Torque Available (10 - Minute Operation)
7A-3-2
TM 1-1520-240-10
Figure 7A-3-2. Intermediate Torque Available (30 - Minute Operation)
7A-3-3/(7A-3-4 blank)
TM 1-1520-240-10
SECTION IV. CONTINUOUS TORQUE AVAILABLE
7A-4-1. Continuous Torque Available
PA and FAT. Enter the left side of the chart at known tem-
perature, move right to known pressure altitude, then down
Continuous torque available may be obtained from figure
to read torque available.
7A-4-1. Available torque is presented in terms of PA and
FAT.
7A-4-3. Conditions.
This chart is based on a rotor speed of 100%.
7A-4-2. Use of Chart
7A-4-4. EAPS Installed.
The primary use of the chart is to determine available
engine torque for various combinations of PA and tempera-
Reduce the derived torque available by 1.8% however
ture. To determine torque available, it is necessary to know
not at transmission torque limit.
7A-4-1
TM 1-1520-240-10
Figure 7A-4-1. Continuous Torque Available
7A-4-2
TM 1-1520-240-10
SECTION V. HOVER
7A-5-1. Description.
c. The hover charts may also be used to determine
maximum GW for hover at a given wheel height, PA, and
The hover chart, figure 7A-5-1, presents torque required
temperature. Enter at known pressure altitude, move
to hover at 100% RRPM at various combinations of PA,
right to the FAT, then move down to the bottom of the
FAT, GW, and wheel height for single and dual engine
lower grid, and read density altitude. Now enter lower left
operation.
grid at maximum torque available. Move up to wheel
7A-5-2. Use of Chart.
height, then move right to density altitude and read GW-
This is the maximum gross weight at which the helicopter
a. The primary use of the charts is illustrated by the
will hover.
example. To determine the torque required to hover, it is
necessary to know PA, FAT, GW, and desired wheel
height. Enter the upper right grid at the known pressure
altitude, move right to the temperature, move down to
7A-5-3. Conditions.
gross weight. Move left to desired wheel height, deflect
down and read torque required for dual engine or single
a. The hover chart is based on calm wind, level surface,
engine operation
and 100% RRPM.
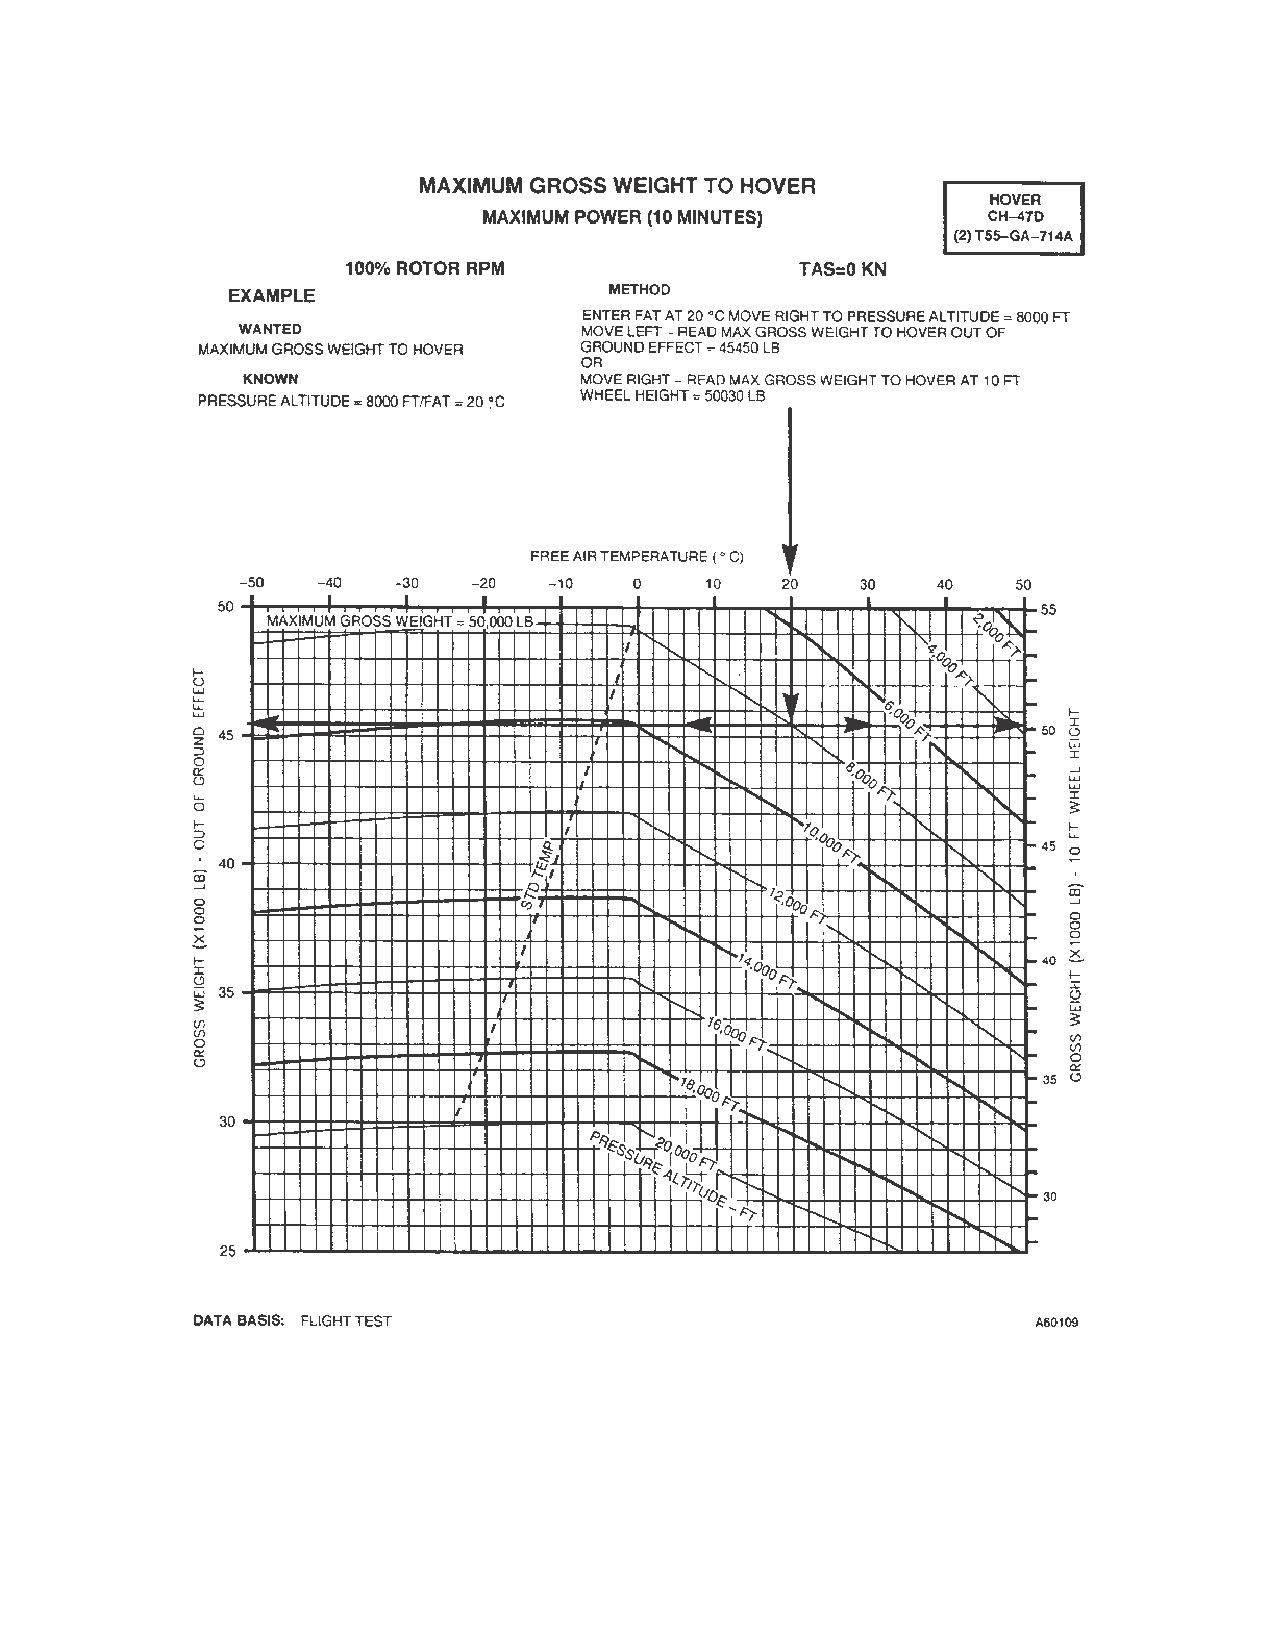
b. In addition to the primary use, the hover ceiling
charts (fig. 7A-5-2) may be used to predict maximum
hover height. This information is necessary for use of the
b. Hover in ground effect (HIGE) data is based on
takeoff chart found in figure 7A-6-1. To determine maxi-
hovering over a level surface. For normal transition from
mum hover height, it is necessary to know PA, FAT, GW,
hover to forward flight, the minimum hover wheel height
and maximum torque available. Enter at the known pres-
should be 10 feet to prevent ground contact. If helicopter
sure altitude, move right to FAT, move down to gross
is to hover over a surface known to be steep, covered
weight, move left to intersection with maximum torque
with vegetation, or if type of terrain is unknown, the flight
available and read wheel height. This wheel height is the
should be planned for hover out of ground effect (HOGE)
maximum hover height.
capability.
7A-5-1
TM 1-1520-240-10
Figure 7A-5-1. Hover Chart
7A-5-2
TM 1-1520-240-10
Figure 7A-5-2. Hover Ceiling
7A-5-3/(7A-5-4 blank)
TM 1-1520-240-10
SECTION VI. TAKEOFF
7A-6-1. Description.
b. A hover check should be made prior to takeoff to
verify hover capability. If winds are present, hover capa-
The takeoff chart, figure 7A-6-1, defines distances re-
bility will be greater than predicted since the hover chart
quired to clear obstacles of 50 feet, 100 feet, 150 feet,
is based on calm wind conditions.
and 200 feet based upon maximum hover height capabil-
ity and true airspeed. The procedure for takeoff is the
level flight acceleration technique. The maximum hover
7A-6-3. Conditions.
heights shown are indicative of helicopter performance
capability and do not imply that this hover height must be
maintained through takeoff.
a. The takeoff chart is based on calm wind condi-
NOTE
tions. Since the surface wind velocity and direction can-
not be accurately predicted, all takeoff planning should
The maximum hover heights shown are indic-
be based on calm air conditions. Takeoff into the wind will
ative of helicopter performance capability and
improve takeoff performance.
do not imply that this hover height must be
maintained through takeoff.
7A-6-2. Use of Chart.
The primary use of the chart is illustrated by the exam-
CAUTION
ples.
a. To determine the distance required to clear an
A tailwind during takeoff and climb - out
obstacle, it is necessary to know maximum hover height
will increase the distance for obstacle
(hover capability), obstacle height, and climbout true air-
clearance and may prevent a successful
speed. Calculation of maximum hover height is de-
takeoff.
scribed in Section V, Hover. Enter the chart for the re-
quired obstacle height, move right to desired true
climbout airspeed, then down and read distance required
b. Takeoff performance data are based on the use
to clear obstacle.
of maximum torque available at 100% RRPM
7A-6-1
TM 1-1520-240-10
(2) T55-GA-714A
Figure 7A-6-1. Takeoff Chart
7A-6-2
TM 1-1520-240-10
SECTION VII. CRUISE
7A-7-1. Description.
b. Torque. Since PA and temperature are defined
for each chart, torque required varies only with GW and
The cruise charts, figures 7A-7-1 through 7A-7-84, pres-
airspeed. The torque required per engine as presented
ent torque requirements and fuel flow for cruise flight as
on the charts is for dual engine operation. The torque
a function of airspeed and gross weight for various com-
required for single engine operation is double the dual
binations of pressure altitude and free air temperature.
engine torque value for any given condition. See cruise
Dot pattern (shaded) area indicates time limited opera-
chart example 2 for example on torque required. The
tion
torque available limits shown are either transmission or
engine torque limits (whichever is least).
7A-7-2. Use of Charts.
The primary use of charts is illustrated by the example
c. Fuel Flow. The fuel flow scales presented on
cruise chart (fig. 7A-7-1). To use the charts it is usually
each chart opposite the torque scales are for dual engine
necessary to know the planned PA, estimated FAT,
operation. Torque may be converted directly to fuel flow
planned cruise TAS, and the GW. First select the proper
on any chart without regard to other chart information. A
chart based on PA and free air temperature. Enter the
single engine fuel flow chart is presented in Section X.
chart at the cruise TAS, move right and read IAS, move
Torque required for any given condition as obtained from
left to the GW, move down and read torque required, then
the preceding cruise charts should be doubled before
move up and read associated fuel flow. Maximum perfor-
being used to obtain single engine fuel flow from this
mance conditions are determined by entering the chart
chart.
where the maximum range line or maximum endurance
and rate of climb (R/C) line intersect the gross weight
d. Maximum Range. Maximum range lines indicate
line: then read airspeed, fuel flow, and torque required.
optimum GW/cruise speed conditions with respect to dis-
Normally, sufficient accuracy can be obtained by select-
tance covered per pound of fuel consumed for zero wind
ing the chart nearest to the planned cruising altitude and
condition.
FAT, or move conservatively, by selecting the chart with
the next higher altitude and FAT (example cruise chart,
e. Maximum Endurance and Rate of Climb. Maxi-
method one). If greater accuracy is required, interpola-
mum endurance and rate of climb lines indicate optimum
tion between altitudes and/or temperatures is permissi-
GW / cruise speed conditions for maximum endurance
ble (example cruise chart, method two). To be conserva-
and maximum rate of climb. These conditions require
tive, use the GW at the beginning of the cruise flight. For
minimum fuel flow (maximum endurance) and provide
improved accuracy or long flights, it is preferable to deter-
maximum torque change for climb (maximum rate of
mine cruise information for several flight segments to
climb). This airspeed also represents the best single
allow for decreasing GW.
engine airspeed.
a. Airspeed. True and indicated airspeeds are pre-
sented at opposite sides of each chart. On any chart, IAS
7A-7-3. Conditions.
can be directly converted to TAS (or vice versa) by read-
ing directly across the chart without regard to other chart
information. Estimated airspeed limits with an operating
The cruise charts are based on 100% RRPM for ambient
CGI appear as dashed lines on each chart. Airspeed
temperatures of -10_C and above, and 98% and 100%
limits with the CGI inoperative are presented in the air-
RRPM for ambient temperatures of -20_C and below.
speed limits section of Chapter 5.
NOTE
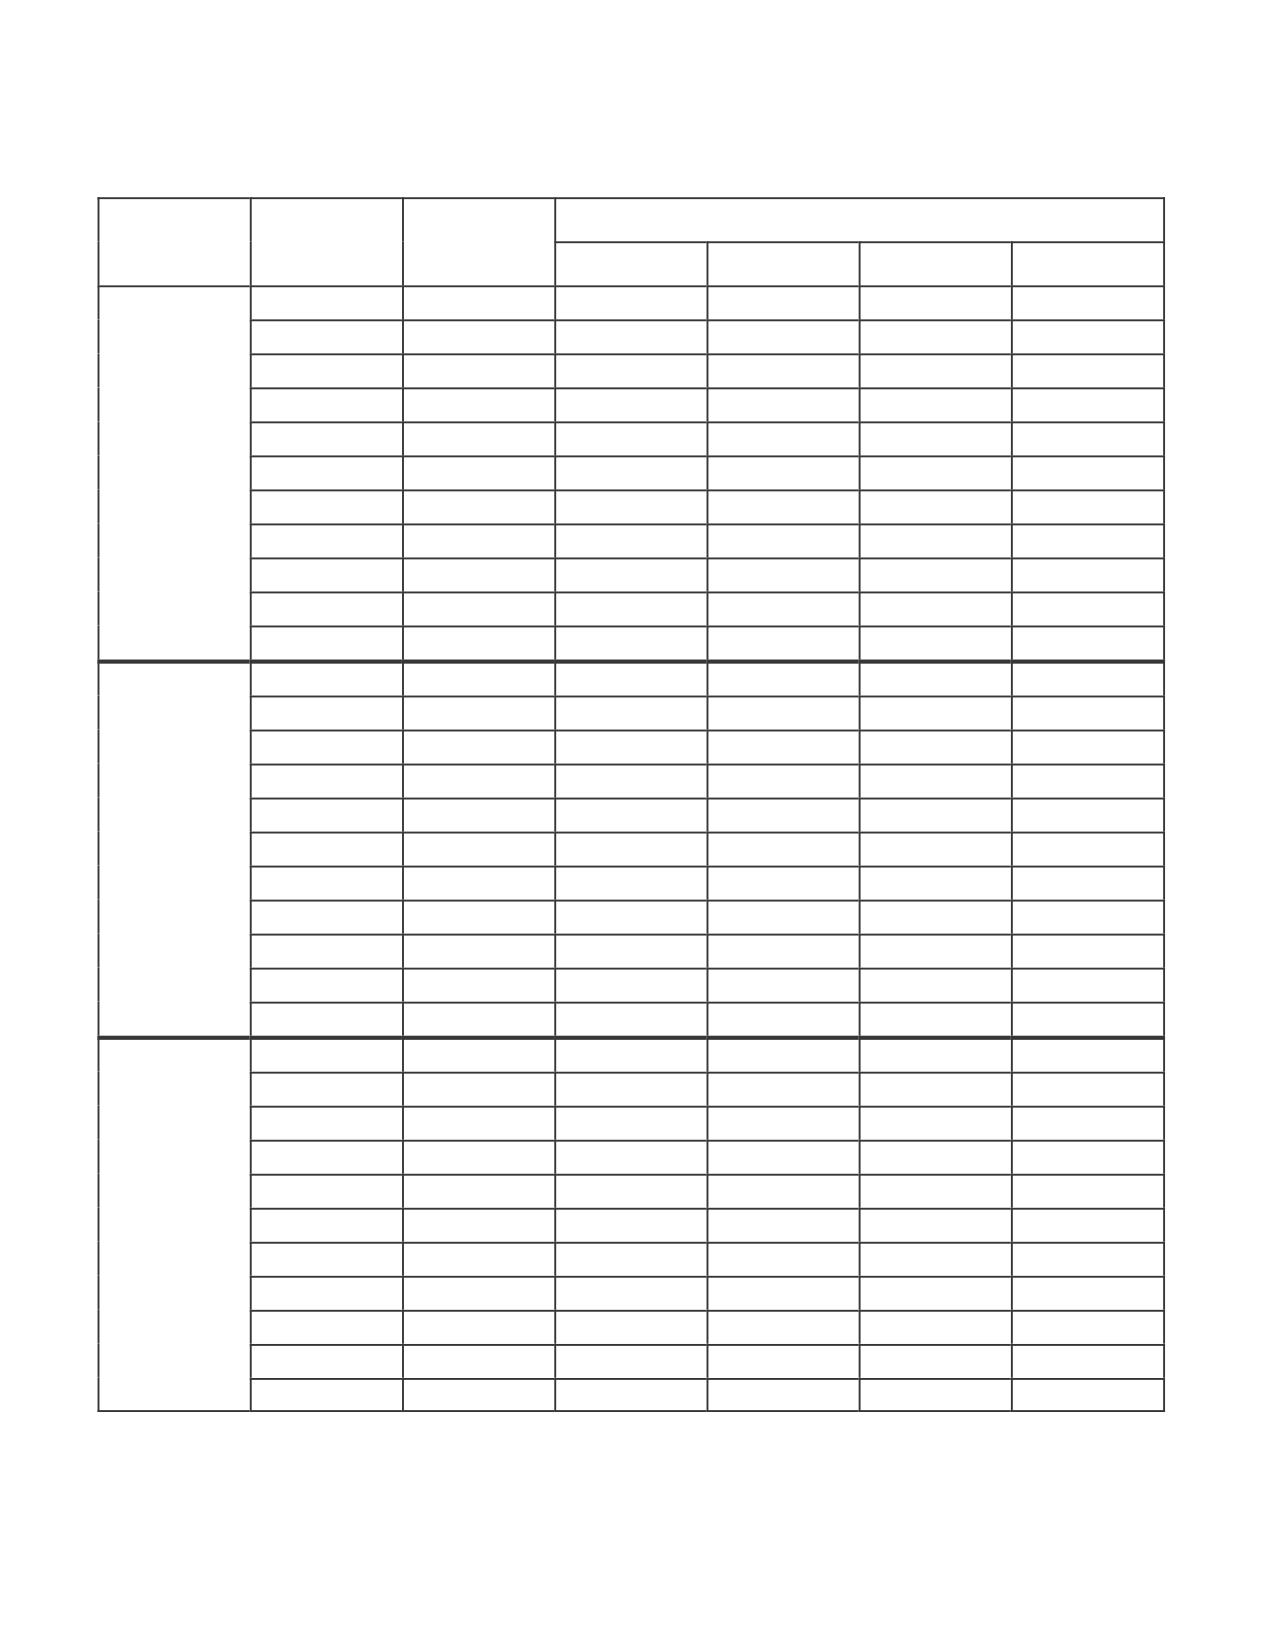
7A-7-4. Performance Penalties with EAPS.
Airspeed limitations with an operative cruise
guide indicator are per the indicator display.
The engine performance loss with EAPS installed is
Estimated values shown on these cruise
shown in the table 7A-7-1. The corrections shown in the
charts are for information only, as an aid to
table are to be applied to the applicable performance
pre-flight planning.
data shown in Chapter 7.
7A-7-1
TM 1-1520-240-10
Table 7A-7-1. EAPS Penalty Table
Increase Total
Decrease Torque Available (%)
Fuel Flow By
Pressure
OAT
(lb/hr)
KTAS = 0
85
135
160
Altitude (ft)
(_C)
Seal Level
-50
40
0
0
0
0
-40
40
0
0
0
0
-30
40
0
0
0
0
-20
40
0
0
0
0
-10
40
0
0
0
0
0
40
0
0
0
0
10
40
0
0
0
0
20
40
0
0
3
5
30
40
2
3
6
8
40
40
2
3
6
8
50
40
2
3
6
8
2000
-50
40
0
0
0
0
-40
40
0
0
0
0
-30
40
0
0
0
0
-20
40
0
0
0
0
-10
40
0
0
0
0
0
40
0
0
0
0
10
40
0
0
3
5
20
40
2
3
6
9
30
40
2
3
6
8
40
40
2
3
6
8
50
40
2
3
6
8
4000
-50
40
0
0
0
0
-40
40
0
0
0
0
-30
40
0
0
0
0
-20
40
0
0
0
0
-10
40
0
0
0
0
0
40
0
0
0
0
10
40
2
3
6
9
20
40
2
3
6
9
30
40
2
3
6
8
40
40
2
3
6
8
50
40
2
3
6
8
7A-7-2