Military reference books and manuals (2009-2023, Volume 7) - page 16
Chapter 2
Inductive Reasoning
2-6. Inductive reasoning is an approach in which a drawn conclusion is based upon observed facts. It is a
process of discovery in which an analyst establishes a relationship between events under observation or
study. Induction normally precedes deduction and is the type of reasoning analysts are required to perform
most frequently. It requires objectivity and the elimination of prejudices and preconceptions. The first step
of inductive reasoning is reaching a conclusion formulated on facts gathered by direct observation.
2-7. Unlike deductive reasoning, inductive reasoning can be a new source of knowledge; however, to be
used correctly, the analyst must be wary that their personal bias may skew the results. Inductive reasoning
is dependent upon accurate observation and statistics. Tainted data negatively affects inductive reasoning;
therefore, this reasoning cannot produce absolute truth, only very high probabilities. For example, if a
unit’s patrols are being ambushed along route blue from 0500 to 1800 four to six days a week; inductive
reasoning would lead to the conclusion that there is a 57 to 85 percent chance that daily patrols would be
attacked.
Analogical Reasoning
2-8. Analogical reasoning is a method of processing information that compares the similarities between
new concepts and understood concepts; then those similarities are used to gain an understanding of the new
concept. Consider the following two incidents:
z
First, a patrol diverts around an obstacle and subsequently comes under fire from the roof of an
abandoned building.
z
Second, a convoy diverts around a destroyed section of road, taking an alternate route and
subsequently encounters an ambush from surrounding hilltops.
2-9. The analogy that can be drawn from these two incidents is this: when obstacles force us into an
unplanned route, beware of ambush from elevation or concealment.
Deductive Reasoning
2-10. Deductive reasoning applies general rules to specific problems to arrive at conclusions. Analysts
begin with a set of rules and use them as a basis for interpreting information. A deductive argument is
sound if its premises are true. However, sound deductive reasoning does not mean the conclusions are true.
For example, an analyst who follows the conduct of improvised explosive device (IED) attacks in an AO
might notice that a characteristic series of events preceded the last IED attack. Upon seeing evidence that
those same events are recurring, the analyst might deduce that another IED attack may occur. However, this
conclusion should be made cautiously, as deduction is not always effective in forecasting human behavior;
and, as stated previously, sound reasoning does not guarantee the conclusion is true.
Abductive Reasoning
2-11. Abductive reasoning describes the thought process that accompanies insight or intuition. When the
information does not match what is expected, the analyst must determine the reason, thereby generating a
new hypothesis that explains why the given evidence does not readily suggest a familiar explanation. For
example, a group of people have been aiding U.S. operations in a particular area for several months; that
support has now stopped. In fact, reports indicate this group has been supporting insurgent forces.
Abductive reasoning will lead to the analyst looking at this situation to ask why this dynamic has changed,
as well as to develop and test possible explanations.
2-12. The quality of any type of reasoning is based on how well that individual’s analytical skills have
been developed. Skills are developed through practice and application. Each of these skills can be improved
through the implementation of individual courses of study and organizational training strategies.
CRITICAL AND CREATIVE THINKING
2-13. Critical thinking is a deliberate process of thought whose purpose is to improve our thought. The
elements of thought (the parts of our thinking) and the standards of thought (the quality of our thinking)
2-2
ATP 2-33.4
18 August 2014

Analytic Skills
support critical thinking. Key critical thinking attributes include human traits such as intellectual courage,
integrity, and humility. Creative thinking involves creating something new or original.
2-14. Analysts use thinking to transform information into intelligence. Critical thinking can improve many
tasks and processes across Army operations, especially the conduct of intelligence analysis. Critical
thinking includes the intellectually disciplined activity of actively and skillfully analyzing and synthesizing
information. The key distinction in critical thinking is a reflective and self-disciplined approach to thinking.
2-15. For the analyst, the first step in building critical thinking skills is to begin a course of personal study
and practice with a goal of improving the ability to reason. This means moving outside the Army body of
doctrine and other Army professional writing when beginning this study. The vast majority of the body of
thought concerning critical thinking is spread throughout various civilian professions, particularly in
academia. The discussion in this publication is intended to be an introduction that serves as a glimpse of
what should become a professional endeavor.
2-16. The Army has used many different sources in its doctrinal discussions of critical thinking. Among
those most cited, as well as those used in the development of this discussion, are Dr. Richard Paul and Dr.
Linda Elder of the Foundation for Critical Thinking. This foundation has developed many products useful
to Army leaders and Soldiers in developing critical thinking skills. Of these, the elements of thought,
intellectual standards, and intellectual traits are the most useful tools analysts can initially apply to further
their critical thinking skills. These skills can also aid in avoiding the common pitfalls of undisciplined
thinking. These analytic pitfalls—logic fallacies, biases, and misusing analogies—are discussed beginning
at paragraph 2-32.
ELEMENTS OF THOUGHT
2-17. There are eight basic elements present in all thinking. Figure 2-1 illustrates these elements.
Figure 2-1. The elements of thought
18 August 2014
ATP 2-33.4
2-3
Chapter 2
2-18. Whenever we think, we think for a purpose within a point of view based on assumptions leading to
implications and consequences. We use concepts, ideas, and theories to interpret data, facts, and
experiences in order to answer questions, solve problems, and resolve issues. These eight elements help
describe how critical thinking works:
z
Element 1—Purpose. All thinking has a purpose. Critical thinkers will state the purpose clearly.
Being able to distinguish the purpose from other related purposes is an important skill critical
thinkers possess. Checking periodically to ensure staying on target with the purpose is also
important.
z
Element 2—Question at Issue. All thinking is an attempt to figure something out, to settle
some question, or to solve some problem. A critical thinker is able to state questions clearly and
precisely, express the questions in several ways to clarify their meaning and scope, and break the
questions into sub-questions.
z
Element 3—Information. All thinking is based on data, information, and evidence. Critical
thinkers should support their conclusions with relevant information and be open to actively
searching for information that supports as well as contradicts a position. All information should
be accurate, clear, and relevant to the situation being analyzed.
z
Element 4—Interpretation and Inference. All thinking contains interpretations and inferences
by which to draw conclusions and give meaning to data. Critical thinkers should be careful to
infer only what the evidence implies and to crosscheck inferences with each other. They should
clearly identify the assumptions and concepts which led to the inferences being made.
Alternative inferences or conclusions should be considered. Developing and communicating
well-reasoned inferences is the most important part of what intelligence analysts provide because
of the role it plays in aiding situational understanding and decisionmaking.
z
Element 5—Concepts. All thinking is expressed through, and shaped by, concepts. A concept is
a generalized idea of a thing or a class of things. People do not always share the same concept of
a thing. For example, the concept of happiness means something different to each of us. This is
because happiness comes in many different forms. For a star athlete happiness may be winning
and for a mother happiness may be seeing her children do well. Critical thinkers identify the
meaning they ascribe to the key concepts used in their arguments and determine if others in their
group ascribe different meanings to those concepts to ensure effective communication.
z
Element 6—Assumptions. All thinking is based, in part, on assumption. An assumption is a
proposition accepted to be true without the availability of fact to support it. Assumptions are
layered throughout our thinking and are a necessary part of critical thinking. The availability of
fact determines the amount of assumption an analyst must use in analysis. Critical thinkers
clearly identify their assumptions and work to determine if they are justifiable.
z
Element
7—Implications and Consequences. All thinking leads somewhere or has
implications and consequences. Analysts should take the time to think through the implications
and consequences that follow from their reasoning. They should search for negative as well as
positive implications.
z
Element 8—Point of View. All thinking is done from some point of view. To think critically
analysts must recognize a point of view, seek other points of view, and look at them fair-
mindedly for their strengths and weaknesses.
CHECKLIST FOR REASONING
2-19. By applying the eight elements of thought, analysts can develop a checklist for reasoning.
Developing and using a checklist, as shown in table 2-1, can help analysts focus their efforts to a specific
problem and avoid wasting time on irrelevant issues or distractions.
2-4
ATP 2-33.4
18 August 2014
Analytic Skills
Table 2-1. Checklist for reasoning
Element
Explanation
Purpose
All reasoning has a purpose. Failure to identify the purpose causes problems
throughout the analytical effort:
• Express the purpose clearly.
• Distinguish the purpose from similar purposes.
• Check periodically to be sure you are still on target.
• Choose significant and realistic purposes.
Question at
All reasoning is an attempt to figure something out, to answer some question, to
Issue
meet some requirement:
• State the question at issue clearly and precisely.
• Express the question in several ways to clarify its meaning and scope.
• Carefully break the question into sub-questions.
• Distinguish questions that have definitive answers from those that are a matter of
opinion and from those that require consideration of multiple viewpoints.
Information
All reasoning is based on data and information:
• Only state facts as facts and clearly identify the assumptions used to help form
conclusions.
• Search for information that opposes your position as well as information that
supports it.
• Make sure all information used is clear, accurate, and relevant to the question at
issue.
• Make sure you have gathered sufficient information.
Interpretation
All reasoning contains inferences or interpretations by which we draw conclusions
and Inference
and give meaning to data:
• Infer only what the evidence implies.
• Check inferences for their consistency with each other.
• Identify assumptions underlying your inferences.
Note. Inferring involves uncertainty. All analysts must deal with different degrees of uncertainty.
The complexity of a situation and the availability of information both determine the amount of
uncertainty that will exist.
Concepts
All reasoning is expressed through, and shaped by, concepts and ideas:
• Identify key concepts and explain them clearly.
• Consider alternative concepts or alternative definitions to concepts.
• Make sure you are using concepts with precision.
Assumptions
All reasoning includes assumptions:
• Clearly identify your assumptions to your audience and explain how you
determined these assumptions are justifiable.
• Work to discover deep-held personal assumptions that can affect your analysis.
Implications
All reasoning leads somewhere or has implications and consequences:
and
• Trace the implications and consequences that follow from your reasoning.
Consequences
• Search for negative and positive implications.
• Consider all possible consequences.
Point of View
All reasoning is done from some point of view:
• Identify your point of view.
• Seek points of view from other analysts related to threat and other significant
aspects of the operational environments and identify their strengths and
weaknesses.
• Strive to be fair-minded when considering other points of view.
INTELLECTUAL STANDARDS
2-20. When critical thinkers take apart their thinking and examine its parts, they use standards of quality
we refer to as the intellectual standards or standards for thought. While the elements of thought provide a
framework for analyzing thinking, the standards of thought provide criteria critical thinkers use to assess
18 August 2014
ATP 2-33.4
2-5
Chapter 2
the quality of thinking. The effectiveness of intelligence analysis and resulting products can be measured
against these nine intellectual standards:
z
Standard 1—Clarity. Clarity is the gateway standard. If the questions we are trying to answer,
the information we are using, the inferences we are making, and the assumptions that guide our
thinking are unclear, we cannot determine whether they are accurate, relevant, logical, or
justifiable. Analysts should strive, therefore, to provide information in a very clear manner that
is understood by the audience.
z
Standard 2—Accuracy. To be accurate is to represent something in accordance with the way it
actually is. People often describe things or events inaccurately. Critical thinkers listen carefully
to statements and, when there is reason for skepticism, they question whether what they hear is
true or accurate. A statement describing an implication, assumption, inference, or the very
question we are trying to answer may be clear but not accurate.
Note. Because we tend to think from an egocentric and/or socio-centric perspective, assessing
the accuracy of our own ideas can be difficult. We often tend to believe that our thoughts are
accurate just because they are ours; therefore, the thoughts of those that disagree with us are
inaccurate. We also often fail to question statements others make that agree with what we
already believe.
z
Standard 3—Precision. To be precise is to give the details needed for someone to understand
exactly what is meant. Precise thinking seeks out more details and greater specificity when
necessary. You can apply the standard of precision to evaluate how detailed the question is that
you are answering, or how detailed it needs to be. Precision is also the standard to determine if
assumptions and facts contain enough detail to evaluate them using the standards of relevance,
clarity, and accuracy. However, you should never sacrifice clarity for precision.
z
Standard 4—Relevance. Something is relevant when it is connected with and bears upon the
question we are reasoning through. Something is also relevant when it is pertinent or applicable
to a problem we are trying to solve. Relevant thinking also encourages us to identify facts,
information, questions, assumptions, implications, and points of view that we should set aside as
not being pertinent to the main issue. Thinking that is relevant stays on track. People are often
irrelevant in their thinking because they lack discipline in their thinking. They wander into side
issues that may be intellectually satisfying to discuss but have no bearing on the issue or
question.
z
Standard 5—Depth. We think deeply when we get beneath the surface of an issue or problem.
Depth of thinking is also present when we identify its inherent complexities, and then deal with
those complexities not superficially but in an intellectually responsible way. Intelligence analysis
generally involves the examination of complex situations and requires deep conclusions.
z
Standard 6—Breadth. When we consider the issue from every relevant viewpoint, we think in
a broad way. Multiple points of view that are pertinent to the issue are given due consideration.
You think broadly about an issue when you recognize other viewpoints and intellectually
empathize with those contrary viewpoints so as to understand them. Breadth of thinking
improves the quality of the inferences and recommendations developed during intelligence
analysis.
z
Standard 7—Logic. When we think, we bring together thoughts in some order. When the
combined thoughts are mutually supporting and make sense, the thinking is logical. If
information, inferences, and so forth, are contradictory, if they do not make sense together, they
are illogical.
z
Standard 8—Significance. When we reason, we want to concentrate on the most important
information and take into account the most important ideas or concepts to answer the question.
Too often, we fail in our thinking because we do not recognize that although many ideas may be
relevant to an issue, they are not equally important.
z
Standard 9—Fairness. To think fairly is to think in accordance with reason and take into
account the views of others. Fairness as a standard helps us deal with our propensity for self-
deception. Personal biases and ego creep easily into our thinking. When gauging the fairness of a
2-6
ATP 2-33.4
18 August 2014
Analytic Skills
decision, the critical thinker asks, “Do my selfish interests distort this thinking or is my decision
fair to all concerned?” The fairness standard seeks to prevent egocentric thinking. As one’s ego
enters the thought process, critical thinking becomes poisoned.
APPLYING THE ELEMENTS AND STANDARDS
2-21. When an analyst exercises self-discipline and thoughtfully analyzes thinking (using the elements of
thought) and then assesses the quality of the elements using intellectual standards, the result is a solid
foundation for critical thinking. It is important to remember that critical thinking is a deliberate choice.
Critical thinking requires self-discipline and a commitment to improve the skills that support this approach.
While critical thinking cannot necessarily solve every problem an analyst may face (because some are so
complex), it can ensure that every analyst is more effective and efficient while conducting the different
intelligence tasks, especially those that are the most complicated or ambiguous.
ESSENTIAL INTELLECTUAL TRAITS
2-22. Intellectual traits are the traits of mind and character necessary to support reasoning. Analysts should
repeatedly apply and practice the elements of thought and intellectual standards to help develop intellectual
traits. Intellectual traits include, but are not limited to—
z
Fair-mindedness.
z
Intellectual humility.
z
Intellectual courage.
z
Intellectual empathy.
z
Intellectual integrity.
z
Intellectual perseverance.
z
Confidence in reason.
z
Intellectual autonomy.
2-23. The following are brief descriptions of the essential intellectual traits, along with related questions
that foster their development.
Fair-Mindedness
2-24. A fair-minded thinker strives to treat every relevant viewpoint in an unbiased, unprejudiced way.
Fair-mindedness entails an awareness that we tend to prejudge the views of others, placing them into
favorable (agrees with us) and unfavorable (disagrees with us) categories. We tend to give less weight to a
contrary view than to our own. This is especially true when we have selfish reasons for opposing such
views. Fair-minded thinkers try to see the strengths and weaknesses of any reasoning they assess. Fair-
mindedness entails a conscious effort to treat all viewpoints alike in spite of one’s own feelings or selfish
interests, or the feelings of one’s friends, company, community, or social organization. Questions that
foster fair-mindedness include—
z
Am I considering how my behavior might make others feel?
z
Is my reason for doing that fair to everyone?
Intellectual Humility
2-25. Intellectual humility is knowledge of ignorance, sensitivity to what you know and what you do not
know. It means being aware of your biases, prejudices, self-deceptive tendencies and the limitations of your
viewpoint. Questions that foster intellectual humility include—
z
What do I really know (about myself, about the situation, about another person, about what is
going on in the world)?
z
To what extent do my prejudices or biases influence my thinking?
18 August 2014
ATP 2-33.4
2-7
Chapter 2
Intellectual Courage
2-26. Intellectual courage is the disposition to question beliefs you feel strongly about. It includes
questioning the beliefs of your culture and the groups to which you belong, and a willingness to express
your views even when they are unpopular. Questions that foster intellectual courage include—
z
To what extent have I analyzed and questioned the beliefs I hold?
z
To what extent have I demonstrated a willingness to give up my beliefs when sufficient evidence
is presented against them?
z
To what extent am I willing to stand up against the majority (even though people ridicule me)?
Intellectual Empathy
2-27. Intellectual empathy is awareness of the need to actively entertain views that differ from our own,
especially those we strongly disagree with. It is to accurately reconstruct the viewpoints and reasoning of
our opponents and to reason from premises, assumptions, and ideas other than our own. Questions that
foster intellectual empathy include—
z
To what extent do I accurately represent viewpoints I disagree with?
z
Can I summarize the views of my opponents to their satisfaction? Can I see insights in the views
of others and prejudices in my own?
z
Do I sympathize with the feelings of others in light of their thinking differently from me?
Intellectual Integrity
2-28. Intellectual integrity consists of holding yourself to the same intellectual standards you expect others
to honor (no double standards). Questions that foster intellectual integrity include—
z
Do I behave in accordance with what I say I believe, or do I tend to say one thing and do
another?
z
To what extent do I expect the same of myself as I expect of others?
z
To what extent are there contradictions or inconsistencies in my views?
z
To what extent do I strive to recognize and eliminate self-deception in my views?
Intellectual Perseverance
2-29. Intellectual perseverance is the disposition to work your way through intellectual complexities
despite the frustration inherent in the task. Questions that foster intellectual perseverance include—
z
Am I willing to work my way through complexities in an issue or do I tend to give up when I
experience difficulty?
z
Can I think of a difficult intellectual problem with which I have demonstrated patience and
determination in working through the difficulties?
Confidence in Reason
2-30. Confidence in reason is based on the belief that one’s own higher interests and those of humankind
are best served by giving the freest play to reason. It means using standards of reasonability as the
fundamental criteria by which to judge whether to accept or reject any belief or position. Questions that
foster confidence in reason include—
z
Am I willing to change my position when the evidence leads to a more reasonable position?
z
Do I adhere to principles of sound reasoning when persuading others of my position or do I
distort matters to support my position?
z
Do I deem it more important to “win” an argument or see the issue from the most reasonable
perspective?
z
Do I encourage others to come to their own conclusions or do I try to force my views on them?
2-8
ATP 2-33.4
18 August 2014
Analytic Skills
Intellectual Autonomy
2-31. Intellectual autonomy is thinking for oneself while adhering to standards of rationality. It means
thinking through issues using one’s own thinking rather than uncritically accepting the viewpoints of
others. Questions that foster intellectual autonomy include—
z
To what extent am I a conformist?
z
Do I think through issues on my own or do I merely accept the views of others?
z
Having thought through an issue from a rational perspective, am I willing to stand alone despite
the irrational criticisms of others?
AVOIDING ANALYTICAL PITFALLS
2-32. Critical thinking is a mental process that is subject to numerous influences. Intelligence analysts
involved in analyzing complex situations and making conclusions are prone to the influences that shape and
mold their view of the world and their ability to reason. These influences are referred to as analytical
pitfalls. The elements of thought, intelligence standards, and intellectual traits aid analysts in recognizing
these pitfalls in their own analysis and the analysis performed by others. Logic fallacies and biases are two
general categories of analytical pitfalls.
LOGIC FALLACIES
2-33. Logic fallacies are errors in the reasoning process caused by the failure to apply sound logic.
Although usually committed unintentionally, these fallacies are sometimes used deliberately to persuade,
convince, or deceive. An analyst must be able to recognize logic fallacies so a false line of reasoning will
not distract them and lead to poor conclusions. This chapter discusses the fallacies of relevance, omission,
and assumption.
Fallacies of Relevance
2-34. These fallacies appeal to evidence or examples that are irrelevant to the argument at hand.
z
Appeal to force: (Argumentum ad Baculum, or the “Might-Makes-Right” Fallacy): This
argument uses force, the threat of force, or some other unpleasant backlash to make the audience
accept a conclusion. It commonly appears as a last resort when evidence or rational arguments
fail to convince. Logically, this consideration has nothing to do with the merits of the points
under consideration.
z
Genetic fallacy: The genetic fallacy is the claim that, because an idea, product, or person must
be wrong because of its origin. For example, “That car can't possibly be any good! It was made
in Japan!” Or, “Why should I listen to her argument? She comes from California, and we all
know those people are flakes.” This type of fallacy is closely related to the fallacy of
argumentum ad hominem, below.
z
Argumentum ad hominem (literally “Argument to the Man”; also called “poisoning the well”
and “personal attack”): This fallacy seeks to discount evidence before it is presented, most often
by discrediting the source. For example, an ardent spokesman against the value of strategic
bombing states: “You can’t trust that man’s testimony regarding the effectiveness of strategic
bombing; he’s employed by the Air Force.” The speaker is trying to discredit contrary evidence
by creating the specific impression that the testimony is biased because the testifier represents a
certain organization. There are two subcategories:
Abusive: To argue that proposals, assertions, or arguments must be false or dangerous because
of an irrational psychological transference with the originator (that is, Christians or Muslims).
Circumstantial: To argue that opponents should accept or refute an argument only because
of circumstances in their lives is a fallacy. If one’s threat is an imam, suggesting that he
should accept a particular argument because not to do so would be incompatible with the
Koran is a circumstantial fallacy. The opponent’s special circumstances do not affect the
truth or untruth of a specific contention. The speaker or writer must find additional evidence
beyond that to make a strong case.
18 August 2014
ATP 2-33.4
2-9
Chapter 2
z
Argumentum ad populum (“argument to the people"): This fallacy uses an appeal to popular
assent, often by arousing the feelings and enthusiasm of the multitude rather than building an
argument. It is a favorite device with the propagandist, the demagogue, and the advertiser. There
are three basic approaches:
Bandwagon approach: “Everybody is doing it.” This argumentum ad populum asserts that,
since the majority of people believes an argument or chooses a particular course of action
(COA), the argument must be true or the COA must be the best one. For instance, “Over a
million people purchased that phone rather than one with competing software; all those
people can’t be wrong. That company must make the best phones.” Popular acceptance of
any argument does not prove it to be valid.
Patriotic approach: “Draping oneself in the flag.” This argument asserts that a certain
stance is true or correct because it is somehow patriotic, and that those who disagree are
somehow unpatriotic. It overlaps with pathos and argumentum ad hominem to a certain
extent. The best way to spot it is to look for emotionally charged terms like Americanism,
rugged individualism, motherhood, patriotism, or godless communism. A true American
would never use this approach: “And a truly free man will exercise his American right to
drink beer, since beer belongs in this great country of ours.”
Snob approach: This type of argumentum ad populum does not assert “everybody is doing it,”
but rather that “all the best people are doing it.” For instance, “The top analysts at the Central
Intelligence Agency agree that my analytic approach is correct.” The implication is that anyone
who fails to recognize the truth of the analyst’s assertion is not an equal to the “top analysts of
the Central Intelligence Agency,” and thus has no right to question the analytic conclusions.
z
Appeal to tradition (argumentum ad traditio): This line of thought asserts that a premise must
be true because people have always believed it or done it. Alternatively, it may conclude that the
premise has always worked in the past and will thus always work in the future.
Fallacies of Omission
2-35. Fallacies of omission occur when an analyst leaves out necessary material in a conclusion or
inference. Some fallacies of omission include oversimplification, composition, division, post hoc, false
dilemma, hasty generalization, and special pleading.
z
Oversimplification is a generality that fails to adequately account for all the complex conditions
bearing on a problem. Oversimplification results when one or more of the complex conditions
pertaining to a certain situation is omitted and includes ignoring facts, using generalities, and/or
applying an inadequately qualified generalization to a specific case. For example, an ordnance
specialist inspecting a captured, handcarried, surface-to-air missile launcher concludes that the
threat has no effective low-level air defense. The assessment is based on the fact that the
weapons system is equipped with antiquated guidance mechanisms. The ordnance specialist’s
conclusion omits the following considerations:
That this piece of equipment may not be the enemy’s only low-level air defense weapon.
That the launcher may have been planted by the threat to give a misleading picture of the
threat’s true capabilities and deceive weapons experts.
That the threat abandoned the launcher because it was ineffective and more capable systems
were available.
z
Fallacy of composition is committed when a conclusion is drawn about a whole based on the
features of parts of that whole when, in fact, no justification is provided for that conclusion. For
example, during a battle with an ethnic militia, a single detainee was captured. This detainee was
suffering from malnutrition and low morale. It was noted that the detainee was equipped with a
semiautomatic weapon of World War II vintage. After a brief interrogation, the intelligence
analyst reported the enemy militia recently engaged was starving, diseased, and poorly armed.
The intelligence analyst failed to consider that—
The detainee may have been captured because he was too sick to keep up with the rest of the
unit.
The weapon of early vintage did not necessarily make it ineffective.
2-10
ATP 2-33.4
18 August 2014
Analytic Skills
Few captured detainees have high morale; in fact, low morale could just as easily result
from being captured as it could contribute to being captured.
z
Fallacy of division is committed when a person infers that what is true of a whole must also be
true of the parts of that whole. For example, members of the threat guard’s brigade had never
surrendered in previous combat. After a recent engagement, a detainee stated he was a member
of the guard brigade. The interrogator doubted the detainee’s statement because personnel from
that brigade never surrender.
z
Fallacy of post hoc ergo propter hoc (after this, therefore because of this) is consideration of
other factors that might have accounted for the same result that are omitted. Post hoc fallacies
often occur when trying to establish cause and effect. For example, an aircraft equipped with a
new jamming pod was not fired on while flying over threat-controlled territory. It was concluded
that, since the aircraft was not intercepted or fired upon, the jamming pod was extremely
effective in suppressing threat electronic systems. The conclusion may or may not account for
the aircraft not being attacked. Other considerations include—
The threat was obtaining electronic intelligence on this new pod.
The threat recently relocated several surface-to-air missile units and did not want to reveal
their new positions.
z
False dilemma (also known as black-and-white thinking) is a fallacy in which a person omits
consideration of more than two alternatives when in fact there are more than two alternatives.
For example, an intelligence staff officer (S-2) reports to the commanding officer that the enemy
has only the capability to either defend in place or retreat. The intelligence officer committed the
fallacy of false dilemma by failing to anticipate or ignoring that the enemy could—
Attack if they were willing to accept high casualties.
Withdraw to an alternate defensive position.
Conduct a delaying action.
z
Hasty generalizations are conclusions drawn from samples that are too few or from samples
that are not truly representative of the population. For example, after interrogating a detainee, the
interrogation officer reports the threat’s morale as extremely low and that surrender is imminent.
In this case, the interrogator is making a hasty generalization because the sample population
considered, one detainee, is too small.
z
Special pleading is a fallacy in which the writer creates a universal principle, then insists that
the principle does not for some reason apply to the issue at hand. For instance: “Everything must
have a source or creator that caused it to come into existence. Except God.” In such an assertion,
either God must have His own source or creator, or else the universal principle must be set aside
as the person making the argument cannot have it both ways logically.
Fallacies of Assumption
2-36. Fallacies of assumption implicitly or explicitly involve assumptions that may or may not be true.
Some fallacies of assumption include begging the question, stating hypotheses contrary to fact, and
misusing analogies.
z
Begging the question (also known as circular reasoning) is a fallacy in which the conclusion
occurs as one of the premises.
It is an attempt to support a statement by simply repeating the statement in different and
stronger terms. For example, Arab cultures want democracy. America is a democratic
nation. Arab cultures will accept American-style democracy.
When asked why the enemy was not pinned down by fire, the platoon leader replied: “Our
suppressive fire was inadequate.” The fallacy in this response is that by definition
suppressive fire pins down the enemy or is intended to pin him down. Since the platoon
failed to pin down the enemy, the inadequacy of this fire was self-evident.
z
Stating hypotheses contrary to fact occurs when someone states decisively what would have
happened had circumstances been different. Such fallacies involve assumptions that are either
faulty or simply cannot be proven. For example, the statement, “If we had not supported Castro
18 August 2014
ATP 2-33.4
2-11
Chapter 2
in his revolutionary days, Cuba would be democratic today” is contrary to fact. Besides being a
gross oversimplification, the assumption made in the statement cannot be verified.
z
Misusing analogies occurs when one generalizes indiscriminately from analogy to real world.
One method for weakening an analogous argument is by citing a counter-analogy. Analogies are
strong tools that can impart understanding in a complex issue. In the absence of other evidence,
intelligence analysts may reason from analogy. Such reasoning assumes that the characteristics
and circumstances of the object or event being looked at are similar to the object or event in the
analogy.
2-37. The strength of a conclusion drawn from similar situations is proportional to the degree of similarity
between the situations. The danger in reasoning from analogy is assuming that because objects, events, or
situations are alike in certain aspects, they are alike in all aspects. Conclusions drawn from analogies are
inappropriately used when they are accepted as evidence of proof. Situations may often be similar in certain
aspects, but not in others. A counter-analogy weakens the original analogy by citing other comparisons that
can be made on the same basis.
BIASES
2-38. A subjective viewpoint, bias indicates a preconceived notion about someone or something. Biases
generally have a detrimental impact on intelligence analysis because they obscure the true nature of the
information. Intelligence analysts must be able to recognize cultural, organizational, personal, and
cognitive biases and be aware of the potential influence they can have on judgment.
Cultural Bias
2-39. Americans see the world in a certain way. The inability to see things through the eyes of someone
from another country or culture is cultural bias. Biases interfere with the analyst’s ability to think the way
an enemy commander might think or to give policymakers informed advice on the likely reaction of foreign
governments to American policy. Also known as mirror imaging, cultural bias attributes someone else’s
intentions, actions, or reactions to the same kind of logic, cultural values, and thought processes as the
individual analyzing the situation. Although cultural bias is difficult to avoid, the following measures can
lessen its impact:
z
Locate individuals who understand the culture:
Include them in the analytical process.
Ask their opinion about likely responses to friendly actions.
Take care when using their opinions since they may be subject to biases regarding ethnic
groups or cultures in the region and their knowledge may be dated or inaccurate.
z
Locate regional experts, such as foreign and regional area officers, who have lived or traveled
through the area and are somewhat conversant regarding the culture. Assess the quality of the
information provided against the level of knowledge and experience the individual has for that
culture or region.
Organizational Bias
2-40. Most organizations have specific policy goals or preconceived ideas. Analyses conducted within
these organizations may not be as objective as the same type of analysis done outside the organization.
Groupthink and best case are organizational biases that can significantly skew internal analysis.
z
Groupthink. This bias occurs when a judgment is unconsciously altered because of exposure to
selective information and common viewpoints held among individuals. Involving people outside
the organization in the analysis can help identify and correct this bias.
z
Best Case. This bias occurs when an analyst presents good news or bad news in the most
optimistic light. The judgment is deliberately altered to provide only the information the
commander wants to hear. Analysts can avoid this bias by having the moral courage to tell the
commander the whole story, good and bad.
2-12
ATP 2-33.4
18 August 2014
Analytic Skills
A Useful Tool in Logic: Occam's Razor
The term "Occam's Razor" comes from a misspelling of the name William of
Ockham. Ockham was a brilliant theologian, philosopher, and logician in the
medieval period. One of his rules of thumb has become a standard guideline for
thinking through issues logically. Occam's Razor is the principle that, if two
competing theories explain a single phenomenon, and they both generally reach the
same conclusion, and they are both equally persuasive and convincing, and they
both explain the problem or situation satisfactorily, the logician should always pick the
less complex one. The one with the fewer number of moving parts, so to speak, is
most likely to be correct. The idea is always to cut out extra unnecessary bits, hence
the name "razor." An example will help illustrate this.
Suppose you come home and discover that your dog has escaped from the kennel
and chewed large chunks out of the couch. Two possible theories occur to you:
• Theory one is that you forgot to latch the kennel door, and the dog pressed
against it and opened it, and then the dog was free to run around the inside of the
house. This explanation requires two entities (you and the dog) and two actions
(you forgetting to lock the kennel door and the dog pressing against the door).
• Theory two is that some unknown person skilled at picking locks managed to
disable the front door, then came inside the house, set the dog free from the
kennel, then snuck out again covering up any sign of his presence and then
relocked the door, leaving the dog free inside to run amok in the house. This
theory requires three entities (you, the dog, and the lock-picking intruder) and
several actions (picking the lock, entering the house, releasing the dog, hiding the
evidence, relocking the door). It also requires us to come up with a plausible
motivation for the intruder—a motivation that is absent at this point.
Either theory would be an adequate and plausible explanation. Both explain the
same phenomenon (the escaped dog) and both employ the same theory of how, for
example, that the latch was opened somehow, as opposed to some farfetched
theory.
Which theory is most likely correct? If you do not find evidence like strange
fingerprints or human footprints or missing possessions to support theory two,
William of Ockham would say that the simpler solution (theory one) is most likely to
be correct in this case. The first solution only involves two parts—two entities and two
actions.
On the other hand, the second theory requires at least five parts—you, the dog, a
hypothetical unknown intruder, some plausible motivation, and various actions. It is
needlessly complex. Occam's basic rule was: “Thou shalt not multiply extra entities
unnecessarily,” or to phrase it in modern terms:
“Don't speculate about extra
hypothetical components if you can find an explanation that is equally plausible
without them.” All things being equal, the simpler theory is more likely to be correct.
18 August 2014
ATP 2-33.4
2-13
Chapter 2
Personal Bias
2-41. Personal bias is the tendency to base assessments on personal beliefs. This can cause the rejection of
valid arguments that conflict with these beliefs. A racially or religiously prejudiced person may reject
arguments because of the source. A person with strong political views may discount every argument from
another political group.
2-42. There are several types of personal bias. Three common biases exhibited by analysts are—
z
Confirmation Bias. This bias causes analysts to undervalue or ignore evidence contradicting an
early judgment and value evidence that tends to confirm already held assessments.
z
Assimilation Bias. This bias involves the modification and elaboration of new information to fit
prior conceptions of hypotheses. The bias is toward confirming a preconceived answer.
z
Anchoring Bias. This bias involves the use, often unwitting, of arbitrary values in
decisionmaking, including the use of conclusions developed by others.
Cognitive Bias
2-43. The intelligence analyst evaluates information from a variety of sources. The degree of reliability,
completeness, and consistency varies from source to source and even from report to report. This variance
often creates doubt about the reliability of some sources. Cognitive biases that affect the analyst are
discussed below:
z
Vividness. Clear and concise or vivid information has a greater impact on analytical thinking
than abstract and vague information. A clear piece of information is held in higher regard than a
vague piece of information that may be more accurate. Analysts must consider that an enemy
may use deception to portray vivid facts, situations, and capabilities that they want the friendly
intelligence effort to believe.
z
Absence of evidence. Lack of information is the analyst’s most common problem, especially in
the tactical environment. Analysts must do their best with limited information and avoid holding
back intelligence because it is inconclusive. To avoid this bias, the analyst should—
Realize that information will be missing.
Identify areas where information is lacking and consider alternative conclusions.
Adapt or adjust judgments as more information becomes available.
Consider whether a lack of information is normal in those areas or whether the absence of
information itself is an indicator.
z
Oversensitivity to consistency. Consistent evidence is a major factor for confidence in the
analyst’s judgment. Information may be consistent because it is appropriate, or it may be consistent
because it is redundant, is from a small or biased sample, or is the result of the enemy’s deception
efforts. When making judgments based on consistent evidence, the analyst must—
Be receptive to information that comes in from other sources regardless of whether it
supports the hypothesis or not.
Be alert for circular reporting, which is intelligence already obtained by the unit that is then
reformatted by other units and intelligence organizations, modified slightly, and
disseminated back to the unit. This is a common problem; particularly in digital units, where
large volumes of information is being processed. It helps to know, to the degree possible,
the original source for all intelligence to ensure that a circular report is not used as evidence
to confirm an intelligence estimate or conclusion.
z
Persistence on impressions. When evidence is received, there is a tendency to think of
connections that explain the evidence. Impressions are based on these connections. Although the
evidence eventually may be discredited, the connection remains and so do the impressions.
z
Dependency on memory. The ability to recall past events influences judgment concerning
future events. Since memory is more readily available, it is easy to rely on memory instead of
seeking new information to support analysis.
z
Acceptance of new intelligence. Often new intelligence is viewed subjectively; either valued as
having more value or less value than current intelligence.
2-14
ATP 2-33.4
18 August 2014
PART TWO
Fundamental Task Techniques
Chapter 3
Basic Structured Analytic Techniques
This chapter describes the basic structured analytical techniques necessary to support
problem solving. These techniques include sorting, matrices, threat intentions matrix,
event mapping, event trees, subjective probability, and weighted ranking.
OVERVIEW
3-1. A technique is a way of doing something by using special knowledge or skill. An analytic technique
is a way of looking at a problem, resulting in a conclusion, an assessment, or both. A technique differs from
a tool in that a tool is used as part of the specific analytic technique, but does not provide the conclusions or
assessments in and of itself. For example, a link diagram is a tool used to facilitate greater understanding of
the relationships between the entities. The diagram is not finished analysis; it helps the analyst break down
information into subsets until a hypothesis is found to be either sensible or untrue.
3-2. Structuring one’s analysis is the separating of elements of a problem in an organized manner and
reviewing the information in a systematic and efficient way. The structure is the plan, and the analysis is
the execution of the plan.
3-3. Basic structured analytic techniques are just that; they are the simplest analytic techniques. Basic
structured analytic techniques are the building blocks upon which further analysis is done. They serve as
the baseline for using the core Army analytic techniques described in chapter 5.
3-4. The more important the problem or issue, the more important structured analytic techniques become
in the development of the best judgment of the response. Structured analytic techniques help the mind
remain open and thereby mitigate that inhibit the analyst’s ability to consider alternatives and judge them
fairly.
3-5. Structured analytic techniques—
z
Help analysts make sense of complex problems.
z
Let analysts compare and weigh pieces of information against each other.
z
Ensure analysts focus on the issue under study.
z
Force analysts to consider one element at a time in a systematic manner.
z
Aid analysts in overcoming their logic fallacies and biases.
z
Ensure analysts see the elements of information that in turn enhance the identification of
correlations and patterns that would not appear if not depicted outside the mind.
z
Enhance the analyst’s data gathering and review, which in turn facilitate effective thinking with
a better base to derive alternatives and solutions.
18 August 2014
ATP 2-33.4
3-1
Chapter 3
3-6. Basic structured analytic techniques are the starting point for most analysis and are unlikely to
provide an answer to intelligence challenges on their own. However, they will provide insight that will
support problem solving. The techniques will improve assessments by making them more rigorous,
improve the presentation of the finished intelligence in a persuasive manner, and provide ways to measure
progress as well as identify what might be missing.
3-7. The following are basic structured analytic techniques:
z
Sorting.
z
Matrices.
z
Threat intentions matrix.
z
Event mapping.
z
Event trees.
z
Subjective probability.
z
Weighted ranking.
SORTING
3-8. Sorting is a basic structuring technique for grouping information to develop insight to facilitate analysis.
FACTS
3-9. Sorting is effective when information elements can be broken out into categories or subcategories for
comparison using an automated computer program, such as a spreadsheet. This technique is most useful for
reviewing massive data stores that pertain to an intelligence challenge. Sorting also aids in the review of
multiple categories of information that when broken down into components can present possible trends,
similarities, differences, or other insights not readily identifiable. Sorting can be used at any stage and is
particularly effective during initial data gathering and hypothesis generation.
3-10. Sorting massive amounts of data can provide insights into trends or abnormalities that warrant further
analysis and that otherwise would go unnoticed. This technique can highlight new or additional analytic
insights within an old intelligence problem or a new one. Sorting data before you begin analyzing
transactions, such as communications intelligence or transfers of goods, is very helpful.
3-11. Improper sorting can hide valuable insights as easily as illuminating them. Standardizing the data
being sorted is imperative. Working with an analyst with experience in sorting can avoid this pitfall in most
cases. The following are examples of sorting.
Sorting Examples
Example 1:
Are local tribal leaders pro-U.S., anti-U.S., or neutral on their attitudes towards U.S.
policy in the Middle East? Sort the leaders by factors determined to give insight into
the issue, such as birthplace, ethnicity, religion and religious sect, level of
professional education, foreign military or civilian or university exchange training
(where or when), political influences in life, political decisions made, have U.S. forces
negatively or positively affected their tribe. Then review the information to see if any
parallels exist between the categories.
Example 2:
Data from cell phone communications among five conspirators is reviewed to
determine the frequency of calls, the patterns in calls to discover the key
communicator, any pattern in the change in frequency of calls prior to a planned
activity, and dates and times of calls.
3-2
ATP 2-33.4
18 August 2014
Basic Structured Analytic Techniques
THE METHOD
3-12. The following are steps for this technique:
z
Step 1. Review the categories the information is broken down into to determine which
categories or combination of categories might show the trends or an abnormality that would
provide insight into the problem being studied. Place data into a spreadsheet, database, or wheel
using as many fields (columns) as necessary to differentiate among the data types (such as dates,
times, locations, people, activities, amounts). List each of the facts, pieces of information, or
hypotheses involved in the problem that you may want to use in the sorting schema (can use
paper, white board, movable piece of stationery with a re-adherable strip of adhesive on the
back, or other means).
z
Step 2. Review the listed facts, information, or hypotheses in the database or spreadsheet to
identify key fields that may help uncover possible patterns or groupings. Those patterns or
groupings then illustrate the schema categories and can be listed as header categories. For
example, if you are examining terrorist activity and notice that most attacks occur in hotels and
restaurants but the times of the attacks vary, “location” is the main category; while date and time
are secondary categories.
z
Step 3. Group those items according to the schema in the categories you previously defined in
step 1.
z
Step 4. Chose a category and sort the data within that category. Look for any insights, trends, or
oddities.
z
Step 5. Review (and re-review) the sorted facts, information, or hypotheses to see if there are
alternative ways to sort them. List any alternative sorting schema for the problem. One of the
most useful applications of this technique is to sort according to multiple schemas and examine
results for correlations between data and categories. (For example, you notice that most terrorist
attacks that happen in hotels also happen in June.)
3-13. The following can assist when using the sorting technique:
z
Get others to review the sorted information to increase the brainstorming opportunities and for
new ways of sorting the data to gain insight.
z
Remember that correlation is not the same as causation.
z
Return to sorting anytime during the analysis when new insights are gained and sorting can
either support or negate conclusions.
MATRICES
3-14. A matrix is a grid with as many cells as required to sort data and gain insight. Matrices are useful
whenever there are more options or more intricate data than can be conceptualized at one time without a
visual representation. Whenever information can be reduced to a matrix, it provides analytic insights.
FACTS
3-15. Matrices are exceptionally useful in isolating critical data when there is an abundant amount of
overall information relevant to an issue. When used to review data related to options, such as the analysis
of competing hypotheses, it enables analytic focus on each option, improving comparison. Matrices allow
elements of a problem to be separated and categorized by type, for comparison of different types of
information or of pieces of the same type of information. Matrices also help analysts identify patterns or
correlations within the information, such as through telephone calls between members of a group, which is
an intermediate step in link analysis.
3-16. The two-dimensional design of matrices limits their use for collating data on complex issues.
Leaving out pertinent data easily oversimplifies an issue. Figure 3-1 on page 3-4 matrix shows one method
of cross-walking the operational variables memory aid PMESII (political, military, economic, social,
information, and infrastructure) with the civil considerations memory aid ASCOPE (area, structures,
capabilities, organizations, people, and events.)
18 August 2014
ATP 2-33.4
3-3

Chapter 3
Figure 3-1. Matrix example
THE METHOD
3-17. Matrices can be rectangular, square, or triangular depending on the purpose and number of rows and
columns required to enter the data. The following are steps for this technique:
z
Step 1. Draw a matrix with sufficient columns and rows to enter the two sets of data to be
compared.
z
Step 2. Enter the range of data or criteria along the horizontal and vertical axis.
z
Step 3. In the grid squares in between, note the relationships or lack thereof in the cell at the
intersection between the two associated data points.
z
Step 4. Review the hypotheses developed for the issue in light of the relationships shown in the
matrix and, if appropriate, develop new hypotheses based on the insight gained from the matrix.
3-18. The following can assist when using this technique:
z
Develop a template for recurring topics where the data points remain consistent.
z
Color-code results to aid in understanding the results.
3-4
ATP 2-33.4
18 August 2014

Basic Structured Analytic Techniques
THREAT INTENTIONS MATRIX
3-19. The threat intentions matrix is a technique used to efficiently look at information from the threat’s
point of view. It is necessary for the analyst using the technique to have knowledge of the motivation,
goals, and objectives of the threat making the decision and to assess the criteria in the matrix from the
threat’s point of view.
FACTS
3-20. When completed, the threat intentions matrix will help mitigate bias while providing insight into the
effect of each of the threat’s different decisionmaking criteria on their different options. The matrix gives
the analyst the ability to develop clear indicators for each option under study, permitting specific collection
planning.
3-21. With the threat’s decisionmaking criteria already established in the column headings, the analyst only
has to enter the alternatives or options being considered. Normally the matrix can be completed in less than
an hour. During the input of information into the matrix, new and potentially better options become
apparent, increasing the value of the technique.
3-22. The criteria used in the matrix are not as extensive as and quite possibly less relevant than criteria
derived during use of the weighted ranking technique. As a result, the insight gained may be less than that
gained using other techniques. Figure 3-2 depicts a threat intention matrix.
Figure 3-2. Threat intention matrix
THE METHOD
3-23. Use the column headings entered on the threat intent matrix. It is important to enter the information
for every decisionmaking criteria in a column before moving to the next column. That is the manner by
which this technique mitigates bias. The following are steps for this technique:
z
Step 1. Enter the decision options believed to be reasonable from the threat’s viewpoint.
z
Step 2. Fill in the objectives for each option from the threat’s viewpoint in the objectives column.
z
Step 3. Fill in the benefits column from the threat’s viewpoint with the benefits of the threat’s
decision option.
z
Step 4. Fill in the risk column from the threat’s viewpoint with the risks of the threat’s decision
option.
z
Step 5. Fill in the implications column, which transitions the analyst from the threat’s point of
view to the analyst’s point of view. Enter the implications from the threat’s point of view and
then add a slash (/) and enter the implications from the analyst’s point of view.
z
Step 6. Enter the indicators from the analyst’s viewpoint into the indications column. This
provides a basis for generating collection to determine which option was selected by the threat as
early as possible.
18 August 2014
ATP 2-33.4
3-5
Chapter 3
3-24. The following can assist when using an threat intentions matrix:
z
Use the weighted ranking technique for more detailed insight if time allows.
z
Color-code your entries using red for those from the adversarial point of view and blue for those
from the analyst’s point of view.
EVENT MAPPING
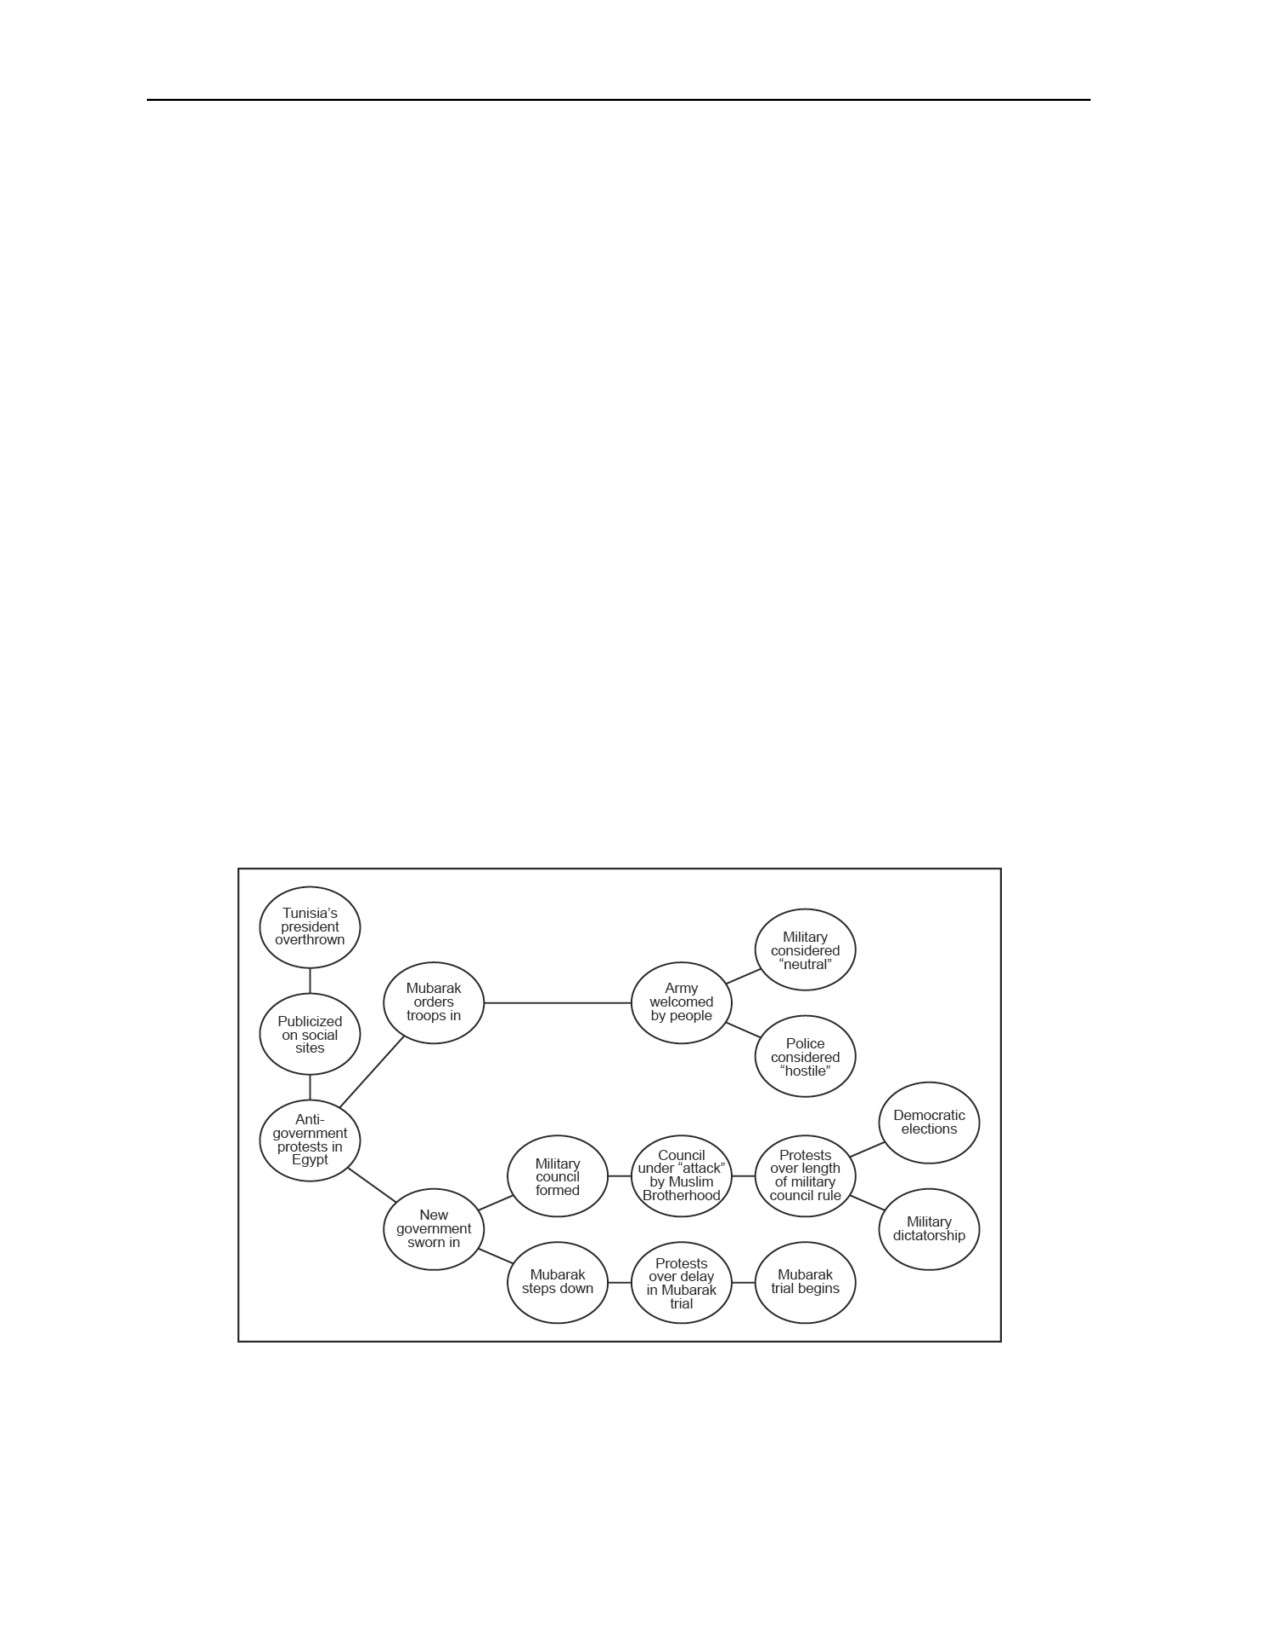
3-25. Event mapping uses a brainstorming diagram to represent the scenarios in hypotheses linked around
a central word or short phrase representing the issue or problem to be analyzed.
3-26. Use this technique when a nonlinear method is desired to generate, visualize, structure, and delineate
the events in a scenario or hypotheses related to the intelligence issue or problem. The addition of colors
can represent key players in each scenario, such as economics, military, opposition group, science, and
culture, as well as internal and external political pressures. It is also easy to annotate indicators of change to
use in the formation of collection plans.
FACTS
3-27. The diagram with connections between events in a scenario on a radial diagram encourages a
brainstorming approach to the event mapping. The large amount of association in event maps promotes
creativity in generating new ideas and associations not previously considered. The elements are arranged
intuitively according to the importance of the concepts and are organized into groups, branches, or areas.
The uniform graphic formulation of the semantic structure of information on the method of gathering
knowledge may aid recall of existing memories. An analyst can mitigate some bias as scenario event
hypotheses are mapped in radials around the issue or problem without the implied prioritization that comes
from hierarchy or sequential arrangements, anchoring, and other cognitive bias.
3-28. Unconstrained event mapping can become overly detailed, lose focus, and include events and
scenarios that lack relevance to the issue or problem being studied. Figure 3-3 shows a simple example of
event mapping.
Figure 3-3. Example of event mapping
3-6
ATP 2-33.4
18 August 2014
Basic Structured Analytic Techniques
THE METHOD
3-29. The general rules of event mapping are—
z
Start with a blank paper or use a piece of stationery with a re-adherable strip of adhesive on the
back to make notes on a white board.
z
Thinks in terms of key words, phrases, or symbols that represent ideas and words.
z
Put down ideas as they occur, wherever they fit.
z
Do not judge or hold back.
z
Develop in directions the topics take you—not limited by how you are doing the map.
z
As you expand the map, try to become more detailed.
z
Use arrows or other visual aids to show the links between events in the scenario.
3-30. The following are steps for this technique:
z
Step 1. Put the word or symbol representing the issue or problem to be analyzed in the center of
the paper or white board. Take a minute to think about it before continuing.
z
Step 2. Add symbols or words to represent possible actions and outcomes around the central
issue or problem.
z
Step 3. Link the possible actions and outcomes to the central issue or problem. If desired, use
colors to indicate the major influence the link represents. For example, use green for economic
links, red for opposition groups, or purple for military forces. Colors may also be used to
differentiate paths for ease of reference.
z
Step 4. Continue working outward, building the scenario of events into branches and sub-
branches for each hypothesis in greater detail.
z
Step 5. Use emphasis such as underlining and stars to show importance or level of influence.
z
Step 6. Do not allow yourself or the group to get stuck on one scenario. If ideas end, move to
another area or another hypothesis.
z
Step 7. When the creativity wanes, stop and take a break. After an hour or so, return and review
the map, and make additions and changes as desired.
z
Step 8. As an option, add a number on links or decision points in each hypothesis and, on a
separate piece of paper, write down the evidence for each number to be collected that would
disprove that link or decision being made. Use the lists for each number to develop an integrated
collection strategy for the issue or problem.
3-31. The following can assist when using an event map:
z
Think fast. Your brain works best in 5 to 7 minute bursts, so capture that explosion of ideas as
rapidly as possible.
z
Keep moving. If ideas slow down, draw empty lines, and watch your brain automatically find
ideas to put on them. Stand up and use an easel pad or white board to generate even more
energy.
z
Include distractions. If you are mapping and you suddenly remember you need to pick up your
cleaning, put down “cleaning” on the side of the map. Otherwise you will become fixated on the
cleaning chore.
z
Write on links. Put key words on lines to give context to the link.
z
Print words. Print rather than write in script. It is easier to read and remember. Lowercase is
more visually distinctive (and easier to remember) than uppercase.
EVENT TREES
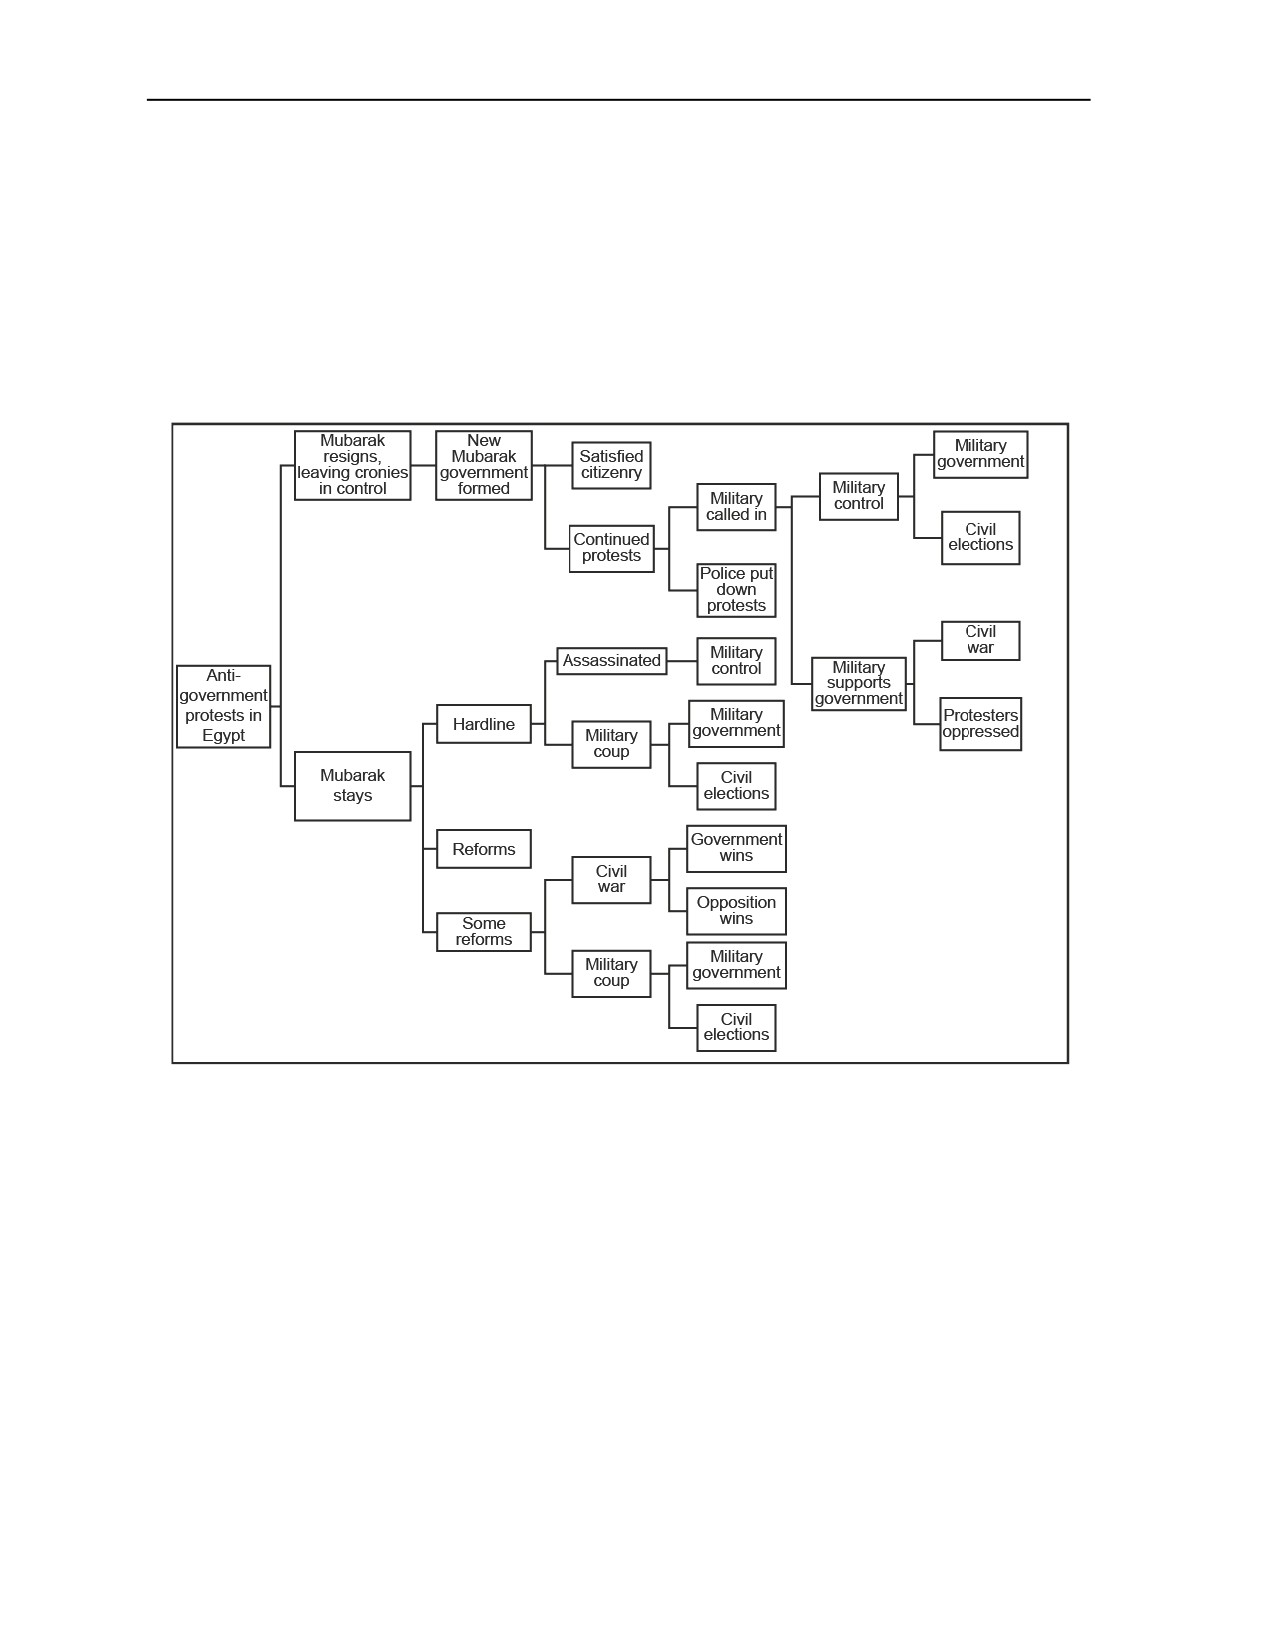
3-32. An event tree is a graphic depiction of a possible sequence of events, including potential junctures
within the events sequence.
18 August 2014
ATP 2-33.4
3-7
Chapter 3
FACTS
3-33. Use an event tree to clarify alternative event sequences with potential future or at least unknown
outcomes related to an intelligence problem. Event trees work best when there are multiple, mutually
exclusive options that cover the spectrum of reasonable alternatives available.
3-34. An event tree is a visual tool by which analysts can depict a threat’s options with decision points that
gives insight into potential vulnerabilities. It clarifies the presumed sequence of events or decisions
between an initiating event and a final outcome. Event trees also provide an excellent method of
determining collection requirements for the indications that a decision has been made or events have
unfolded in one of the alternative limbs of the tree. Figure 3-4 is an example of an event tree.
Figure 3-4. Event tree example
THE METHOD
3-35. The following are steps for this technique:
z
Step 1. Identify the mutually exclusive and complete set of possibilities that pertain to a given
intelligence issue.
z
Step 2. Decide which events, factors, or decisions (for example, variables) will have the greatest
influence on the alternatives or possibilities identified in step 1.
z
Step 3. Decide on the sequencing in which these factors are expected to occur or impact one
another.
z
Step 4. Determine the event options within each alternative and establish clear definitions for
each event option to ensure collection strategies to monitor events are effective.
z
Step 5. Construct the event tree from left to right. Each alternative is a separate main branch.
Start with the first alternative and have one branch from this node for each realistic path the first
event can take. For instance, the purchased equipment could be used for its intended purpose, or
it could be reverse-engineered for duplication, or it could be disassembled and sold for scrap.
3-8
ATP 2-33.4
18 August 2014

Basic Structured Analytic Techniques
Proceed down each event option node until the end state for that sub-branch is reached. Then
move to the next alternative and repeat the process.
z
Step 6. Determine what would indicate a decision has been made at each decision point for each
option to use in generating an integrated collection plan.
z
Step 7. Assess the implications or after effects of each alternative on the intelligence problem.
3-36. The following can assist when using an event tree:
z
Use this technique in conjunction with weighted ranking, hypothesis review techniques, and
subjective probability to gain added insights.
z
Leverage the expertise of a group of analysts during the construction of an event tree to ensure
all important events, factors, and decision options are considered.
SUBJECTIVE PROBABILITY
3-37. Subjective probability is a quantitative expression of an analyst’s degree of belief in the truth of a
statement relative to all other alternative possibilities. It may be text or graphic. Figure 3-5 shows an
example of subjective probability using an event tree.
Figure 3-5. Subjective probability example
FACTS
3-38. Subjective probabilities are used to quantitatively express an analyst’s overall degree of belief in the
truth of a statement where the total belief held by an analyst is allocated among the other possibilities in
proportion to how likely each answer or event is correct. Subjective probability analysis is useful in
comparing the perceived likelihood of hypotheses, supporting event tree or matrix analysis by providing
quantitative estimates for each event, and quantitatively evaluating the value of additional information in
shaping the conclusions of an analysis.
18 August 2014
ATP 2-33.4
3-9
Chapter 3
3-39. The expression of numerical probabilities can mitigate the imprecision of probability phrases (“very
likely” or “improbable”). Moreover, numerical probabilities mitigate the potential for analysts to exploit
imprecision in favor of their position. Using numerical probabilities ensures mathematical rules are
followed and forces consideration of a complete set of alternatives. This in turn gives the analyst a rational
basis to judge whether the probability distribution is an accurate reflection of the analyst’s beliefs.
3-40. Assignments of probability require a complete set of non-overlapping (mutually exclusive) answers,
events, scenarios, or COAs. In addition, misuse can feed availability and anchoring biases.
3-41. When using subjective probability, it is essential in defining a numerical score and range to ensure all
personnel involved understand the meaning of the terms. Table 3-1 shows an example of subjective
probability and the language associated with each score or range.
Table 3-1. Subjective probability table
Subjective Probability Table
Term
Score
Range (percent)
Highly probable
10
91 to 100
Probable
9
81 to 90
Highly likely
8
71 to 80
Likely
7
61 to 70
Possible
5 to 6
41 to 60
Unlikely
4
31 to 40
Highly unlikely
3
21 to 30
Improbable
2
11 to 20
Highly improbable
1
1 to 10
3-42. While subjective probability looks similar to event mapping, the differences are with subjective
probability you are not determining a timeline for any particular events; you are simply attempting to
predict an outcome and applying a percentage of probability to each outcome.
THE METHOD
3-43. Subjective probability rules must be followed:
z
The probability assigned to a given hypothesis must be within the range of 0.0 (or 0 percent) to
1.0 (100 percent). A probability of 0.0 means the hypothesis is certainly wrong; whereas a
probability of 1.0 means that the hypothesis is certainly correct.
z
The total probability distributed among all hypotheses is a complete, non-overlapping set must
add to 1.0 (100 percent).
3-44. The following are steps for this technique:
z
Step 1. Identify a complete set of high-level, non-overlapping hypotheses that seek to answer a
clearly defined question. Use the technique of defining the issue to ensure that the question is
clear.
z
Step 2. Generate simple chains of events or facts for each hypothesis. Event trees and event
mapping are two techniques that aid in this step. The number of scenarios that can be
constructed for a given hypothesis depends on the detail desired. Each scenario describes one
instance of how the associated hypothesis may come to pass.
z
Step 3. The probability of a given hypothesis is a function of the probabilities of all the
scenarios that would support a hypothesis as being true. The probability of a given scenario is a
function of all the events within that scenario occurring. That is, the probabilities (percentages)
for each option are multiplied throughout the scenario to determine the probability for the
scenario. There are two types of probability events that need to be analyzed:
3-10
ATP 2-33.4
18 August 2014
Basic Structured Analytic Techniques
Mutually Exclusive. The occurrence of one event precludes the occurrence of the others.
Either one or another will occur, but not both. For example, for an elections result if one
individual wins, another necessarily cannot. The total probability for the total events must
equal 100 percent.
Conditionally Dependent. Events are those for which the probability of occurrence of one
event depends on whether or not another has occurred. These are the events within a
scenario where the probability for each event in the scenario is multiplied to determine the
probability of the end result.
3-45. The following can assist when using subjective probability:
z
Draw a circle and allocate slices of the circle or “pie” where the relative size of the slice of pie
for a hypothesis represents how likely the analyst believes it is true.
z
Assign numbers to each hypothesis according how strongly it is believed. Determine the
subjective probability by dividing the points for each hypothesis by the total of the numbers
assigned to all hypotheses.
z
Determine the amount of money you would be willing to bet on a hypothesis being true given
that you were to win $1,000,000 if true; the subjective probability in this case would be the ratio
of your wager to the total pot (for example, $1,000/$1,000,000 = 0.001 or 0.1 percent).
WEIGHTED RANKING
3-46. Weighted ranking is a technique used by an individual or group to gain confidence in the assessment
of available alternatives by weighting criteria in importance from the decisionmaker’s point of view.
3-47. Weighted ranking should be used anytime the topic is important enough to warrant the investment of
time and there is a need for transparency in the reasoning used to derive the assessment. In intelligence
analysis, each criterion used in the technique must be selected and given a weighted importance from both
the technique and the threat decisionmaker’s point of view. The insight gained on how each criterion will
affect the final outcome allows for a clear, persuasive presentation and argumentation of the assessment.
FACTS
3-48. Weighted ranking helps mitigate bias and mindset when the analyst using it faithfully follows the
method and treats each step as equally important to the outcome. The technique can be used by a group
working together as long as a group facilitator keeps the process on track. The validity of the weighting of
the criteria can be enhanced by the group through discussions sharing insight into the threat
decisionmaker’s purpose and point of view.
3-49. Weighted ranking adds validity to an assessment of alternatives, options, and hypotheses by
mitigating bias and mindset in comparison to an analyst’s intuition. Weighted ranking takes more time than
other basic analytic techniques. Many analysts avoid this technique because it relies on mathematical
computations.
THE METHOD
3-50. There are eight steps to accomplish a weighted ranking review of alternative options being assessed.
Figure 3-6 on page 3-13 is a condensed view of weighted ranking options.
z
Step 1. Take the alternatives, options, or hypothesis generated or another process to fill in the
first column of a matrix under the column heading of Options.
z
Step 2. On a separate sheet of paper or file, develop a comprehensive list of independent criteria
the threat would likely use to determine which option to select. List the criteria in a column with
one criterion per line. The context of the time, place, and objectives of the action being reviewed
should be considered in the development of the criteria.
z
Step 3. Pair-rank the criteria. Pair-ranking requires each item being ranked to be compared with
every other item and the selection of one over the other.
18 August 2014
ATP 2-33.4
3-11
Chapter 3
Start with the first criterion in the list and compare it to the second criterion. Place a mark
( or ) next to the criterion selected as the more important between the two.
Compare the first criterion with the third. Again mark the more important of the two. Once
the first criterion has been ranked against all of the others, go to the second criterion and
compare it with the third, placing a mark next to the one judged most important.
Rank the second criterion with the fourth, and so on until it has been ranked against the
remaining criteria on the list. The second and succeeding criteria are not ranked against
criteria on the list shown above them because that was accomplished when those criteria
were going through the process.
Count the marks or votes for each criterion on the list and write the total to the right of the
criterion and marks.
Review the totals of each criterion and determine how many of the listed criteria to use in
the weighted ranking matrix. Mark these criteria with an asterisk. Note that more than five
or six criteria rarely provide sufficient difference to be worth the time and expertise.
Continue to rank each criterion with those below it on the list until the list is completed.
z
Step 4. Divide the number of votes received by each selected criterion by the total number of
votes for all selected criteria. (For example, if the total number of votes for the selected criteria
is 15 and the first criterion received 5 votes, divide 5 by 15 to get 33 percent; and the second
criterion received 4 votes, then divide 4 by 15 to get 27 percent [rounded up 26.7 percent to the
next full number], and so on, through the selected criteria. Make sure the total of the percent for
the criteria adds up to exactly 100 percent by rounding off the figures as required.)
z
Step 5. Enter the criteria in the options matrix as column headings starting with the second
column. Note that the first column heading is Options. Include the percentage for each criterion
with it in the column heading. The order that the criteria are entered is not important, but
confusion can be avoided if the criterion with the largest percentage is entered in the first column
and the remainder added in descending order.
z
Step 6. Pair-rank the options based on the first criteria from the point of view of the threat
decisionmaker. The pair-ranking is accomplished exactly like the procedure used in step 4 to
rank the criteria.
Compare the first option with the second option and determine which option most meets the
criteria.
Then place a mark (l or X) in the box at the intersection for best option for the criteria.
After pair-ranking all the options for the first criterion, move to the second criterion
(column) and pair-rank all of the options against that criterion, and so on, until all criteria
are used to pair-rank the options.
z
Step 7. Count the number of marks (votes) in each square in the matrix under the criteria and
write the number in the square. Then multiple the number by the weight of the criteria (the
percentage listed with the criterion at the top of the column). Write the product (result of the
multiplication) in the square as well.
z
Step 8. Once all squares with marks have been multiplied by the percentage for that criterion
and placed in the appropriate square, add the product (result of the multiplication) in each square
for each option (row). That is, add all of the final numbers in each square across the row and
place the total in the final column for that option (row). This number can be larger than 1 (for
example, 2.58). The row with the largest total is the most likely option.
3-51. End the weighted ranking review by performing a sanity check of the results and review the impact
of the weighted criteria on the final result. This review should provide the insight needed to present the
results in a clear and persuasive manner to customers.
3-52. The following can assist when using weighted ranking:
z
Use a different color for each criteria and alternative during the pair-ranking to make the choices
transparent (easy to review or recreate).
z
At a minimum, it will provide insight to the analyst on the interaction of the criteria from the
point of view of the threat decisionmaker.
3-12
ATP 2-33.4
18 August 2014

Basic Structured Analytic Techniques
Figure 3-6. Weighted ranking example
18 August 2014
ATP 2-33.4
3-13
This page intentionally left blank.
Chapter 4
Diagnostic Analytic Techniques
This chapter discusses the diagnostic analytic techniques routinely used by
intelligence analysts. It discusses in detail the common techniques of deception
detection, key assumptions check, quality of information check, indicators, and
conducting studies.
OVERVIEW
4-1. The primary purpose of diagnostic techniques is to make analytic arguments, assumptions, and/or
intelligence gaps more transparent.
4-2. The following techniques have been used at the strategic, operational, and tactical levels for some
time and are routinely used by intelligence personnel conducting intelligence analysis. The following are
the diagnostic analytic techniques discussed in this chapter:
z
Deception detection.
z
Key assumptions check.
z
Quality of information check.
z
Indicators.
4-3. Diagnostic techniques are often used in association with most other analytic techniques discussed in
this manual to further strengthen the analytic assessments and conclusions.
DECEPTION DETECTION
4-4. Deception is a threat action to influence the perceptions, decisions, or actions of another to the
advantage of the threat. Deception detection is a set of checklists that analysts can use to help them
determine when to look for deception, discover whether deception actually is present, and figure out what
to do to avoid deception.
4-5. Historically, intelligence analysis has been vulnerable to deception. In reality, analysts seldom check
for deception even when there is a well-known history of its use. Experienced analysts realize they cannot
assume all collected information is valid, but few know how to factor such concerns effectively into their
daily work practices. If an analyst accepts that some of the information may be deliberately deceptive, this
puts a significant cognitive burden on the analyst.
FACTS
4-6. Although deception detection is time consuming, analysts should be concerned about the use of
deception when the threat would have a lot to gain by denying or manipulating information collection
systems and analysts. Deception detection is an effective tool to assist in validating information collected as
well as other conclusions and assessments drawn using other techniques.
4-7. When trying to evaluate the information that is present to derive intentions or COAs, analysts have to
consider if this information is real or if it is a deception campaign to redirect the collection efforts or push
to other conclusions.
4-8. Attempting deception detection can strengthen analysis and reinforce effectiveness of other analytic
techniques. There may be times when analysts will place too much confidence in the effectiveness of other
techniques if they have not considered the possibility of deception.
18 August 2014
ATP 2-33.4
4-1
Chapter 4
THE METHOD
4-9. Analyst should routinely consider that their information base is susceptible to deception. The
possibility cannot be rejected simply because there is no evidence of deception; if done well, the analyst
should not expect to see any evidence upon first examination.
4-10. The analyst should assess key reporting based on four sets of criteria:
z
Does the threat have the motive, opportunity, and means?
Motive. (What are the threat’s goals?)
Channels. (What means are available?)
Risks. (What are the risks of discovery?)
Costs. (Can deception be accomplished?)
Feedback. (Can the threat monitor its use?)
z
Would this potential deception be consistent with past opposition practices?
Does the threat have a history of deception?
Does this deception fit past patterns?
If not, are there other historical precedents?
If not, are there changed circumstances that would explain this form of deception?
z
Do we have cause for concern regarding the susceptibility of manipulation of the threat?
Is the source reliable?
Does the source have access?
Is the source vulnerable to control or manipulation by the threat?
z
What can be learned from the evaluation of evidence?
How accurate is the source’s reporting?
Is the whole chain of evidence available?
Does critical evidence check out?
Does evidence from one source conflict with others?
Do other sources of information provide corroborating evidence?
Is the absence of evidence unusual?
4-11. Analyst have found the following rules helpful in dealing with deception:
z
Avoid over-reliance on a single source of information.
z
Seek and heed the opinions of those closest to the reporting.
z
Be suspicious of human sources or sub-sources who have not been met with personally or for
whom it is unclear how or from whom they obtained the information.
z
Be suspicious of information that appears to be too easy to collect and is too perfect of a picture.
z
Always look for material evidence (documents, reports, imagery) rather than relying exclusively
upon what someone says.
z
Look for a pattern where a source’s information has seemed correct and accurate initially, but
then proven to be false.
z
Generate and evaluate a full set of hypotheses at the outset of a task.
z
Know the limitations as well as the capabilities of collection assets, sources, and potential
deceivers.
4-12. In addition to using the deception detection technique, analysts can also employ the technique of
Analysis of Competing Hypotheses (ACH) discussed in appendix A. In this case, analysts would explicitly
pose deception as one of the multiple explanations for the presence or absence of information.
KEY ASSUMPTIONS CHECK
4-13. A key assumption is any hypothesis that analysts have accepted to be true and which forms the basis
of the assessment. For example, military analysis may focus exclusively on analyzing key technical and
4-2
ATP 2-33.4
18 August 2014
Diagnostic Analytic Techniques
military variables of military force and assume that these forces will be operated in a particular
environment (desert, open plains, arctic conditions).
FACTS
4-14. Postulating other conditions or assumptions, however, could dramatically impact the assessment.
Historically, U.S. analysis of Soviet-Warsaw Pact operations against the North Atlantic Treaty
Organization had to “assume” a level of non-Soviet-Warsaw Pact reliability (such as would these forces
actually fight).
z
In this case there was high uncertainty; depending on what level of reliability one assumed, the
analyst could arrive at very different conclusions about a potential Soviet offensive operation.
z
Or when economists assess the prospects for foreign economic reforms, they may consciously,
or not, assume a degree of political stability in those countries or the region that may or may not
exist in the future.
z
Likewise, political analysts reviewing a developing country’s domestic stability might
unconsciously assume stable oil prices, when this likely determinant of economic performance
and underlying social peace might fluctuate.
4-15. All of the above examples indicate that analysts often rely on stated and unstated assumptions to
conduct their analysis. The goal is not to undermine or abandon key assumptions; rather it is to make them
explicit and identify what information or developments would demand reconsidering them.
4-16. A key assumptions check is most useful at the beginning of an analytic project. Rechecking
assumptions also can be valuable at any time prior to finalizing judgments. Identifying hidden assumptions
can be difficult because they are ideas held by you to be true, albeit often subconsciously, and therefore are
seldom examined and almost never challenged.
4-17. Explicitly identifying working assumptions during an analytic project helps the analyst understand
the key factors shaping the issue and stimulates thinking. Additionally, this technique aids in explaining a
logical argument while exposing potentially flawed thinking. Key assumption checks should be
collaborative because one cannot effectively self-check.
THE METHOD
4-18. Checking for key assumptions requires analysts to consider how their analysis depends on the
validity of certain premises. The following four-step process will help analysts:
z
Review what the current analytic line of thinking on the issue appears to be. What do you think
you know? What key details aid in accepting that the assumption is true? Write it down for
analytic review.
z
Articulate all the premises, both stated and implied in finished intelligence, which are accepted
as true.
z
Challenge the assumption, asking why it must be true and is it valid under all conditions. What is
the degree of confidence in those initial answers?
z
Refine the list of key assumptions to contain only those that “must be true” in order to sustain
your analytic line. Consider under what conditions or in the face of what information these
assumptions might not hold true.
4-19. Ask the following questions during this process:
z
How much confidence exists that this assumption is correct?
z
What explains the degree of confidence in the assumption?
z
What circumstances or information might undermine this assumption?
z
Is a key assumption more likely a key uncertainty or key factor?
z
If the assumption proves to be wrong, would it significantly alter the analytic line and how?
18 August 2014
ATP 2-33.4
4-3
Chapter 4
QUALITY OF INFORMATION CHECK
4-20. The quality of information check technique evaluates the completeness and soundness of available
information, both independently and in conjunction with sources. If a major analytic assessment is planned,
analysts should individually or collectively review the quality of their information and refresh their
understanding of the strengths and weaknesses of past reporting on which an analytic line of thinking rests.
Without understanding the context and conditions under which critical information has been provided, it
will be difficult for analysts to assess the information’s validity and establish a confidence level in an
intelligence assessment.
4-21. Periodic reviews of the quality of the information should be conducted after the initial check to
prevent assumptions or weak judgments from becoming fact over time.
FACTS
4-22. Weighing the validity of sources is a key feature of any critical thinking. Moreover, establishing how
much confidence one puts in analytic judgments ultimately rests on how accurate and reliable the
information base is. Analysts essentially must judge the accuracy and reliability of the information. Thus,
checking the relative quality of information should be a continuous process.
4-23. Determining the quality of information independently of the source of the information is important to
ensure that neither unduly compromises nor supports the other. That is, an excellent source can knowingly
and admittedly pass third- or fourth-hand information that may be of low quality. It is important to keep the
two reviews separate. This check can—
z
Provide the most important basis of determining confidence of the assessment and judgments.
z
Provide an opportunity to mitigate assimilation or confirmation bias based on the source.
z
Provide an opportunity to catch errors of interpretation.
z
Identify intelligence gaps.
z
Help identify areas of concern of denial and deception.
z
Give the analyst an opportunity to clearly convey to the customers a better understanding of the
analyst’s confidence in the aspects of the problem.
4-24. Analysts can become susceptible to circular reporting and source-based bias when reviewing the
quality of information. Critical information can occasionally be found in reports from sources judged to
have low access or a poor record. To ignore the information on the basis of quality independent of the
source could cause the information to be unduly dismissed. Where one analyst works the same subject or
area for extended periods, the analyst may miss the significance of incremental changes. The use of
indicators can mitigate this possibility.
THE METHOD
4-25. For the information review to be fully effective, analysts will need as much backg1round information
on sources as is possible. Knowing the circumstances in which reporting was obtained is often critical to
understanding its validity. With this information the analysts should then, at a minimum—
z
Review all sources of information for accuracy; identify any of those sources more critical or
compelling.
z
Determine if they have sufficient and/or strong collaboration between the information sources.
z
Reexamine previously dismissed information in light of new facts or circumstances.
z
Ensure any circular reporting is identified and properly flagged for other analysts; analysis based
on circular reporting should also be reviewed to determine if the reporting was essential to the
judgments made.
z
Consider whether ambiguous information has been interpreted and qualified properly.
z
Indicate a level of confidence they can place in sources, which are likely to figure in future
analytic assessments.
4-4
ATP 2-33.4
18 August 2014
Diagnostic Analytic Techniques
4-26. Analysts should consciously avoid relating the source to the information until the quality of
information check is complete. If relating the source to the quality of the information changes the opinion
of the information, the analysts must ensure they can articulate why. Analysts should develop and employ a
spreadsheet to track the information and record their confidence in the quality of information as a constant
reminder of the findings.
INDICATORS
4-27. Identifying and monitoring indicators are fundamental tasks of intelligence analysis, as they are the
principal means of avoiding surprise. Indicators are often described as forward looking of predictive
indicators.
FACTS
4-28. Indicators are the basis for situation development. An indicator, in intelligence usage, is an item of
information which reflects the intention or capability of an adversary to adopt or reject a course of action
(JP 2-0). An indicator is positive or negative evidence of threat activity or any characteristic of the AO that
points toward threat vulnerabilities, the adoption or rejection by the threat of a particular activity, or that
may influence the commander’s selection of a COA. Indicators may result from previous actions or from
threat failure to take action. The all-source intelligence analyst integrates information from all sources to
confirm indications of threat activities. Detection and confirmation of indicators enable analysts to answer
priority intelligence requirements (PIRs).
4-29. If an indicator is a ploy (part of a deception plan), then conclusions based on it may be incorrect.
Although indicators are clues that point toward threat activities, capabilities, vulnerabilities, or intentions,
they may be deceptive and lead analysts to develop an incorrect intelligence estimate. Remember, an
estimate is not certain, but is an opinion based on facts and the analysis of a particular situation.
4-30. Analysts should avoid acting on a single indicator. Integration of multiple indicators and other
factors is essential before analysts can detect patterns and threat intentions. Other staff elements assist
intelligence analysts in developing indicators, which is instrumental in answering commander’s PIRs and
information requirements. Indicators serve as a means of prediction across all levels—strategic,
operational, and tactical. (See levels of war in ADRP 3-0.)
4-31. A threat may attempt to create false or misleading patterns of intentions by providing friendly forces
with false indicators. Analysts detect these false indicators, and then analyze them to determine what actual
COA the threat is attempting to initiate. Analysts discover deception by comparing indicators, intelligence,
and combat information from all sources to create an accurate picture of the AO. Because the use of
indicators is such an important part of determining threat COAs, it is imperative that analysts carefully
weigh all indicators.
4-32. Analysts should avoid making an assessment based on a single indicator. Integrating multiple
indicators, reviewing high-value targets and the most likely enemy COA, and considering the enemy center
of gravity will lead analysts to true threat intentions and capabilities.
4-33. Analysts—
z
Connect a series of occurrences or alarms to point to a higher indicator.
z
Use indicators to evaluate particular events or activities with probable threat COAs.
z
Use indicators to determine what events or activities will likely occur for a threat force to follow
a particular COA.
4-34. Analysts use the following steps to determine the mission-dependent indicators:
z
Develop indicators.
z
Weigh indicators.
z
Analyze indicators.
z
Use indicators.
18 August 2014
ATP 2-33.4
4-5
Chapter 4
Step 1: Develop Indicators
4-35. When developing indicators, intelligence analysts start from the event, work backwards, and include
as many indicators as possible. Analysts can remove some indicators later if decided that they are
unnecessary.
4-36. Each indicator must meet five criteria:
z
Be observable and collectible. There must be some reasonable expectation that, if present, the
indicator will be observed and reported by a reliable source. If an indicator is to monitor change
over time, it must be collectible over time.
z
Be valid. An indicator must be clearly relevant to the end state the analyst is trying to predict or
assess, and it must be inconsistent with all or at least some of the alternative explanations or
outcomes. It must accurately measure the concept or phenomenon at issue.
z
Be reliable. Data collection must be consistent when comparable methods are used. Those
observing and collecting data must observe the same things. Reliability requires precise
definition of indicators.
z
Be stable. An indicator must be useful over time to allow comparisons and to track events.
Ideally, the indicator should be observable early in the evolution of development so that the
analysts and decisionmakers have time to react accordingly.
z
Be unique. An indicator should measure only one thing and, in combination with other
indicators, point only to the phenomenon being studied. Valuable indicators are those that not
only are consistent with a specified scenario or hypothesis but also are inconsistent with all other
alternative scenarios.
4-37. Are the indicators mutually exclusive and comprehensive? Have a sufficient number of high-quality
indicators been generated for each scenario to enable an effective analysis? Can the indicators be used to
help detect a planned attack or deter a possible enemy COA?
4-38. Common knowledge and understanding of threat characteristics and the various operational
environments are essential to ensure all avenues are covered. This can be as simple as using threat
characteristic factors in a more conventional scenario. If presented with a PIR, indicator development may
include—
z
Threat characteristics—particularly composition, disposition, tactics, training, sustainment, and
combat effectiveness.
z
Electronic characteristics, which are the identification of threat digital and analog
communications links, systems, and associated units.
z
Personalities.
z
The location in the AO to expect a particular threat activity.
Note. In stability tasks or defense support of civil authorities (DSCA) missions, it might be more
applicable to use queries such as who, what, when, where, why, how, and in what strength. See
appendix A for indicator development.
Step 2: Weigh Indicators
4-39. Analysts weigh indicators to help resolve uncertainty. Intelligence analysts often encounter
conflicting indicators, resulting from—
z
Deliberate deception.
z
Poor mission execution.
z
Temporary indecision (hesitation in making a decision).
z
Transition between missions.
z
Random activity.
z
Incomplete or inaccurate information.
z
Uncertainty or doubt of the indicator itself.
4-6
ATP 2-33.4
18 August 2014
Diagnostic Analytic Techniques
4-40. When confronted with doubtful or conflicting indicators, analysts weigh some indicators more
heavily than others to determine the threat’s actual intent. This is not easily accomplished; it takes time and
experience to become proficient in associating indicators with COAs.
4-41. The assistant chief of staff, intelligence (G-2) staff develops a list of indicators and places a priority
on each. This prioritization establishes the relative weight of one indicator compared to another. Despite the
weight, or value placed on the indicators, it is dangerous to draw conclusions from a single indicator. The
analyst integrates each indicator with other indicators and factors and then defines patterns and establishes
threat intentions. The analyst may develop standing or specific indicators to answer the commander’s PIRs
and information requirements. The information collected and intelligence provided through the indications
and warning effort drive operational-level planning and long-term PIRs and information requirements. The
analyst uses these indicators to cross-reference specific events and activities with probable threat trends and
COAs.
4-42. The most obvious indicators are not necessarily the best depiction of a particular enemy COA. The
obvious indicators may actually serve as elements of a deception plan. The successful analysis of indicators
can assist in confirming or denying enemy COAs, and is therefore essential in supporting the commander.
However, it is important not to search for indicators of an expected COA or to expect a certain COA at all.
Leaders use indicators as a tip-off that something is occurring but demand that intelligence analysts dig
deeper into the why or what of the situation and develop an indicator list specific to the situation.
4-43. In combat, the analyst is usually confronted with conflicting indicators. An enemy force will go to
great efforts to deceive us by portraying indications which point to the adoption of a COA that the enemy
does not intend to adopt. Enemy forces may use patterns associated with attack, defense, and delay
simultaneously. These conflicting patterns may result from intentional deception, imprecise execution,
temporary indecision, random activity, or incomplete or inaccurate information.
4-44. The analyst requires a thorough knowledge of the threat and of the characteristics of the operational
environment that can affect military operations. Detailed knowledge of enemy organization, equipment,
tactical doctrine, and logistical methods is valuable. Also valuable is the probable enemy knowledge of the
area under friendly control and the personalities of the enemy commanders and the past performance of the
opposing enemy units. The analyst must develop a way to identify those indicators that are most indicative
of a COA. There are several techniques which may be used individually or in combination.
4-45. One technique of determining the enemy's intent is to consider the origin or source of the indicator,
or why the enemy presents a certain pattern. Indicators stem from military logic, doctrinal training,
organizational constraints, bureaucratic constraints, or the personality of the enemy commander.
4-46. The event matrix and information collection plan serve as important tools for analysts to document
developing events. By developing these products in a logical, progressive, or step-by-step manner, they
often provide easy answers for the G-2/S-2 during the initial phases of an event; however, there may be a
tendency to over rely on them. Indicators also tend to discourage analytical thinking because a broad view
of the event is more readily apparent.
4-47. While it is important to understand and look for indicators of military activity, analysts cannot ignore
specific indicators that might not fit a military category. All-source intelligence analysts at the operational
and strategic levels consider the availability of resources such as funding, fuel, and the ability of a country
to sustain its military.
Fiscal Resources
4-48. A fiscal resource is one of the very best indicators of an organization’s or country’s ability to support
a limited or protracted military mission or its willingness to militarily, overtly, or covertly support another
country’s military or terrorist action. Fiscal resources underline the main indicators of a terrorist group’s
COAs, intentions, and capabilities.
4-49. Countries that are not fiscally independent may be willing to allow the use of their territory as a
training or holding area and use their military in a mercenary role in return for monies, equipment, or
advanced technology. When a country undertakes an action or program requiring a significant commitment
of fiscal resources, it is a strong indication of a serious intent, capability, and commitment to that action or
18 August 2014
ATP 2-33.4
4-7
Chapter 4
program. Fiscal resources can support the analyst’s theory of a country’s commitment, intent, or ability to
commit to a military action. Fiscal independence also adds credence to a country’s verbal threats and
political and economic influence.
Other Resources
4-50. If a country commits a scarce resource to support a military action, it may indicate the country’s
intent to project a false commitment to achieve a military solution while attempting to force another
country to seek a peaceful solution (which usually involves forcing the other country to make some
concessions). A country that has scarce resources may place such a high value on the resources that it may
not use them unless it is forced. Countries with a scarce resource (technology, military equipment, military
experts) may be willing to employ a resource they have in abundance (military personnel, training areas,
raw minerals) to acquire more of the scarce resources. These types of indicators should be analyzed to
correctly answer commander’s critical information requirements and PIRs and to help facilitate situational
understanding for the commander.
4-51. If a threat element makes a preparation that is not reversible by inexpensive and efficient means, it
may be unintentionally signaling intent. If an artillery brigade dumps more ammunition at its gun locations
than it has the organic transport to carry in one lift, then there is a problem if the unit moves. This may
indicate that the unit does not anticipate moving with the ammunition, which could mean it plans to fire the
ammunition or leave it in place.
Step 3: Analyze Indicators
4-52. Analysis of indicators requires a number of actions. All-source intelligence analysts—
z
Examine collected information and intelligence.
z
Ensure any information pertaining to indicators has footnotes that include details of the event.
z
Look for the development of patterns. All-source intelligence analysts notice one set of
indicators is satisfied, and identify if another is not.
z
Watch closely to detect deception operations.
z
Recheck the validity of the indicators and verify the staff did not miss any relevant information.
If the indicators are valid, analysts report the findings. The commander needs to know whether
the threat is conducting an actual combat operation or a deception operation.
z
Look for indicators based on the principle of mass. The enemy can be expected to conduct
deception operations. However, deception operations are normally conducted as inexpensively
as possible, attempting to deceive us with the least expenditure of resources. Indicators based on
a major confirmed commitment of forces are most likely to reflect the true situation.
Step 4: Use Indicators
4-53. Indicators provide an objective baseline for tracking events, instilling rigor in the analytic process,
and enhancing the credibility of the final product. Descriptive indicators are best used to help the analyst
assess whether there are sufficient grounds to believe that a specific action is taking place. They provide
analysts with a systematic way to validate a hypothesis or help substantiate an emerging viewpoint.
4-54. A classic application of indicators is to seek early warning of an enemy attack or a nuclear test by a
foreign country. Indicators are often paired with scenarios to identify which of several possible scenarios
are developing. They can also be used to measure change such a political instability or a humanitarian
crisis.
4-55. Defining explicit criteria for tracking and judging the course of events makes the analytic process
more visible and available for scrutiny by others, thus enhancing the credibility of analytic judgments.
Including an indicators list in the finished analytical product helps decisionmakers track future
developments and build a more concrete case for the analytic conclusions.
4-56. The indicator list becomes the basis for directing collection efforts and for routing relevant
information to all interested parties. It can also serve as the basis for the analyst’s filing system to track
these indicators.
4-8
ATP 2-33.4
18 August 2014
Diagnostic Analytic Techniques
4-57. Analysts must periodically review the validity and relevance of their indictors. Intelligence analysts
develop indicators by placing them in a logical order and at different levels or stages. In this methodology,
there is often a logical sequence or order of indicators. In some cases, it may be more advantageous to
develop indicators as a series of milestones leading to a sequential action or event. All-source intelligence
analysts consider probability and priority when describing these indicators. (See appendix A for more
information on indications and warnings.)
CONDUCTING STUDIES
4-58. Intelligence analysts complete products such as studies in order to provide the requesting command
or organization with detailed information, assessments, and conclusions about the AO and area of interest.
A study can be a systems or functional analysis product. It should be as detailed and in-depth as time
allows. For example, studies can provide knowledge that supports an understanding of—
z
Local populations.
z
Cultures and caste system.
z
Societal systems or organizations.
z
Political systems and structures.
z
Religions practiced and their impacts.
z
Moral beliefs and their impacts.
z
Civil authority considerations.
z
Military organizations, structure, and equipment.
z
Attitudes toward U.S., multinational, or host-nation forces.
4-59. When all-source intelligence analysts are given the task to complete a study, they conduct the
following steps sequentially:
z
Step 1. Verify the details of the task assigned.
z
Step 2. Request clarification of the task if it is required.
z
Step 3. Identify existing information and intelligence which applies to the task.
z
Step 4. Compile existing information into the determined format.
z
Step 5. Identify gaps in information and intelligence that needs to be researched.
z
Step 6. Begin researching material.
z
Step 7. Combine the sets of information into a complete study.
4-60. Studies can also include the views and attitudes of multinational and host-nation forces towards these
factors. Complete studies include two tasks:
z
Conduct area, regional, or country study.
z
Conduct specified study.
CONDUCT AREA, REGIONAL, OR COUNTRY STUDY
4-61. All-source intelligence analysts study and provide mission-focused knowledge of the terrain and
weather, civil considerations, and threat characteristics for a specified area or region of a foreign country—
including the attitudes of the populace and leaders toward joint, multinational, or host-nation forces—to
assist in achieving goals and objectives. Studies can also include the views and attitudes of multinational
and host-nation forces. Human terrain teams are part of the Army human terrain system that can also
support area and regional studies. These teams develop, train, and integrate social science based on
research and analysis to support operationally relevant decisionmaking.
CONDUCT SPECIFIED STUDY
4-62. All-source intelligence analysts provide focused knowledge of the terrain and weather, civil
considerations, and threat characteristics for a specified topic or requirement. Studies provide the
requesting command or organization with detailed information, assessments, and conclusions on the area of
interest.
18 August 2014
ATP 2-33.4
4-9
This page intentionally left blank.
Chapter 5
Core Army Analytic Techniques
This chapter discusses the core Army analytic techniques used by intelligence
analysts. It also discusses the core analytic techniques used to develop situational
understanding and conclusions, analyze complex networks and associations, and
conduct pattern analysis.
OVERVIEW
5-1. The ability to order information, recognize patterns, reason, think critically, and think creatively aids
all aspects of intelligence analysis. Depending on the situation being analyzed, there are various techniques
that can aid in the analysis as well. Forming an accurate conclusion is made more probable by the selection
of an appropriate technique to use when conducting intelligence analysis. The following techniques are
commonly used in both the academic and intelligence communities. Analysts should know how to reach
conclusions. While there is no right way to reason, analysts can apply analytical techniques to augment
reasoning skills.
ANALYTIC TECHNIQUES
5-2. Analytic techniques have been used at the strategic, operational, and tactical level for some time and
are routinely used by intelligence personnel conducting intelligence analysis. The techniques often
incorporate multiple basic structured analytic techniques in combination with diagnostic techniques. Each
of these core techniques has its own merits:
z
Developing situational understanding and conclusions.
Brainstorming.
Comparison.
Mathematical analysis.
Situational logic.
z
Analyzing complex networks and associations.
Link analysis.
Network analysis.
Sociometrics or social network analysis.
z
Conducting pattern analysis.
Chronologies.
Pattern analysis plot sheet.
Incident overlay.
Pattern of life analysis.
Note. The analytic techniques of center of gravity analysis, functional analysis, and modeling are
valuable techniques Army intelligence analysts employ; however, they are not discussed in this
publication. See FM 2-01.3 for discussions on these methodologies.
18 August 2014
ATP 2-33.4
5-1
Chapter 5
SECTION I - DEVELOPING SITUATIONAL UNDERSTANDING AND
CONCLUSIONS
5-3. These techniques aid in developing new ideas and analogical reasoning, determining capabilities and
limitations, increasing understanding of a situation, and forming conclusions in support of mission
command. A group or team using these analytic techniques is usually more effective than a single analyst
because this technique stimulates learning and new ideas.
BRAINSTORMING
5-4. Brainstorming is a widely used technique for stimulating new thinking, and it can be applied to
virtually all the other structured analysis techniques as an aid to thinking. Typically, analysts will
brainstorm when they begin a project to help generate a range of hypotheses about their issue.
FACTS
5-5. Brainstorming, almost by definition, involves a group of analysts meeting to discuss a common
challenge. A modest investment of time at the beginning or critical points of a project can take advantage of
the group’s different perspectives to help structure a problem. This group process allows others to build on
an initial idea suggested by a member of the brainstorming session.
5-6. An individual analyst also can brainstorm to produce a wider range of ideas than a group might
generate, without regard for other analysts’ egos, opinions, or objections. However, an individual will not
have the benefit of others’ perspectives to help develop the ideas as fully. Moreover, an individual may
have difficulty breaking free of personal cognitive biases without the benefit of a diverse group.
5-7. This technique can maximize creativity in the thinking process, force analysts to step outside their
normal analytic mindsets, and suspend their limited perspectives about the practicality of ideas or
approaches. Generally, brainstorming allows analysts to see a wider range of factors that might bear on the
topic than they would otherwise consider. Analysts typically censor ideas that seem farfetched, poorly
sourced, or seemingly irrelevant to the question at hand.
5-8. Brainstorming gives permission to think more radically or
“outside the box.” In particular,
brainstorming can spark new ideas, ensure a comprehensive look at a problem or issues, raise unknowns,
and prevent premature consensus around a single hypothesis.
THE METHOD
5-9. Brainstorming should be a very structured process to be most productive. An unconstrained, informal
discussion might produce some interesting ideas, but usually a more systematic process is the most
effective way to break down mindsets and produce new insights. In particular, the process involves a
divergent thinking phase to generate and collect new ideas and insights, followed by a convergent phase in
which ideas are grouped and organized around key concepts. Some of the simple rules to be followed
include—
z
Never censor an analyst’s ideas no matter how unconventional they might sound.
z
Find out what prompted the thought, as it might contain the seeds of an important connection
between the topic and an unstated assumption.
z
Allow enough time to do brainstorming correctly. It usually takes one hour to set the “rules of
the game,” get the group comfortable, and exhaust the conventional wisdom on the topic. Only
then will the truly creative ideas begin to emerge.
z
Involve at least one outsider in the process; that is, someone who does not share the same
educational backg1round, culture, technical knowledge, or mindset as the core group but is
familiar with the topic.
5-2
ATP 2-33.4
18 August 2014
Core Army Analytic Techniques
5-10. A two-phase, eleven-step structured process is often used to elicit the most information from the
brainstorming sessions. This process is described below:
z
Phase 1—Divergent Thinking Phase:
Step 1. Distribute a piece of stationery with a re-adherable strip of adhesive on the back,
and pens or markers to all participants. Typically, 10 to 12 people work best.
Step 2. Pose the problem in terms of a focal question. Display it in one sentence on a large
easel or whiteboard.
Step 3. Ask the group to write down responses to the question, using key words that will fit
on the small piece of stationery.
Step 4. Stick all the notes on a wall for all to see—treat all ideas the same.
Step 5. When a pause follows the initial flow of ideas, the group is reaching the end of their
collective conventional thinking and the new divergent ideas are then likely to emerge. End
the “collection stage” of the brainstorming after two or three pauses.
z
Phase 2—Convergent Thinking Phase:
Step 6. Ask the participants as a group to rearrange the notes on the wall according to their
commonalities or similar concepts. Talking is discouraged. Some notes may be moved
several times as notes begin to cluster. Copying some notes is permitted to allow ideas to be
included in more than one group.
Step 7. Select a word or phrase that characterizes each grouping or cluster once all the notes
have been arranged.
Step 8. Identify any notes that do not easily fit with others and consider them either isolated
thoughts or the beginning of an idea that deserves further attention.
Step 9. Assess what the group has accomplished in terms of new ideas or concepts
identified or new areas that need more work or further brainstorming.
Step 10. Instruct each participant to select one or two areas that deserve the most attention.
Tabulate the votes.
Step 11. Set the brainstorming group’s priorities based on the voting and decide on the next
steps for analysis.
5-11. Brainstorming can be used in developing threat COAs and in anticipating the actions of other types
of threats (state and non-state as well as organizations, groups, and individuals) that can influence the
commander’s area of interest. Brainstorming is also effective in developing recommendations for
information collection and targeting strategies. (For example, an analytical team in Afghanistan may
conduct a brainstorming session to develop observables and indicators for Taliban shadow government
activities in Kabul province.)
5-12. Brainstorming is one of the most widely used group idea generation tools today, capitalizing on the
idea that grouping people together is more effective than letting participants work alone. Conducting a
structured brainstorming session is most effective if we recognize and avoid the common brainstorming
pitfalls: blocking, evaluation apprehension, and personality faceoff.
z
Blocking refers to the human inability to effectively develop new ideas while keeping old ideas
in active storage in short-term memory. When people cannot immediately input their ideas
because they have to wait for someone else to describe theirs, they often end up judging or
editing them, or even forgetting them altogether. Even when people do get a chance to describe
an idea during brainstorming, they may get to offer only one or two comments before someone
else breaks in. The larger the brainstorming group, the bigger the amount of blocked
participants, and the fewer the ideas produced compared to an equal number of people
generating ideas independently.
z
Evaluation apprehension refers to the experience of being anxious about being negatively
evaluated or not positively evaluated. In other words, it is the concern for how others are
evaluating us.
z
Personality faceoff refers to the clash of personalities between people. Overpowering people try
to dominate the activity. Passive people try to get by unnoticed. Stubborn people get
18 August 2014
ATP 2-33.4
5-3

Chapter 5
overprotective about their ideas and do not accept the ideas of others. Fearful people are reticent
and evasive, only presenting safe ideas.
COMPARISON
5-13. Comparison is used to understand current events by comparing them with historical precedents in the
same country or with similar events in other countries. It differs from applying theory in that conclusions
are drawn from a small number of cases, whereas applying theory is generated from examining a large
number of cases. This approach is useful when faced with ambiguous situations because it looks at how the
country handled similar situations in the past or how similar countries handled similar situations.
5-14. Comparison analysis helps to work out the importance of a number of options relative to each other.
It is very useful when the analyst lacks objective data to base this on.
5-15. Comparison makes it easy to choose the most important problem to solve, or select the solution that
will give the greatest advantage. Paired comparison analysis helps to set priorities where there are
conflicting demands on the resources. Figure 5-1 shows a simple matrix for comparing COAs.
Figure 5-1. Matrix comparing courses of action
FACTS
5-16. Figure 5-2 uses the criticality, accessibility, recuperability, vulnerability, effect, and recognizibility
(CARVER) targeting method to compare potential enemy targets on an overseas force. In this method,
lower scores indicate less desirable outcomes, with higher numbers indicating a more desirable outcome.
Employing the CARVER matrix—
z
In the offensive can help identify targets that are vulnerable to attack.
z
In the defensive can identify high-risk targets that require additional security assets for
protection.
5-17. See ATP 3-05.1 for more information on unconventional warfare. The example in figure 5-2
compares the value of a potential target against the risk of neutralizing the target.
5-4
ATP 2-33.4
18 August 2014

Core Army Analytic Techniques
Figure 5-2. Comparison of targets
THE METHOD
5-18. The following steps are one method to use the CARVER technique:
z
Step 1. List the variable to be compared. It may be useful to use brainstorming to get an initial
list and then refine it for a final list of variables.
z
Step 2. Mark the variables as row headings on a matrix.
z
Step 3. Place the events being compared as column headings.
z
Step 4. Move across each row and determine the importance of each variable to that event’s
occurrence by assigning it a weighted rank. Each variable must be considered in relation to the
country, culture, and specific circumstances of the events.
z
Step 5. After weighting each variable, consolidate each event’s weight by adding up the
columns. If the numbers are similar, the analyst may assess the event is likely to occur in a
manner similar to the event used as a comparison.
5-19. Comparison analysis is an effective way of weighing the relative likelihood of different COAs based
on facts and assumptions. It is useful where COAs are ambiguous or are of similar likelihood. The
CARVER technique provides a framework for comparing each COA against all others and helps to show
the difference in importance between factors.
MATHEMATICAL ANALYSIS
5-20. Mathematical analysis is effective in determining the capabilities and limitations of an organization
based on an evaluation of tangibles and intangibles. Mathematical analysis aids the analyst calculating the
overall combat effectiveness of an organization. Mathematical analysis is the use of simple mathematical
ratios to answer intelligence questions. This normally includes the use of ratios or the comparison of gross
numbers. The following scenarios show examples of ratio comparisons.
18 August 2014
ATP 2-33.4
5-5
Chapter 5
Examples of Ratios
There were 45 reports this month—15 more than last month. The force ratio is 3:1;
25% of route 1 has been cleared of improvised explosive devices by engineer
reconnaissance units.
A ratio is a comparison of 2 numbers. The numbers may be separated by a colon (:)
or slash (/) (a ratio of 8 to 13 may be written 8:13 or 8/13). Example: A supply convoy
consists of 15 supply trucks, 2 Strykers, and 4 mine-resistant ambush protected (also
called MRAP) vehicles. The ratio of MRAP vehicles to supply trucks is 4:15; It may
also be expressed as 4/15 or 4 to 15. The order matters. A ratio of 1:7 is not the
same as a ratio of 7:1.
5-21. Mathematical analysis uses both tangible and intangible facts. Tangible facts are those items that
may be counted, physically, by the analyst. Intangible facts are difficult to quantify (such as, leadership,
combat experience, training, and area knowledge).
z
Step 1. Evaluate the enemy situation including the number of personnel, numbers and types of
equipment the enemy uses, the tactics employed, combat experience, training, leadership, and
area knowledge.
z
Step 2. Evaluate the friendly situation including the number of personnel, the numbers and types
of equipment friendly forces uses, the tactics employed, combat experience, training, leadership,
area knowledge, and the mission.
z
Step 3. Write a short paragraph explaining both the intangible facts (tactics employed, combat
experience, training, leadership, and area knowledge).
z
Step 4. List the tangible facts below the paragraph for each force (number of personnel, numbers
and types of equipment).
z
Step 5. Evaluate both the intangible and tangible facts, comparing them using mathematical
ratios to show strengths and weaknesses of enemy and friendly forces.
z
Step 6. Draw conclusions based on the mathematical ratios in combination with the intangible
facts.
5-22. The following vignette shows how mathematical analysis can be used to support mission command.
5-6
ATP 2-33.4
18 August 2014
Core Army Analytic Techniques
Mathematical Analysis
Enemy Situation: There is an insurgent cell of approximately 11 seasoned fighters operating
in and around the town of Tuc. The cell leader is known among the local populace, local police,
and the Afghan Army in the area. He grew up in the area and is familiar with the local terrain.
The cell has conducted several successful attacks against Afghan military forces in the last 12
months. Their most common method of attack is using an “L” shaped ambush in complex
terrain. Intelligence analysis indicates this type of cell is generally equipped as follows:
•
11 x AK-47s.
•
2 x 9-mm pistols.
•
1 x RPD light machinegun.
•
3 x RPG-7V.
•
8 x fragmentation grenades.
•
4 x ICOM radios.
•
11 x personal cell phones.
•
6 x command-detonated improvised explosive devices.
Friendly Situation: The mission is to conduct a foot reconnaissance of route to village used
for commerce. The patrol leader has been to the village on three occasions (once by helicopter
and twice as a patrol member). This is his first time as the patrol leader. Prior to departure,
patrol was briefed that the area had no indicators of enemy presence or activities. The patrol
consists of 16 x personnel:
•
12 x U.S. Soldiers (including a public affairs office team of 2).
•
2 x Interpreters and translators (also called I/Ts).
•
2 x Afghan soldiers (both speak Basic English).
The patrol is equipped with—
•
10 x M4s (2 with grenade launchers).
•
2 x surface acoustic waves.
•
5 x AK-47s.
•
4 x 9-mm pistols.
•
2 x antitank weapons.
•
40 x fragmentation grenades.
•
2 x manpacked satellite communications radios.
•
15 x personal cell phones.
A quick mathematical analysis reveals the following:
When considering total numbers, force ratio favors friendly forces by a factor of 1.4 to 1.
However, when considering just combat troops, the ratio is about 1:1. Additionally, there are
intangibles that must be factored in:
• Combat experience and leadership favor the enemy.
• Area knowledge favors the enemy.
When evaluating firepower, the results are as follows:
• Crew-served weapons: force ratio favors friendly forces at 2:1.
• Assault rifles: force ratio favors friendly forces at 5:4.
• Pistols: force ratio favors friendly forces at 2:1.
• Grenade launchers: force ratio favors friendly forces at 1:5.
• Antitank weapons: force ratio favors enemy forces at 2:0.
• Grenades: force ratio favors friendly forces at 5:1.
• Demolitions: force ratio favors enemy forces at 6:0.
Intangibles:
• Type and amount of ammunition are even.
• Fields of fire and cover and concealment favor the enemy.
Conclusion: Based on aggregate force ratios, U.S. force would most likely be defeated by an
undetected enemy ambush. Recommend additional reconnaissance to mitigate enemy
advantages and ensure the security of the patrol.
18 August 2014
ATP 2-33.4
5-7
Chapter 5
SITUATIONAL LOGIC
5-23. Situational logic is an analytical methodology employed by intelligence analysts when a situation is
regarded as one of a kind and analysis will not benefit from broad or specific comparison with other events.
Situational logic is normally used to trace cause-effect relationships or, when dealing with purposeful
behavior, means-end relationships. For example, an analyst identifies the goals being pursued and explains
why an enemy believes certain means will achieve these goals. There are two weaknesses in this
methodology to be aware of: it is difficult for an analyst to see problems as an enemy may see them; and
the process does not incorporate theoretical data from other areas or events that may assist in the analysis.
5-24. Situational logic is the most common method of intelligence analysis and is sometimes called the
area studies approach. This involves generating different hypotheses on the basis of considering concrete
elements of the current situation. Broad, global generalizations are avoided. Even though most analysts
know this to be untrue, every situation is treated as one-of-a-kind, to be understood in terms of its own
unique logic.
5-25. Situational logic is cause-and-effect logic, based on the assumption of rational, purposive behavior.
The analyst identifies the goals being pursued by the enemy and explains why the enemy believes certain
means will achieve certain goals. One of the major risks with this approach is projecting personal values
onto an enemy. The three-step process includes—
z
Step 1. A single entity (such as a country or province, organization, military, or political group)
is examined, although on multiple interrelated issues. The analyst conducts in-depth research and
builds a base of knowledge on the target entity.
z
Step 2. Next, the analyst seeks to identify the logical antecedents of the situation. This is called
building a scenario. The analyst draws upon the knowledge base developed during the first step
to develop a deeper understanding of the situation and how it came about.
z
Step 3. Using the knowledge base and the understanding of the situation, the analyst works
backwards to explain the origins of the current situation; the analyst then identifies logical
consequences of the situation to estimate the future outcome.
SECTION II - ANALYZING COMPLEX NETWORKS AND ASSOCIATIONS
5-26. Analyzing complex networks and associations is the review, compilation, and interpretation of data
to determine the presence of associations among individuals, groups (military units, insurgent and terrorist
groups, criminal organizations), businesses, or other entities; the meaning of those associations to the
people involved; and the degrees and ways in which those associations can be strengthened or weakened.
5-27. There are three related methods used to analyze complex networks and associations:
z
Link analysis.
z
Network analysis.
z
Sociometrics or social network analysis.
Note. It is common for analysts to blend all three of these methods, in spite of their different
approaches. Experience with a problem set and familiarity with the use of these analytic
techniques encourages a blended approach analyzing complex networks and associations.
LINK ANALYSIS
5-28. Link analysis is a technique used to evaluate relationships (connections) between various types of
objects including organizations and individuals that use visualization tools to organize and display data.
5-29. Link analysis, along with network analysis, is a method used to identify, analyze, and visualize
patterns in data. These methods all involve the collection, processing, visualization, and analysis of
information. Although these processes can be done manually, link analysis in the U.S. military has largely
become automated. This is because the vast amount of information intelligence personnel process on a
regular basis results in information overload that negatively affects the ability of intelligence personnel to
5-8
ATP 2-33.4
18 August 2014
Core Army Analytic Techniques
complete intelligence assessments in a timely and accurate manner. Link analysis software programs are
standard components on the Army’s intelligence processors from theater down to the company level.
5-30. Having seen its success in aiding law enforcement agencies in analyzing criminal organizations, the
U.S. military now uses link analysis in analyzing terrorist and other complex networks. Link analysis is
used by intelligence personnel to identify connections between individuals, organizations, and activities in
order to determine associations.
5-31. There are three types of visualization tools used in link analysis to record and visualize information:
the association matrix, the activities matrix, and the link diagram.
Link Analysis Done Without Automation
Although most link analysis is done using automation, a different approach to link
analysis is to use small sticky notes of paper on a white board. The analyst labels the
notes and places them on the white board. Connections are drawn on the board
between different entities and nodes, using markers. This method has several benefits:
• A potentially larger picture can be seen on a white board than what may be seen
on a computer monitor; many automated systems present limited views.
• It allows movement of the entities, quick redrawing of links, and color coding using
different markers.
• It allows for a team of analysts to work together to develop analysis.
5-32. Link analysis generally follows the order shown. Analysts must understand that steps 1 and 2 are
often interchanged and/or done concurrently. Each of these steps is discussed below:
z
Step 1. Construct an association matrix.
z
Step 2. Construct an activities matrix.
z
Step 3. Construct a link diagram.
ASSOCIATION MATRIX
5-33. An association matrix is used to identify the existence and type of relationships that exist between
individuals as determined by direct contact. Direct contact is determined by a number of factors, including
but not limited to—
z
Face-to-face meetings.
z
Telephonic conversation.
z
Membership in a group or organization.
Note. It is important to know that using the association matrix without modification will show
only the existence of relationships not the nature, degree, or duration of those relationships.
Facts
5-34. A known association between individuals is depicted on the matrix by a dot or filled-in circle.
Suspected associations are depicted on the association matrix by an open circle. The rationale for depicting
suspected associations is to get as close as possible to an objective analytic solution while staying as close
as possible to known or confirmed facts. If a suspected association is later confirmed, the appropriate
adjustment may be made on the association matrix simply by filling in the open circle. A secondary reason
for depicting suspected associations is that it may give the analyst a focus for requesting to task limited
intelligence collections assets in order to confirm the suspected association. Suspected associations between
persons of interest are considered to be associations which are possible or even probable, but cannot be
confirmed using the above criteria. Examples might be—
z
A known party calling a known telephone number. (The analyst knows to whom the telephone
number is listed, but it cannot be determined with certainty who answered the call.)
z
A face-to-face meeting where one party can be identified, but the other party can only be
tentatively identified.
18 August 2014
ATP 2-33.4
5-9

Chapter 5
5-35. An association matrix is constructed in the form of a right triangle having the same number of rows
and columns. Figure 5-3 is an example of an association matrix.
Figure 5-3. Example association matrix
The Method
5-36. Creating an association matrix involves four steps:
z
Step 1. Construct a triangular matrix with multiple columns and rows in a table. This may be
done using software analysis tools, a spreadsheet, or by hand.
z
Step 2. Extract entities and the information about their relationships from imagery, SIGINT
intercepts, message traffic, or whatever other source is available to the analyst. The analyst
should not limit information sources, so long as they provide valid and pertinent information.
z
Step 3. Place names of individuals and organizations along the angled side of the triangle; one
individual or organization corresponds to a single row and a single column. Personalities must
be listed in exactly the same order in the association matrix and the activities matrix to ensure
that all possible associations are correct.
z
Step 4. Analyze the entities and associations in the matrix. Place a solid circle in boxes where
entities in columns and rows meet that have an association. Circles are colored in solidly for
known associations and left un-colored for suspected associations.
Note. Analysts may add additional symbols and/or colors to an association matrix to clarify
relationships between entities. For example, the analyst could use half-colored circles to denote a
greater probability of association (using subjective probability; see chapter 3); or the analyst
could color association circles green to denote the association involves money.
5-10
ATP 2-33.4
18 August 2014
Core Army Analytic Techniques
ACTIVITIES MATRIX
5-37. An activities matrix is used to determine connections between an individual and organizations,
events, locations, or activities (excluding other individuals).
Facts
5-38. The activities matrix is a rectangular array of personalities compared against activities, locations,
events, or other appropriate information. The kind and quantity of data that is available to the analyst
determines the number of rows and columns and their content. The analyst may tailor the matrix to fit the
needs of the problem at hand or may add to it as the problem expands in scope.
5-39. The activities matrix normally is constructed with personalities arranged in a vertical listing on the
side of the matrix with events, activities, organizations, addresses, or any other common denominator
arranged along the bottom or top of the matrix. The activities matrix is critical for the study of a group’s
internal and external activities, external ties and linkages, and even modus operandi.
The Method
5-40. Creating the activities matrix involves four steps:
z
Step 1. Construct a rectangular matrix with multiple columns and rows in a table. This may be
done using software analysis tools, a spreadsheet, or by hand.
z
Step 2. Extract entities and the information about their relationships from imagery, SIGINT
intercepts, message traffic, or whatever other source available to the analyst. The analyst should
not limit information sources, so long as they provide valid and pertinent information.
z
Step 3. Place names of individuals and organizations along one side; one individual or
organization corresponds to a single row. Personalities must be listed in exactly the same order
in the association matrix and the activities matrix to ensure that all possible associations are
correctly identified. Place activities, locations, buildings, and facilities along the top or bottom;
one place, activity, location, building, or facility corresponds to a single column.
z
Step 4. Analyze the entities and associations in the matrix. Place a solid circle in boxes where
entities in columns and rows meet that have an association. Circles are colored in solidly for
known associations and left un-colored for suspected associations.
Note. Analysts may add additional symbols and/or colors to an activities matrix to clarify
relationships between entities. For example, the analyst could use half-colored circles to denote a
greater probability of association (using subjective probability; see chapter 3). Figure 5-4 on
page 5-12 is an example of an activities matrix.
5-41. Similar to the association matrix, confirmed or “strong” associations between individuals and non-
personal entities are shown with a solid circle or dot, while suspected or “weak” associations are illustrated
by an open circle. Using matrices, the analyst can pinpoint the optimal targets for further intelligence
collection, identify key personalities within an organization, and considerably increase the analyst’s
understanding of an organization and its structure. Matrices can be used to present briefings, evidence, or to
store information in a concise and understandable manner within a database. Matrices do not replace
standard reporting procedures or standard database files.
Note. It is possible, and sometimes productive, to use one matrix for all associations, personal
and non-personal; this is done routinely using automated systems. However, when an analytical
problem includes more than approximately fifty entities (persons and other things), experience
has shown the use of one manual matrix to be cumbersome and difficult to comprehend and
manage.
18 August 2014
ATP 2-33.4
5-11

Chapter 5
Figure 5-4. Example activities matrix
LINK DIAGRAM
5-42. A link diagram graphically displays connections between individuals, organizations, and activities.
Link diagrams are created from information contained in a unit’s historical files and from information that
is currently being reported. Analysts should use a link diagram whenever individuals, groups, group
activities, or process networks are being reviewed for insight. The need for link diagrams increases with the
increase in data and network complexity.
Facts
5-43. A link diagram is a living document in that it is never finished. Link analysis provides a freeze-frame look
at activity and seldom conveys change over time unless paired with a timeline or other multidimensional
approach. To remain relevant and effective, link diagrams must be continually updated to include all relevant
reported information. Link diagrams can be created manually or by using software applications on some
intelligence systems. For example, the DCGS-A has Analyst Notebook programmed on it.
5-44. Link diagrams can clarify what is known and what may be missing about the network being charted.
Key nodes and hubs can be identified for social, organizational, and infrastructure networks, giving insight
into relationships and potential vulnerabilities. The charts greatly aid collection planning. Analysts could
assume a central figure in a network is the leader because of the number of connections to that individual.
However, analysts should be aware that link diagrams do not depict time relationships.
The Method
5-45. Creating a link diagram involves five steps:
z
Step 1. Extract entities and the information about their relationships from association and
activities matrices, imagery, SIGINT intercepts, message traffic.
z
Step 2. Place entity associations into a link diagram by using a software link analysis tool or
spreadsheet or drawing it by hand.
z
Step 3. Analyze the entities and links in the link diagram.
5-12
ATP 2-33.4
18 August 2014
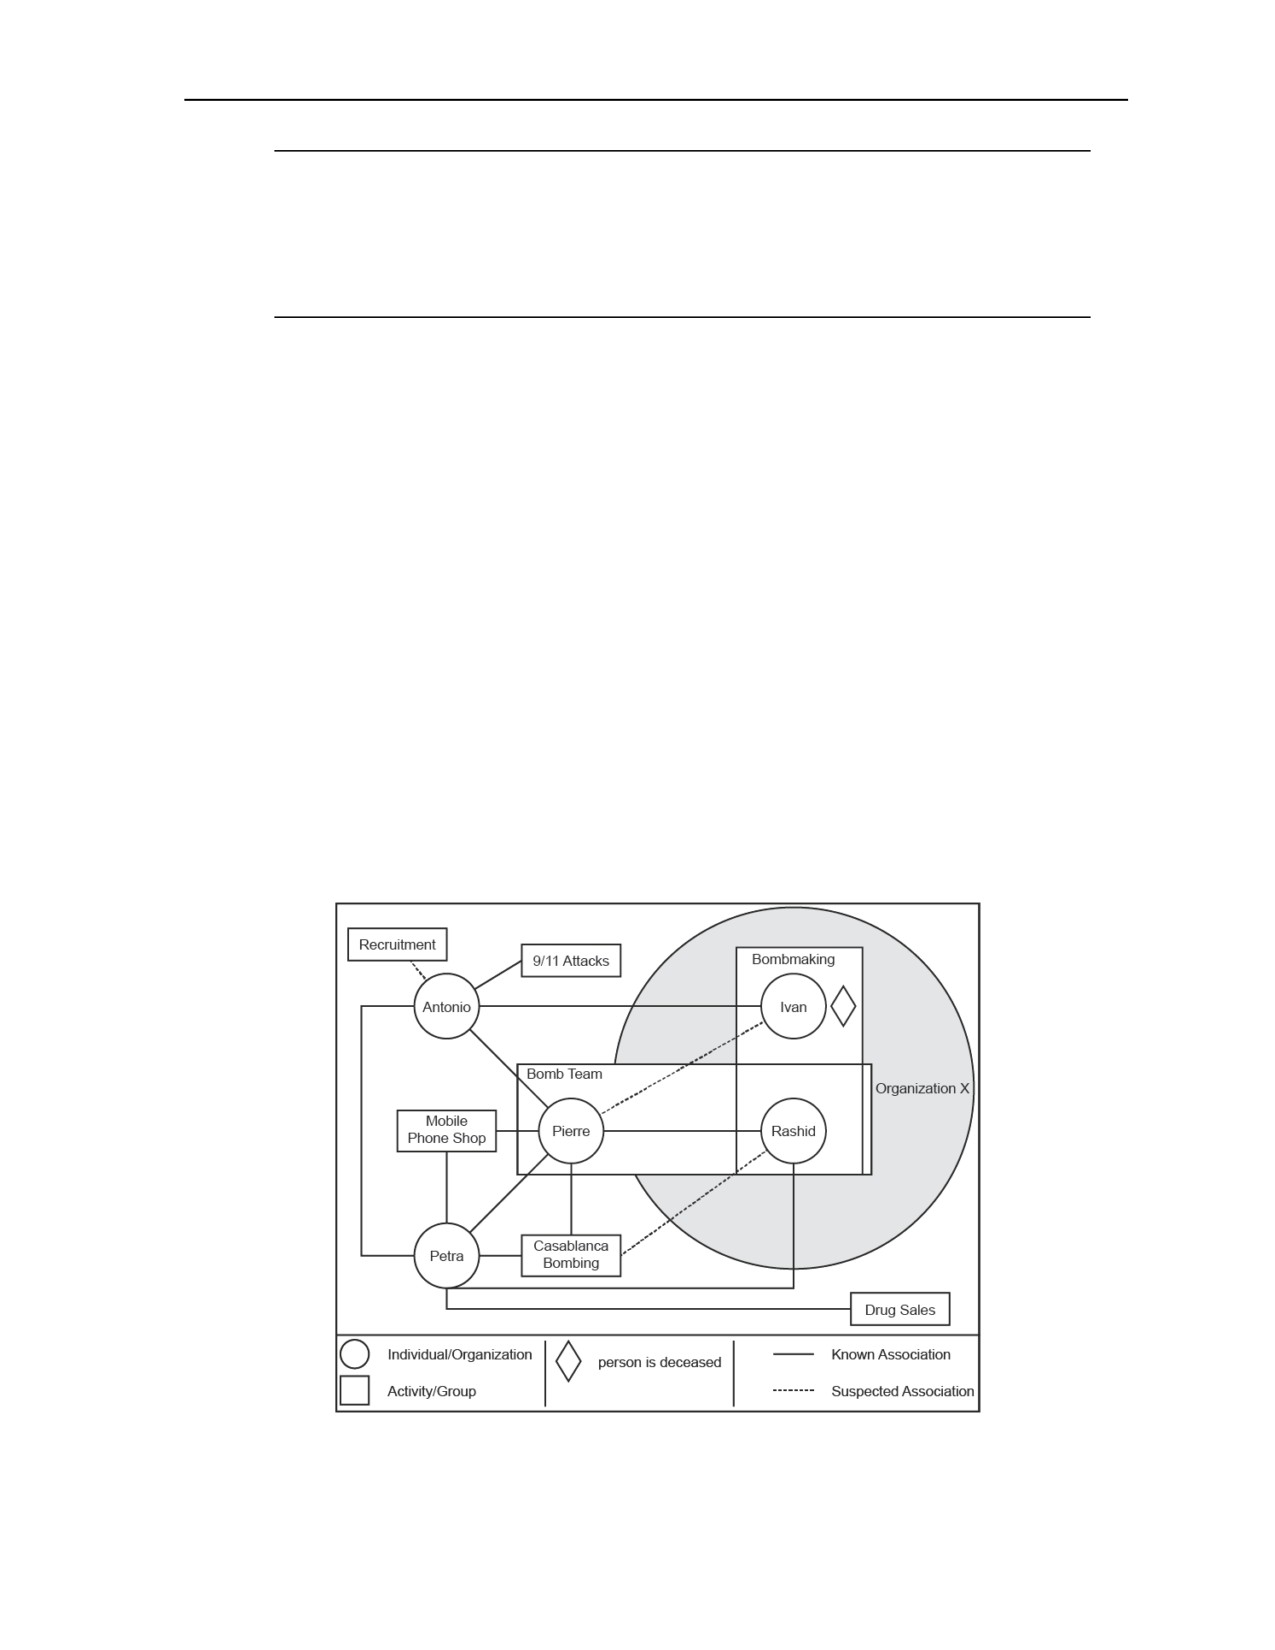
Core Army Analytic Techniques
Note. Link diagrams are comprised of symbols. Circles denote individuals or organizations;
squares denote activities; triangles or rectangles may denote buildings and facilities. Solid lines
between symbols denote association. Dashed lines between symbols denote possible association.
The analyst may use colored and varying types of lines to show different activities (for example,
green solid lines for money transfer, blue dotted lines for communications, solid black lines for
activity).
z
Step 4. Review the diagram for gaps, significant relationships, and meaning of the relationships
based on the activity occurring. Ask critical questions of the data, such as—
Which entity is central or key to the network?
Who or what is the initiator of interactions?
What role is each entity playing in the network?
Who or what forms a bridge or liaison between groups or subgroups?
How have the interactions changed over time?
Which nodes should be targeted for collection or defeated?
z
Step 5. Summarize what is seen in the diagram and draw interim hypotheses regarding the
relationships.
5-46. The following can assist when using link diagrams:
z
Watch for clutter. Charts may become cluttered by too much data; peripheral data may be set
aside.
z
Use simple charts. Large complex charts can be broken into smaller charts.
z
Eliminate crossing lines to increase clarity.
z
Use computerized software. The charting portion of link analysis may be greatly aided by the
use of computerized software such as Analyst Notebook because it allows one to instantly
redraw the chart as new information becomes available.
5-47. Figure 5-5 is an example of a manually constructed link diagram using some of the information from
the association matrix (see figure 5-3 on page 5-10) and the activities matrix (see figure 5-4).
Figure 5-5. Example link diagram
18 August 2014
ATP 2-33.4
5-13
Chapter 5
NETWORK ANALYSIS
5-48. As performed by intelligence analysts, network analysis is the examination of dynamic, multi-link
human networks characterized by varying degrees of uncertainty, such as terrorist and other irregular threat
organizations usually encountered in a counterinsurgency mission. Unlike conventional hierarchical
military organizations, these types of organizations are cellular and distributed. Part of the difficulty in
countering these types of organizations is to understand how they evolve, change, adapt, and can be
destabilized. Network analysis involves knowledge management, research, and modeling techniques to
extrapolate the structure, locations, members, goals and objectives, activities, and the defeat mechanism for
these types of organizations.
LINK ANALYSIS OR NETWORK ANALYSIS
5-49. These two analytic techniques are very close and often the names are used interchangeably.
Facts
5-50. Both techniques use visualization tools to depict enemy networks; superficially, they may look very
similar. But there are some differences the analyst should understand.
z
Link analysis is a quicker, more superficial look at the connections and associations between
individuals, organizations, events, and activities. Link analysis is the technique most often
employed at the tactical level, especially at brigade and battalion analytic elements.
z
Network analysis takes the analytic effort to the next level. Network analysis examines the
structure and types of associations, the centrality of entities within a network, and the
organization of the network. It is more time and resource intensive than link analysis. Network
analysis is the technique employed at the operational and strategic levels.
5-51. This is not to imply both techniques cannot be used at all levels of intelligence operations. Analysts
understand the limitations of their intelligence elements and choose the best analytic technique or
techniques to meet the commander’s requirements.
The Method
5-52. Conducting network analysis involves eight steps:
z
Step 1. Construct a network chart or diagram. Extract entities and the information about their
relationships from association and activities matrices, imagery, SIGINT intercepts, and message
traffic. Place entity associations into a network diagram by using a software tool or spreadsheet.
Each element is represented by an icon (such as a picture, figure of a person, figure of a
building). The more accurate the icon, the more informative the network diagram will be to
analysts. Draw connections between elements.
z
Step 2. Identify, combine, or separate nodal components. List each node in a database or
software program. Delineate each node and interaction by criteria meaningful to your analysis.
These criteria may include frequency of contact, type of contact, type of activity, and source of
information. The network diagram may be made more informative by re-coloring connections to
present each criterion in a different color or style.
z
Step 3. Identify the functions of each node, as possible. Determine centrality; examine network
density and distance:
What is the centrality of each node within the network?
What role is each entity involved in the network?
Who or what forms a bridge or liaison between groups or subgroups?
How have the interactions changed over time?
Which nodes should be targeted for collection or defeated?
Note. Organizational structure, centrality, and network density and distance are fundamental
concepts to network analysis. These concepts are explained beginning at paragraph 5-62.
5-14
ATP 2-33.4
18 August 2014
Core Army Analytic Techniques
z
Step 4. Cluster the nodes. Look for dense areas of the diagram. Draw shapes around the dense
areas using a variety of shapes, colors, and line styles to denote different types of clusters,
relative confidence in the cluster, or any other criteria deemed important.
z
Step 5. Review the clusters in the diagram for gaps, significant relationships, meanings of
relationships, network structure, centrality, and network density and distance. Identify the
clusters’ functions in the larger network.
z
Step 6. Chart the flow of activities between nodes and clusters. Analyze the flow to assess the
resiliency of the network. Ask the following questions to identify activities, indicators, and lines
of authority:
Which node is the initiator of interactions?
Does it always go in one direction or in multiple directions?
Are the same or different elements and/or nodes involved?
What are the pathways?
If one node or pathway were removed, would there be alternatives already built in?
z
Step 7. Group the clusters into larger clusters to identify larger organizational networks.
Identify network structure of nodes in relation to other nodes within the larger cluster.
Determine centrality of nodes in relation to other nodes within the larger cluster.
Examine network density and distance of the nodal cluster.
z
Step 8. Summarize what is depicted in the diagram and draw hypotheses regarding the network.
Continually update and revise the network diagram as nodes or links change or are added.
FUNDAMENTAL CONCEPTS OF NETWORK ANALYSIS
5-53. Analysts must understand the linkage or connection between components of a system or group
performing identical, similar, related, or complementary activities or functions. Viewed as a system, a
network is an interconnected or interrelated group, or chain—a functionally, physically, and/or behaviorally
related group of regularly interacting or interdependent elements—that forms a unified whole. Analysts
identify critical nodes or points in order to exploit the network.
5-54. A network consists of individuals and other elements and connections between them. Individuals in a
network are called nodes. A node may also be a non-person point at which subsidiary parts of the system
originate or center (such as the intelligence node or the logistics node of a terrorist cell). A critical node is
an element, position, or command and control entity whose disruption or destruction immediately degrades
the ability of a force to command, control, or effectively conduct operations. Network analysis is the
analysis of how the nodes of a designated system function in relation to one another. Network analysis
assists in identifying critical nodes of the system. Network analysis is comprised of identifying a system or
network, identifying the system’s subsystems, and identifying the critical nodes of the subsystems for
potential targeting.
5-55. Network analysis can be conducted at the strategic, operational, and tactical levels, and may be
conducted across strategic, operational, and tactical levels.
5-56. Analysts conducting network analysis will spend a great deal of time working with various pieces of
information to assist them in understanding relationships. Relationships can exist between people,
organizations, entities, locations, or any combination of the above, and can be represented using a link
diagram. How the various groups interact is as important as knowing who knows (or should know) whom.
Relationships are also present within a network itself. A network is a complex, interconnected group or
system which, in some manner, concerns itself with a specific operation or mission, such as air defense or
mortar fire or IEDs.
5-57. A system consists of interconnected nodes and links.
z
Nodes represent the tangible elements within a system that can be targeted for action, such as
people, places, or things (for example, materiel or facilities).
z
Links are the behavioral or functional relationships between nodes, such as the command or
supervisory arrangements that connect a superior to a subordinate; the relationship of a vehicle
to a fuel source; and the ideology that connects a propagandist to a group of terrorists. Links help
18 August 2014
ATP 2-33.4
5-15

Chapter 5
commanders and staffs visualize how various systems work internally and interact with each
other. They establish the interconnectivity between nodes that allows them to work together as a
system—to behave in a specific way (accomplish a task or perform a function).
5-58. Both nodes and links are symbolic representations meant to simplify the complexity of the real
world; they are useful in identifying centers of gravity, critical nodes, and other lines of effort the command
may wish to influence or change during an operation.
5-59. Enemy networks do not exist in a vacuum. They interact with each other, their supporters in the
population, and, less directly, with their supporters obscured in the power structure. They also interact with
political, security, economic, and real estate key leaders as well as the general population. Networks are
notably resistant to the loss of any one or even several nodes, so the focus of targeting is to identify not just
who or what to target but, if targeted, what loss will cause the most damage to the network. The ultimate
success is to remove sufficient critical nodes simultaneously or nearly, so the network cannot automatically
re-route linkages but suffers catastrophic failure.
5-60. Figure 5-6 shows a simple example of nodes and links in a threat’s air defense system. The air
defense system (a node in the military system) and its radars and missiles (nodes in the air defense system)
are linked to each other and to the maneuver divisions and corps headquarters by their role and ability to
protect these nodes from air attack. Identifying vulnerabilities and using this advantage to attack and
destroy the air defense radars eliminates the link between the radars and air defense missile, degrading the
air defense system’s ability to function effectively. This reduces the level of air defense protection for the
maneuver divisions and makes them more susceptible to friendly forces’ attack. In other words, it could be
unnecessary to attack all nodes in the air defense system in order to degrade its primary function. In
figure 5-6, the analyst determined the air defense radars were a key node because it is a node that is critical
to the functioning of the air defense system.
5-61. Networks are analyzed by examining the organizational structure, centrality of nodes within the
network, and organizational-level analysis.
Figure 5-6. Nodal linkage example
Organizational Structure
5-62. The cell is the smallest element of organizations. Cell members, usually three to ten people, comprise
a cell and act as the basic component for the organization. A cell could, however, be a lone member. One of
the primary reasons for a cellular configuration is security. The compromise or loss of one cell should not
5-16
ATP 2-33.4
18 August 2014

Core Army Analytic Techniques
compromise the identity, location, or actions of other cells. Compartmenting functions within
organizational structure makes it difficult to penetrate the entire organization. Personnel within one cell are
often unaware of the existence of other cells and cannot provide sensitive information to infiltrators or
captors.
5-63. Cells may be based on family or employment relationships, on a geographic basis, or by specific
functions such as direct action or intelligence. The organization may also form multifunctional cells. Cell
members remain in close contact with each other, given allowance and guidance by a directing authority, in
order to provide motivational support and enhance security procedures. The cell leader is normally the only
person who communicates and coordinates with higher levels and other cells. Organizations may form only
one cell or may form several cells that operate in local or regional areas, across national borders, or among
several countries in transnational operations.
5-64. There are two basic ways for organizations to be structured: organizations may use hierarchical or
networked structures. A group may also employ either type or a combination of the two models; and the
structure may change at different levels of the organization.
z
Hierarchical structure:
Hierarchical structure organizations are those that have a well-defined vertical chain of
command, control, and responsibility. Data and intelligence flows up and down
organizational channels that correspond to these vertical chains, but may not necessarily
move horizontally through the organization. Figure 5-7 illustrates hierarchically structured
organizations; both military and terrorist organization may use this structure.
Hierarchical organizations feature specialization of functions in their subordinate cells, such
as support, operations, and intelligence. Usually, only the cell leader has knowledge of other
cells or contacts, and only senior leaders have visibility of the organization at large.
Figure 5-7. Hierarchical organization
18 August 2014
ATP 2-33.4
5-17

Chapter 5
Note. Military organizations’ order of battle is a type of hierarchical network in which the cell
leaders are military commanders and leaders. Unlike insurgent or terrorist cell organization,
military organization and leadership is generally known by all members of the organization.
z
Networked structure:
The analyst will encounter increasingly broader systems of networks as groups become
more experienced. Groups based on religious or single-issue motives may lack a specific
political or nationalistic agenda. They have less need for a hierarchical structure to
coordinate plans and actions. Instead, they can depend and even thrive on loose affiliation
with groups or individuals from a variety of locations. General goals and targets are
announced and individuals or cells are expected to use flexibility and initiative to conduct
action in support of these guidelines.
The effectiveness of a networked organization is dependent on several considerations. The
network achieves long-term organizational effectiveness when cells share a unifying
ideology, common goals, or mutual interests. A difficulty for network organizations not
sharing a unifying ideology is cells can pursue objectives or take actions that do not meet
the goals of the organization, or are counterproductive. In this instance, the independence of
cells fails to develop synergy between their activities and limits their contribution to
common or selective objectives.
Networks distribute the responsibility for operations and plan for redundancies of key
functions. Cells do not contact or coordinate with other cells except for coordination
essential to a particular operation or function. Avoiding unnecessary coordination or
command approval for action provides ability for terrorist leaders to deny responsibility of
specified acts of terror, as well as to enhance operational security.
Figure 5-8 shows an example of a network organization and structural options.
Figure 5-8. Networked organization and structural options example
5-65. Networks are not necessarily dependent on modern information technology for effective command
and control. The organizational structure and the flow of information and guidance inside the organization
are defining aspects of networks. While information technology can make networks more effective, low
technology means (such as couriers, paper messages, and landline telephones) can enable networks to avoid
detection and operate effectively in certain circumstances.
5-18
ATP 2-33.4
18 August 2014

Core Army Analytic Techniques
5-66. While each network’s organization varies based on the requirements of each individual network, there
are some common network structural options seen throughout networks. These common structures within
networks include the chain, hub-and-wheel, all-channel, affiliate associate, and independent confederate.
Chain
5-67. In a chain configuration, each cell links to the node next in sequence. Communication between the
nodes is by passing information along the line. This organization is common among networks that smuggle
goods and people or launder money. Sever one node or link and the chain is disrupted until a link is
reestablished. This is shown in figure 5-9.
Figure 5-9. Network chain
Hub-and-Wheel
5-68. In a network hub structure, cells communicate with one central element. The central cell need not be
the leader or decisionmaker for the network. A variation of the hub is a wheel design where the outer nodes
communicate with one or two other outer cells in addition to the hub. A wheel configuration is a common
feature of a financial or economic network. Identifying a central node may be the desired target, or isolating
a particular cell from other nodes may be preferred depending on the intended purpose (see figure 5-10).
Figure 5-10. Network hub-and-wheel
All-Channel
5-69. In an all-channel structured network, all nodes are connected to each other. The network is
organizationally flat indicating there is no hierarchical command structure above it. Command and control
is distributed within the network. This is communication intensive and can be a security problem if the
linkages can be identified or tracked (see figure 5-11).
Figure 5-11. All-channel network
5-70. Despite their differences, the three basic types will be encountered together in networked
organizations. A transnational terrorist organization might use chain networks for its money-laundering
activities, tied to a wheel network handling financial matters, tied in turn to an all-channel leadership
18 August 2014
ATP 2-33.4
5-19

Chapter 5
network to direct the use of the funds into the operational activities of a hub network conducting
preliminary targeting surveillance and reconnaissance.
5-71. Whatever the means of command, control, and coordination, the selection of critical nodes or
linkages between and among nodes is dependent on what outcome is required. Task sets may include
surveillance, disruption, destruction, or insertion of misinformation and corrupted technology as part of a
larger mission set. Structures can be configured in domains such as key leaders and people, communication
means, or supporting materiel infrastructure systems.
Affiliate Associate
5-72. A variation on network structure is a loosely affiliated method which depends more on an ideological
intent rather than on any formalized command and control or support structure. These semi-independent or
independent cells plan and act within their own means to promote a common ideological position. Irregular
forces may use a combination of functional structures and support from organizations and individuals with
varied local, regional, international, or transnational reach.
5-73. Individuals may interpret a theology, social cause, or perceived grievance to an extreme viewpoint
and commit to collective violent acts with personal action. Cells may form from a general inspiration, such
as Al Qaeda or similar ideological announcements. Other agendas may emerge from a distinctly individual
assessment of purpose and conduct operations as an individual or small cell. Examples include terrorism
that spotlights an agenda, such as individuals who use arson or rioting against immigrant business owners
as a means to intimate. Figure 5-12 shows an example of an affiliated associate network. In this example,
all connections outside the center are unconfirmed associations represented by dotted lines.
Figure 5-12. Affiliated associate network
Independent Confederate
5-74. An individual may have some direct contact with a terrorist cell or irregular force, and align belief in
an extremist agenda, philosophy, or theology that promotes violent acts with personal action. An individual
may also develop extremist viewpoints with no apparent external support system and decide to commit acts
of violence as an individual commitment to action.
5-75. Another type of individual may be a delusional individual with psychological or physical ailments.
These medical conditions are not related to functional structures and organization whose actions could be
mistaken as deliberate terrorism or other criminal activity.
5-20
ATP 2-33.4
18 August 2014

Core Army Analytic Techniques
Centrality
5-76. Although largely influenced by subjective judgment, the identification of a potential key element or
node may be facilitated through an analysis of centrality (for example, how elements and nodes fit in the
system’s network). Centrality can highlight possible positions of importance, influence, or prominence, and
patterns of connections. Relative centrality is determined by analyzing four measurable characteristics:
degree centrality, closeness, betweenness, and core-periphery. Figure 5-13 is an example network to
determine centrality.
Figure 5-13. Centrality example
Degree Centrality
5-77. Degree centrality describes how active an individual is in the network. Network activity for a node is
measured using the concept of degrees—the number of direct connections a node has. Nodes with the most
direct connections are the most active in their networks. Common wisdom in organizations is “the more
connections, the better.” This is not always so. What really matters is where those connections lead and
how they connect the otherwise unconnected. If a node has many ties, it is often said to be either prominent
or influential. As shown in figure 5-13, node D has the highest measure of degree centrality in that it has
the most number of direct links with other nodes. Node D is also an example of a hub. Degree centrality
answers the question: “How many people can this person contact directly?”
Closeness
5-78. Closeness examines a node’s overall position in a network (for example, its global position). The
difference between degree and closeness is an important distinction because an individual entity may have
many direct contacts, but those contacts may not be well connected to the network as a whole.
Consequently, although an individual may have a high level of degree centrality, power and influence
might only be exerted locally, not throughout the entire network. Closeness is calculated by adding the
number of hops between a node and all others in a network (for example, adding the number of hops from
node A to node B, node A to node C, and node A to node D). A lower score indicates that an individual
needs fewer hops to reach others in the network, and is therefore closer to others in the network. For
example, nodes F and G in figure 5-13 have fewer direct links than node D, but have shorter paths to the
other nodes. Nodes with high closeness centrality are in excellent positions to monitor the overall activity
flow within the network. Closeness answers the question: “How fast can this person reach everyone in the
network.”
Betweenness
5-79. Betweenness measures the number of times a node lies along the shortest path between two others.
For exchange of information or services, a node with high betweenness may play an important brokerage or
intermediary role. For example, in figure 5-13 node H would occupy one of the most important locations in
18 August 2014
ATP 2-33.4
5-21
Chapter 5
the network by serving as the only link between nodes I and J, and the remainder of the network. Node H is
an example of a broker node and (assuming nodes I and J were sufficiently important to the network as a
whole) it might also be designated as a key node. The elimination of a broker node can fragment a network
into several subcomponents. Betweenness answers the question: “How likely is this person to be the most
direct route between two people in the network?”
Core-Periphery
5-80. Core-periphery is a statement of how close to the core an organization is versus how much on the
periphery of an organization is a particular node. It is determined by the centrality of a node.
5-81. Nodes on the periphery receive very low centrality scores. However, peripheral nodes are often
connected to networks that are not currently mapped. The peripheral nodes may be resource gatherers or
individuals with their own network outside the group. These characteristics make them important resources
for fresh information not available inside their group. In figure 5-13 on page 5-21, nodes I and J are on the
periphery of the group.
Organizational-Level Analysis
5-82. Organizational-level analysis provides insight about the enemy organization’s form, efficiency, and
cohesion. For example, a regional insurgency may consist of large numbers of disconnected
subinsurgencies. As a result, each group should be analyzed based on its capacities as compared to the
other groups. Organizational-level capacities can be described in terms of network density and network
distance. Each measure describes a characteristic of a networked organization’s structure. Different
network structures can support or hinder an organization’s capabilities. Therefore, each organizational
measure supports the analyst’s assessment of subgroup capabilities.
5-83. Systems network analysis facilitates the identification of significant information about a group of
entities that might otherwise go unnoticed. For example, network analysis can uncover positions of power
within a network, show the basic subgroups that account for a network’s structure, find individuals or
groups whose removal would greatly alter the network, and measure network change over time. The impact
of a system’s network should be evaluated in terms of network density and distance.
Network Density
5-84. Network density examines how well connected a node is by comparing the number of ties actually
present in a network to the total number of ties possible. Network density can indicate many things. When a
network is highly interconnected, fewer constraints exist for the individuals within it: they may be less
likely to rely on others as brokers of information, be in a better position to participate in activities, or be
closer to leaders and therefore able to exert more influence upon them.
5-85. A network with low interconnectivity may indicate that there are clear divisions within a network
(for example, along clan or political lines), or that the distribution of power or information is highly uneven
and tightly controlled. Comparing densities between enemy subgroups provides commanders with an
indication of which group is most capable of a coordinated attack and which group is the most difficult to
disrupt. Figure 5-14 shows three networks with different densities. Network B has the highest network
density; network C the lowest.
5-86. Most network measures, including network density, can be mapped out to evaluate performance over
time. Based on changes in network density over time, a commander can—
z
Monitor enemy capabilities.
z
Monitor the effects of recent operations.
z
Develop tactics to further fragment the insurgency.
5-22
ATP 2-33.4
18 August 2014

Core Army Analytic Techniques
Figure 5-14. Network density comparison
5-87. An increase in network density indicates the likelihood that the group can conduct coordinated
attacks. A decrease in network density means the group is reduced to fragmented or individual-level
attacks. A well-executed counterinsurgency eventually results in only low network-density subgroups. This
is because high network-density subgroups require only the capture of one highly connected member to
lead police or military forces to the rest of the group. Therefore, while high network-density groups are the
most dangerous, they are also the easiest to defeat and disrupt. Figure 5-15 is an example of how tactics and
activities can change based on network density.
Figure 5-15. Example to change in tactics based on density shifts
18 August 2014
ATP 2-33.4
5-23

Chapter 5
5-88. Network density does not consider how distributed the connections are between the nodes in a
network. Better metrics of group and organizational performance would be network centrality and core-
periphery. A few nodes with a high number of connections can push up the group network density, even
though the majority of the people nodes are only marginally linked to the group. In the case of a highly
centralized network dominated by one or a few very connected nodes, these nodes can be removed or
damaged to fragment the group further into sub-networks.
5-89. Sometimes a region may actually contain multiple subinsurgencies that are either unaware of, or even
competing with, other subgroups. In this case, the group resembles a fragmented network (see figure 5-16).
Figure 5-16. Fragmented network
Network Distance
5-90. Network distance measures the number of hops between any two nodes in a network. For example,
there is one hop between two nodes that are directly connected; there are two hops between nodes that are
separated by one intermediary node. Evaluating network distance aids in understanding how information
and influence flow through a network and determining a network’s cohesiveness. Larger distances can
inhibit the dissemination of information because each hop diminishes the probability of successful
interaction. In political, social, and possibly military networks, larger distances may also decrease the
ability of individuals to influence others.
SOCIOMETRICS OR SOCIAL NETWORK ANALYSIS
5-91. Social network analysis (SNA) is another tool for understanding the organizational dynamics of an
insurgency and/or terrorist network and how best to exploit it. It is the mathematical measuring of variables
related to the distance between nodes and the types of associations in order to derive meaning from the
network diagram, especially about the degree and type of influence one node has on another. SNA—
z
Allows analysts to identify and portray the details of a network structure.
z
Shows how a networked organization behaves and how that connectivity affects its behavior.
z
Allows analysts to assess the network’s design, how its member may or may not act
autonomously, where the leadership resides or how it is distributed among members, and how
hierarchical dynamics may mix or not mix with network dynamics.
z
Is most effective when employing a specialized software application. The basic processes and
measures can be conducted, however, using centrality and network density and distance detailed
above.
5-24
ATP 2-33.4
18 August 2014
Core Army Analytic Techniques
z
Differs from network analysis in that it focuses on the individual and interpersonal relations
within the network.
z
Supports a commander’s requirement to describe, estimate, and predict the dynamic structure of
an enemy organization.
z
Provides commanders a useful tool to gauge their operations’ effectiveness.
z
Allows analysts to assess the insurgency’s adaptation to operational environments and friendly
operations.
5-92. Analyzing the social networks of an individual includes identifying family members and looking at
relationships both inside and outside the organization (for example, other network members, local leaders
not in the organization, police contacts, sympathizers, or facilitators). Used in parallel with pattern analysis,
SNA allows linking of the WHO to the WHERE and WHEN. Using the organizational model, we can
apply SNA to build a picture of WHO in the area is involved, HOW they are involved, and WHAT their
part is in the network.
5-93. Analysts use SNA to assess organizational behavior based on links between individuals and systems
within the decisionmaking context of the organization. It can be applied to all facets of the organization or
network, including but not limited to support mechanisms, information operations, political aspects, violent
activities, and logistics operations in order to better understand the function of the organization or network.
5-94. SNA allows analysts to identify individuals and/or systems that drive networks and to identify
vulnerabilities within these systems. Analysts can then understand how to most effectively reinforce or
destabilize systems within a network or organization.
5-95. As an example, an analyst can apply SNA to the logistical support activities of a network and
determine that a particular criminal enterprise was necessary for the operation of the logistics system. The
analyst may also determine that a particular individual drove the decisionmaking within a logistics cell.
Once identified, these vulnerabilities can be targeted.
5-96. Additionally, SNA assists in the targeting process by identifying individuals, such as family
members and community contacts, for potential targeting to locate the high-value individual (HVI). For
example, if the location or phone number of the HVI is unknown, but the analyst knows the location and
phone number of the HVI’s spouse or known business contact, these social contacts of the HVI can be
targeted in order to identify the unknown location and number. The targeting of the HVI’s social network
can provide intelligence in identifying and locating the HVI themselves.
5-97. Social networks may be an important aspect of a social structure as well as within the enemy
organization. Common types of networks include elite networks, prison networks, worldwide ethnic and
religious communities, and neighborhood networks. Networks can have many purposes, such as economic,
criminal, and emotional. Effective SNA considers the structure of a network and the nature of interactions
between network members.
5-98. Leaders should strive to cultivate relationships with social node influencers. Social nodes in present
and future theaters of operation might include tribal, religious, civic, and other leaders. Leaders should seek
to develop and sustain personal relationships with these and other social nodes and cull their opinions on
policy and operations. For instance, contracts awarded to one tribe may enflame resentment of another that
may then fuel insurgent or criminal activity.
SECTION III - CONDUCTING PATTERN ANALYSIS
5-99. Conducting pattern analysis is an analytical technique that aids intelligence personnel in determining
possible enemy future actions when there is little or no near real-time information available concerning
enemy location, disposition, movement, or objectives. For example, conventional threats may use tactics
that mask them from collection assets in order to avoid detection. Unconventional forces may be largely
invisible to collection assets. When either of these is the case, intelligence personnel analyze how the
enemy has operated in the past to predict how the enemy may operate in the future. There are three basic
activities involved in conducting pattern analysis: determine what is known about the enemy, conduct a
pattern analysis of the enemy’s recent activity, and determine possible enemy actions. (See FM 2-01.3 for
more information on IPB.)
18 August 2014
ATP 2-33.4
5-25
Chapter 5
5-100. Conducting pattern analysis aids intelligence personnel in determining when, where, and what type
of enemy activity may occur in the future by determining when, where, and what type of enemy activity
occurred in the past. There are four basic activities associated with pattern analysis: chronologies are the
basic method of tracking events in time (including timelines and time event charts); plotting enemy activity
on a pattern analysis plot sheet; plotting enemy activity on an incident overlay; and conducting a pattern of
life analysis.
5-101. All four of these visualization aids are effective when conducting pattern analysis in order to
visualize patterns in time, space, and activity. All four are effective when analyzing conventional military
forces and unconventional, complex, adaptive threat networks. Through pattern analysis, intelligence
personnel may anticipate future enemy attacks and identify high-payoff targets. Pattern analysis can also be
used to refine assessments related to threat characteristics.
5-102. The following four pattern analysis tools may be used concurrently or separately, as the analyst
deems appropriate:
z
Chronologies.
Timelines.
Time event charts.
z
Pattern analysis plot sheet.
z
Incident overlay.
z
Pattern of life analysis.
CHRONOLOGIES
5-103. A chronology is a list placing events or actions into the order in which they occurred; a timeline is
a graphic depiction of those events. Both are used to identify trends or relationships between the events or
actions and, in the case of a timeline, between the events and actions as well as other events or actions in
the context of the overarching intelligence problem.
5-104. Analysts use two types of chronologies: timelines and time event charts. Timelines are a basic tool
to aid in organizing events or actions. Time event charts are visualization tools that may be manipulated to
aid in determining patterns. These techniques can be used whenever it is important to understand the timing
and sequence of relevant events as well as to identify key events and gaps. These events may have a cause-
and-effect relationship, or they may not.
TIMELINES
5-105. Timelines aid in the identification of patterns and correlations between events. The tool allows the
analyst to relate seemingly random events to the big picture to highlight or identify significant changes or
assist in the discovery of trends, developing issues, or anomalies.
Facts
5-106. Timelines are linear and are related to a single situation or COAs. Multiple-level timelines allow
analysts to track concurrent COAs that may have an impact on each other. While timelines may be
developed at the onset of an analytic task to ascertain the context of the activity to be analyzed, timelines
also may be used to assist analysts in postmortem intelligence studies to break down intelligence and find
the causes for intelligence failures and highlight significant events after an intelligence surprise. The
activities on a timeline also can lead the analyst to hypothesize that particular events occurred between
known events in order for them to flow correctly. The analyst can then be aware of indicators to look for so
the missing events are found and charted. Timelines organize information in a format that can be easily
understood in a briefing. This technique also can support the use of other structured analytic methods, such
as event trees and techniques, for analyzing complex networks and associations.
5-107. The analyst must be careful not to assume that events following earlier events are caused by the
earlier events; there may be no causal relationship involved. The value of this tool can be reduced if the
analyst using it lacks creativity in finding contextual events that relate to the information in the chronology
5-26
ATP 2-33.4
18 August 2014

Core Army Analytic Techniques
or timeline. The analyst must consider factors that may influence the timing; for example, the chronological
time of attacks may vary by several hours, but be driven by the lunar cycle (moonset), religious events, or
friendly patrol patterns. Figure 5-17 shows a simple timeline.
Figure 5-17. Timeline example
The Method
5-108. Creating a chronology, or timeline, involves three steps:
z
Step 1. As you research the problem, ensure the relevant information is listed with the date or
order in which it occurred. Analysts should ensure they properly reference the data.
z
Step 2. Review the chronology, or timeline, by asking the following questions:
What are the temporal distances between key events? If lengthy, what caused the delay?
Are there missing pieces of data that may fill those gaps that should be collected?
Did the analyst overlook pieces of intelligence information that may have had an impact on
the events?
Conversely, if events seem to happen more rapidly than expected, is it possible that the
analyst has information related to multiple event timelines?
Are all critical events necessary and shown for the outcome to occur?
What are the intelligence gaps?
What are the vulnerabilities in the timeline for collection activities?
What events outside this timeline could have influenced the activities?
z
Step 3. If preparing a timeline, summarize the data along a line, usually horizontal or vertical.
The sides of the line can be used to distinguish between types of data. If more than one person is
involved, multiple lines can be used, showing how and where they converge.
5-109. The following can assist when using this technique:
z
Consider chronologies and timelines; they are effective, yet simple, ways for analysts to order
incoming information on a daily basis as they go through their daily message traffic.
z
Use tools such as Excel (drawing function) or Analyst Notebook to draw the timeline.
TIME EVENT CHART
5-110. A time event chart is a method for visualizing individual or group actions chronologically. They
are designed to store and display large amounts of information in a small space. Analysts can use time
event charts to help analyze larger scale patterns of such things as activities and relationships. It uses
symbols to represent events, dates, and the flow of time. Triangles are used to depict the beginning or end
of the chart. Rectangles are used to store administrative data and indicate events or activities. An “X”
through an event highlights a significant event or activity. Each event (rectangle) contains a sequence
number and date. An incident description is written below the event symbol providing a brief explanation
of the event.
18 August 2014
ATP 2-33.4
5-27

Chapter 5
Facts
5-111. Figure 5-18 is an example of a time event chart. In this example, two months after being
organized, members of a group received demolitions training to include a substantial amount of money
from drug smugglers. Three weeks later three members (narcotics traffickers) drove to Kabul and four-to-
five days after their arrival, there was a bombing at the Kabul Airport for which they claimed
responsibility. Several months later, four members drove to Kandahar and shortly afterwards (four days)
another bombing occurred, this time at police headquarters.
Figure 5-18. Time event chart example
5-112. Using the information from this example intelligence personnel can determine several details
regarding future attacks:
z
The group operates in teams of three-to-four personnel.
z
Seven members of the group received demolitions training in Pakistan, giving the team an
operational capability of conducting multiple attacks.
z
Attacks occur 4 to 5 days after a team arrives at a target area. This delay is likely to allow the
team to reconnoiter both the target and target area.
z
The pattern indicates the group will conduct an attack in Herat on 21 or 22 January 2015.
The Method
5-113. There is great latitude in preparing time event charts. The methodology is the same as chronologies
and timelines, with the following specific techniques employed for time event charts:
z
The beginning of the chart is shown with triangles.
z
Other events are shown with squares.
z
Noteworthy events have an X drawn across the square.
z
The date is always on the symbol.
z
A description is below the symbol.
z
The flow is from left to right for each row.
PATTERN ANALYSIS PLOT SHEET
5-114. The pattern analysis plot sheet, as shown in figure 5-19, depicts patterns in time and activity. It
aids intelligence personnel in identifying when the threat tends to conduct specific types of activities. The
pattern analysis plot sheet is a circular matrix and a calendar. The matrix is divided into sections based on
time; generally divided by hour and subdivided into concentric rings that identify days.
5-28
ATP 2-33.4
18 August 2014

Core Army Analytic Techniques
Figure 5-19. Pattern analysis plot sheet example
FACTS
5-115. In the example shown in figure 5-19, six enemy ambushes occurred in the first part of the month
between 1800 and 1900. However, later in the month, two ambushes occurred between 1900 and 2000.
This could indicate a shift in threat tactics, techniques, and procedures. Further analysis is needed to
determine if that is correct. For example, a change in friendly operations may be the cause for the shift. The
pattern analysis plot sheet is an effective tool in visualizing timeframes and types of enemy activity, but it
must be used in conjunction with other intelligence to aid logical conclusions.
18 August 2014
ATP 2-33.4
5-29

Chapter 5
THE METHOD
5-116. There is some latitude in preparing pattern analysis plot sheets. The methodology is the same as
chronologies and timelines, with the following specific techniques employed for the pattern analysis plot
wheel:
z
Different symbols are used for each type of incident. All symbols are tracked in a legend.
z
All incidents are marked on the time-wheel matrix and the calendar.
z
Noteworthy events may be annotated with footnotes. If the analyst uses this method, the symbol
must be marked on both the time-wheel matrix and the calendar; the footnote is then described
separately below the calendar or in a location near the pattern analysis plot sheet.
INCIDENT OVERLAY
5-117. Incident overlays, as shown in figure 5-20, are similar to the situation map. It displays activities
spatially. It is useful in visualizing spatial patterns; however, it does not provide visual representation of
temporal patterns. Just as the situation map cannot stand alone without further intelligence products or
written reports to fill in the details, the incident overlay can only illustrate on a map or image what and
where an event took place. It is critical to include a legend on the incident overlay and a time period
covered.
Figure 5-20. Incident overlay example
FACTS
5-118. The incident overlay is constructed by plotting specific activities on the map using appropriate
symbols. Counterinsurgency and other stability-dominated environments may require using many
unfamiliar symbols, so it is critical to have a legend in the margin of the map. Symbols listed in
ADRP 1-02 should be used as much as possible. Maps can either be imagery or standard military maps.
Use whichever map the commander prefers. Incident overlays are excellent briefing tools to update the
enemy situation within a unit’s AO.
5-30
ATP 2-33.4
18 August 2014
Core Army Analytic Techniques
THE METHOD
5-119. Creating an incident overlay involved three steps:
z
Step 1. Select the type of incidents to display. The overlay may be used to display a particular
type of incident, incidents by a particular cell, or other incidents at the analyst’s discretion. As
you research the problem, ensure the relevant information is listed with the date or order in
which it occurred. Make sure the data are properly referenced.
z
Step 2. Plot the incidents on an overlay to show activity spatially. The analyst examines the
incident overlay asking the following questions at a minimum:
What are the spatial distances between events? How near are the events? If spatially close,
what terrain or circumstances may have caused the grouping? Are there missing pieces of
data that may fill those gaps that should be collected?
Did the analyst overlook pieces of intelligence information that may have affected the events?
Conversely, if events seem to happen more spatially distant from one another, is there a reason for
the remoteness? Is it possible that the analyst has information related to multiple groups or cells?
What are the intelligence gaps? Are there changes in tactics, techniques, or procedures
spatially apparent on the incident overlay?
What are the vulnerabilities in the incident overlay for collection activities?
What events outside this overlay could have influenced the activities?
z
Step 3. Display multiple incident overlays, using color coding of specific events or cells.
Analyze the multiple incident overlays for any patterns, asking the same questions as above.
Summarize the data in the incident overlay.
PATTERN OF LIFE ANALYSIS
5-120. Pattern of life analysis is a focused analysis ofwhere and when a target has been with the intent to
predict where the target will be. This analysis aids operational planning directly. Pattern of life analysis
uses network diagrams and timelines to display a target’s historical movement patterns in time and space.
FACTS
5-121. Pattern of life analysis should be as in-depth as possible. It should include potential refuge
locations, work locations, travel patterns, known vehicles, and social activities. Pattern of life factors can
and should be developed from as many sources as possible. This will require routine contact with local
operational management teams, human intelligence collection teams, and the supporting SIGINT section.
Higher echelon collection assets are also used to corroborate the patterns of life.
5-122. Used in concert with network analysis and/or link analysis, pattern of life analysis is useful in the
targeting process to determine the location the HVI will be at, and when the HVI will be there. For
example, if the analyst identifies that an HVI visits a particular restaurant, the location can be monitored as
an anticipated future location of the HVI for time-sensitive targeting.
THE METHOD
5-123. Pattern of life analysis is a combination of multiple techniques:
z
Step 1. Select pattern analysis tools to be used and focus on the target as you construct it.
z
Step 2. Construct a pattern of life network diagram, visually linking events, people, objects, and places
in time and space to the target. The diagram is constructed so the flow of events is from left to right.
z
Step 3. Review the pattern of life network diagram and pattern analysis tools; analyze the target
to determine any patterns that may predict future events or places where the target may be. Ask
the following questions at a minimum:
What are the temporal distances between key events? If lengthy, what caused the delay?
Are there missing pieces of data that may fill those gaps that should be collected?
Did the analyst overlook pieces of intelligence information that may have had an impact on
the events?
18 August 2014
ATP 2-33.4
5-31
Chapter 5
Conversely, if events seem to happen more rapidly than expected, is it possible that the
analyst has information related to multiple targets?
Are certain critical events necessary for the predicted location of the target to occur?
What are the intelligence gaps? What collection may fill those gaps?
What are the vulnerabilities in the target’s timeline for collection activities?
What events outside this timeline could have influenced the activities?
5-32
ATP 2-33.4
18 August 2014
PART THREE
Considerations for Decisive Action and Unique
Missions
Chapter 6
Analytic Support to Decisive Action
This chapter describes the analytical support to decisive action. It addresses the
analytical support process to offensive, defensive, stability, and DSCA operations.
The analytical techniques used in decisive action are also discussed. Additionally,
analytical support to unique operations, including building partnership capacity,
protection, and synchronizing information-related capabilities, are addressed.
OVERVIEW
6-1. The overarching concept that directs the Army is unified land operations. ADP 3-0 establishes the
principles of unified land operations and discusses how the Army seizes, retains, and exploits the initiative
through simultaneous offensive, defensive, and stability tasks. The analytical process does not drastically
differ whether in the offense, defense, or stability tasks. The difference lies in the tempo in which offensive
and defensive tasks are conducted versus the tempo in which stability tasks are conducted.
ANALYTIC SUPPORT TO UNIFIED LAND OPERATIONS
6-2. In offensive and defensive tasks, the actions that occur within the operations process and
commander’s decisionmaking are accelerated to match the quickly changing conditions within the AO. In
stability tasks, success is measured in far different terms from offense and defense. Time may be the
ultimate arbiter of success: time to bring safety and security to an embattled populace; time to provide for
the essential, immediate humanitarian needs of the people; time to restore basic public order and a
semblance of normalcy to life; and time to rebuild the institutions of government and market economy that
provide the foundations for enduring peace and stability. Regardless of the type of operation, all-source
intelligence is the primary capability within the intelligence warfighting function that aids commanders
understanding of their operational environment.
ANALYTIC SUPPORT TO OFFENSIVE OPERATIONS
6-3. An offensive task is a task conducted to defeat or destroy enemy forces and seize terrain, resources,
and population centers (ADRP 3-0). The overall purpose of offensive operations is to defeat, destroy, or
neutralize the enemy force. A commander may also conduct offensive operations to deprive the enemy of
resources, seize decisive terrain, deceive or divert the enemy, develop intelligence, or hold an enemy in
position. (See ADRP 3-90.)
6-4. The principal difference between offensive and defensive or stability operations is the focus and
degree of detail of analysis required for determining the enemy’s defensive framework and the effects of
18 August 2014
ATP 2-33.4
6-1