PowerWorld Simulator version 11. Manual - page 6
Edit Mode Tools and Options
Set Selected Field
The Set Selected Field option is an often unused featured in Simulator, but can at times prove very useful. Each
object in Simulator has a property called Selected, which does nothing in Simulator other than allow the user to
choose a specialized set of objects for some other purpose, such as advanced filtering a display. The user can add a
column to most types of case information displays which shows the value of the Selected property for the type of
object being observed. By default, this field is always set to No. However, the user can change the value of this field,
and then sort the column, filter the display, or any other action that can normally be performed on a column of a
Yes/No type.
In addition to modifying the Selected property manually in a case information display, it is also possible to define a
group of buses' Selected property by defining a network cut on the system. Choosing the Set Selected Field option
from the Case Information menu will open the network cut dialog automatically for setting the Selected property of a
group of objects according to a desired cut plane chosen.
185
Network Cut
The Network Cut tool is another method for choosing sets of buses for such features as Scaling or Equivalencing.
The use of the network cut method is to define a set of branches as the "cut" plane, then choose a bus on one side or
the other of the cut to indicate which side of the cut you are interested in. The network cut dialog provides the
functionality necessary for defining the network cut.
Defining Network Cut
The first step in defining the network cut is to choose the branches which define the cut plane in the system. The
one caution is to be sure you select a closed loop cut plane. In other words, you must select a set of branches
which completely topologically separates two portions of the system. If you only choose a partial cut plane, which
does not completely cut the system in two distinct pieces, then attempted use of the ill-defined cut plane will fail.
To choose the branches which define the cut plane, simply highlight the branches by clicking on them in the list.
For each branch you highlight, you must click on arrow button (pointing to the box on the right) to add the branch to
your cut plane definition. You can make use of the control (Ctrl) and shift keys to select multiple branches at one
time in the list of branches. Note that you can also select a cut plane similarly using interfaces or DC lines.
Once you have the branches (or interfaces or DC lines) selected which form the cut plane, you then need to choose
a bus on either side of the cut plane to indicate which side you are interested in. The bottom panel on the display
allows you to locate and select this bus.
Require Paths to be Energized
This option can be checked if the branches forming a network cut should be energized to be included.
Include How Many Tiers of Neighbors
Once the network cut has been defined by a set of branches and the bus defining which side of the cut is being
examined has been chosen, this option will then include buses within so many tiers of the network cut
boundary, on the opposite side of the cut as the specified bus. If the number of tiers is set to zero, then the
buses examined will only be those on the same side of the cut as the bus selected.
Setting the Field
Once the network cut has been defined and the side of the cut to be examined has been chosen, the appropriate
field for each bus in the area of interest can be set. If the network cut is for the equivalencing tool, then the field to
set is the Which System property, which defines if a bus is in the external or study system when creating an
equivalent. If the network cut is for the scaling tool, then the field to set is the Scale property, which defines if a bus
is to be included in a scaling action.
Filter by KV
The buses within the network cut can be filtered by nominal voltage level before the field(s) are set. Only buses
that are within the network cut and are within the nominal KV level specified will have their fields set to the
desired value.
Use Area/Zone Filters
The buses within the network cut can be filtered by the area or zone in which they are contained before the
field(s) are set. Only buses that are within the network cut and whose area meets the defined Area/Zone filter
specified will have their fields set to the desired value.
186
Edit Mode Tools and Options
Browse Open Onelines
All the objects in all the open .pwd files can be listed in the Browse Oneline Environment dialog. To do so, go to
Options > Browse open onelines in Edit Mode or Run Mode. The power system objects are listed in the first 12
pages according to their type. For instance, all the buses and bus fields are listed in the Buses page while all the
generators and generator fields are listed in the Generators page. The Others page lists all the objects on the one-
lines which are not associated with power systems, e.g. background lines, texts, or graphs. The All page lists all the
objects in all the open onelines. The exceptions are areas, zones and super-areas are listed in the Others page
instead of their corresponding power system element pages. The default display columns for each grid page include
the oneline file name of the object and the type of the object. The first 12 pages also have default display columns of
the associated power system element type. The Others and All pages include the default display columns for generic
display objects.
The one-line displays can be panned to the selected object. To do so, select one object from the Browse Oneline
Environment dialog and right click to invoke the local popup menu. Click Pan oneline to object. This will bring the
one-line with the selected object to the front and pan to the selected object. When panning, the browsing dialog can be
kept on top if Keep browsing dialog on the top when choosing Pan Oneline to Object is checked. Otherwise, the
dialog will be sent to back when panning.
Note: Browse Oneline Environment dialog is for use in browsing only. To change information, go to the respective
Case Information Display.
187
Insertion Using Palettes
Palette Overview
The display object palettes are designed to help you lay out a new oneline diagram for a pre-existing power flow model
as quickly as possible. Display object palettes exist for Areas, Buses, Substations and Zones. Palettes list the display
objects that you have already added to the oneline, the display objects that have not yet been drawn that neighbor
those displayed objects, and the set of all display objects that have not yet been added to the drawing. By selecting
and dragging a display object name from either the Undrawn Neighbors list or the All Undrawn list to a location on
the oneline diagram where you would like that object to appear, you can add that display object to the drawing with
very little effort.
To see which elements neighboring a particular device are already on the oneline diagram and which are not, highlight
a device in either the Displayed or All Undisplayed list. The Displayed Neighbors and Undisplayed Neighbors
columns will list the corresponding neighboring devices for the selected device, allowing you to drag the undisplayed
neighbors to the diagram if you wish.
The display object palettes, in conjunction with the auto-insert capabilities of other devices, are especially useful for
adding a large region of an interconnection in relatively little time.
To display one of the four available palettes, select Insert > Show Insert Palette For from the main menu. To display
the palette with the focus set to an object already displayed, right-click on that object on the diagram and select ***
Palette (where *** is the name of the object type) from the popup menu.
188
Edit Mode Tools and Options
Using the Insert Palettes
The display object palettes are a tool designed to accelerate the building of a oneline diagram based on a pre-existing
power flow case. To display a palette, select Insert > Show Insert Palette for from the main menu.
The display object palettes feature the following controls:
Displayed
Lists those objects defined in the power flow case that have already been added to the oneline diagram. When you
click on an entry in the Displayed list, the contents of the Displayed Neighbors and Undrawn Neighbors lists will
be refreshed to identify all display objects that neighbor the display object you selected. Only the display objects
matching the type of Insert Palette opened will be shown in the list.
Double click on an entry in this list to pan to it so that the selected display object appears in the center of the
screen. If you are looking at the Insert Palette for Buses, you can right-click on an entry and choose either Quick
Power Flow List or Bus View Display to learn more about the selected bus.
Displayed Neighbors
Lists those objects defined in the power flow case that neighbor the display object selected in the Displayed list that
have already been drawn on the oneline diagram. You can make a "Displayed Neighbor" the selected "Displayed"
object by right-clicking on a display object in the Displayed Neighbor List and selecting Make Current Displayed
from the local menu. Only the display objects matching the type of Insert Palette opened will be shown in the list.
Undisplayed Neighbors
Lists those display objects defined in the power flow case that neighbor the object selected in the Displayed list that
have not yet been drawn. To add the undrawn display object to the oneline diagram, select its name with the left
mouse button and keep the left mouse button pressed as you move the mouse to the point on the oneline where
you would like to drop the object. When you let go of the left mouse button, the Information Dialog box for that
display object will appear. Use the Information Dialog to change display parameters for the object and click OK to
finish dropping the object onto the oneline. The display object you have just added will be appended to the end of
the Displayed list and will also be added to the History List so that you can identify its own undrawn neighbors
quickly. Only the display objects matching the type of Insert Palette opened will be shown in the list.
If you are looking at the Insert Palette for Buses, you can right-click on an entry and choose either Quick Power
Flow List or Bus View Display to learn more about the selected bus.
All Undisplayed
Lists those display object defined in the power flow case that have not yet been added to the oneline diagram,
regardless of whether the object neighbors a displayed object or not. This list functions identically to the
Undisplayed Neighbors List. To add the undrawn display object to the oneline diagram, select its name with the
left mouse button and keep the left mouse button pressed as you move the mouse to the point on the oneline where
you would like to drop the object. When you let go of the left mouse button, the Information Dialog box for that
display object will appear. Use the Information Dialog to change display parameters for the object and click OK to
finish dropping the object onto the oneline. The display object you have just added will be appended to the end of
the Displayed list and will also be added to the History List so that you can identify its undrawn neighbors quickly.
Only the display objects matching the type of Insert Palette opened will be shown in the list.
If you are looking at the Insert Palette for Buses, you can right-click on an entry and choose either Quick Power
Flow List or Bus View Display to learn more about the selected bus.
History List
Identifies the display objects you have added to the oneline diagram using the insert palettes since the last time you
opened the display object palette. Select a name from this list to display the undrawn neighbors of the
corresponding display object. Only the display objects matching the type of Insert Palette opened will be shown in
the list.
Define a Filter
The Define a Filter button opens the Advanced Filters dialog. This dialog allows you to customize which display
objects appear in the various lists. This can be helpful, for example, if you wish to add objects to the oneline that
reside only in particular areas, or if you don't want objects less than a certain voltage level to be listed.
When you click OK on the Advanced Filters dialog, the display object palette's lists will automatically be updated to
reflect the filter settings.
Click Close when you are done using the display object palette.
189
Automatic Object Insertion
Automatically Inserting Buses
Simulator can automatically insert buses on your oneline diagram if you have data regarding their spatial or
geographic location. To achieve this, go to the menu and choose Insert > Auto Insert > Buses. This opens the Auto
Insert Bus Dialog.
Note: Auto-insert buses is only for inserting bus objects on the diagram representing existing data. In other words,
you cannot use the auto-insert buses routine to add new buses to the load flow model. See topics on loading data
from auxiliary files or from Excel for creating new buses (or other objects) in an existing load flow case.
Insert by latitude, longitude
If you have stored latitude and longitude information with the Bus records in Simulator, you can use that information
to automatically insert the buses on a oneline diagram. Select the option on the dialog for finding bus locations
based on latitude, longitude information stored with the data records. When selected, the Map Projection option
will become enabled. Choose what type of projection you would like to be used for placing the buses on the
diagram.
Insert by locations specified in a file
You must first specify the file which contains the location data. You must also specify whether the file contains x,y
coordinates, or if you are drawing a map of the United States, you can use longitude, latitude coordinates. The
format of the location data text file is as follows:
The first line of this text file is ignored by Simulator. The following lines consist of three numbers: Bus Number, X
location, and Y location. If you are reading longitude, latitude for the United States, then X signifies longitude and
Y signifies latitude.
Num, X Location, Y Location
1,
24001.46,
19715.15
3,
24001.46,
19715.15
16,
24130.91,
19638.99
17,
24007.31,
19093.09
21,
23649.27,
18439.07
22,
23649.27,
18439.07
etc...
Simulator will place the buses on the oneline diagram at the X, Y locations given. If you specified that the file
contained latitude, longitude information, then select the Map Projection you would like to be used when converting
the latitude, longitude values from the file. The buses will be drawn according to default bus object information
defined in the Default Drawing Values for New Objects dialog.
If you would like Simulator to automatically insert transmission lines after completing the auto insertion of your buses,
check the box. Transmission lines and transformers will be automatically drawn based on the Line/XFMR default
options defined in the Default Drawing Values for New Objects dialog.
Clicking the OK button will instruct Simulator to continue by placing the buses according to the specified settings on
the dialog. Click Cancel to exit the process without inserting the buses.
190
Edit Mode Tools and Options
Automatically Inserting Transmission Lines
The Automatic Insertion of Lines/Transformers Dialog is used to automatically draw transmission lines and
transformers on the oneline diagram between existing bus display objects. Only branches that are already defined in
the power flow case can be added automatically; if you need to define a brand new branch, see Transmission Line
Display Objects. Thus, this option is useful only when you are starting with an existing power flow case, not building a
case from scratch.
To insert lines and transformers automatically, you must first have drawn the buses for each end of the device.
Simulator then draws the branch display objects connecting the buses for each transmission line/transformer in the
power flow case not already shown on the oneline.
To display the dialog, in the Edit Mode select Insert > Auto Insert > Lines from the main menu.
The dialog has the following options:
Minimum kV Level
Simulator will automatically draw line and transformer display objects between terminals whose nominal voltages
meet or exceed the minimum kV level specified in this field. For a branch object to be drawn, either one of its
terminals must satisfy this criterion. This option is useful for suppressing the automatic addition of generator step-
up transformers if that kind of detail is not warranted.
Default Drawing Values
This button opens the Default Drawing Values Dialog. Options such as the automatic insertion of transmission line
stubs, text fields, circuit breakers, and pie charts are specified in the Default Drawing Values Dialog.
Insert Text Fields
If this box is checked, the text fields defined in the original oneline will be displayed.
Insert Equivalenced Objects
If this option is checked, equivalenced objects modeled as lines will also be automatically inserted with the real
transmission lines.
Use Only Selected Buses
Instead of having Simulator automatically insert line and transformer display objects throughout the oneline
diagram, you can force it to insert the new objects only between the bus display objects that are currently selected.
This option is enabled only when two or more bus display objects are currently selected on the oneline.
Insert Pie Chart for Lines with No Limit and Bus Ties
If this option is checked, Simulator will add pie chart objects to the lines that have no given limit or are bus ties as
they are auto-inserted. Typically if a line is a bus tie or has no given limit, it is meaningless to include a pie chart on
the element, since no relevant information about the transmission element can be gained from the pie chart object.
Identifying Bus Ties
This area deals with lines used as ties between breakers. These lines are modeled as zero impedance
connections. The identification of a branch as a bus tie depends on the value specified as the Maximum P.U.
Impedance for Bus Ties. Branches with total P.U. impedance below this value will be considered bus ties when
auto-inserted.
In this area two choices are given for how to insert the bus tie breakers: Do not insert stubs for bus ties and Only
insert a single circuit breaker. The first choice allows you to decide if line stubs will be drawn when the tie
breaker is inserted. The second sets whether or not only one circuit breaker is inserted on the tie breaker. This
could be useful for determining real lines from bus tie breakers.
191
Automatically Inserting Generators
The Automatic Insertion of Generators Dialog is used to automatically draw generators on the oneline diagram on
existing bus -display objects. Only generators that are already defined in the power flow case can be added
automatically; if you need to define a new generator, see Generator Display Objects. Thus, this option is useful only
when you are starting with an existing power flow case, not building a case from scratch.
To insert generators automatically, you must first have drawn the terminal bus for each device. Simulator then draws
the generator display objects connected to the buses for each generator in the power flow case not already shown on
the oneline.
To display the dialog, in the Edit Mode select Insert > Auto Insert > Generators from the main menu.
The dialog has the following options:
Minimum kV Level
Simulator will automatically draw generator display objects at terminal buses whose nominal voltages meet or
exceed the minimum kV level specified in this field. For a generator object to be drawn, its terminal must satisfy this
criterion.
Default Drawing Values
This button opens the Default Drawing Values Dialog. Options such as the automatic insertion of text fields are
specified in the Default Drawing Values Dialog.
Insert Text Fields
When this box is checked, the default fields associated with the generator will appear around the generator, such as
voltage, name, and/or MW.
Insert Equivalenced Objects
This field is not used when automatically inserting generators.
Use Only Selected Buses
Instead of having Simulator automatically insert generator display objects throughout the oneline diagram, you can
force it to insert the new objects only between the bus display objects that are currently selected. This option is
enabled only when two or more bus display objects are currently selected on the oneline.
192
Edit Mode Tools and Options
Automatically Inserting Loads
The Automatic Insertion of Loads Dialog is used to automatically draw loads on the oneline diagram on existing bus -
display objects. Only loads that are already defined in the power flow case can be added automatically; if you need to
define a brand new load, see Load Display Objects. Thus, this option is useful only when you are starting with an
existing power flow case, not building a case from scratch.
To insert loads automatically, you must first have drawn the terminal bus for each device. Simulator then draws the
load display objects connected to the buses for each load in the power flow case not already shown on the oneline.
To display the dialog, in the Edit Mode select Insert > Auto Insert > Loads from the main menu.
The dialog has the following options:
Minimum kV Level
Simulator will automatically draw load display objects at terminal buses whose nominal voltages meet or exceed the
minimum kV level specified in this field. For a load object to be drawn, its terminal must satisfy this criterion.
Default Dr awing Values
This button opens the Default Drawing Values Dialog. Options such as the automatic insertion of text fields are
specified in the Default Drawing Values Dialog.
Insert Text Fields
When this box is checked, the default fields associated with the load will appear with the loads, such as MVAR
and/or MW.
Insert Equivalenced Objects
If this option is checked, equivalenced objects modeled as loads will also be automatically inserted with the real
transmission lines.
Use Only Selected Buses
Instead of having Simulator automatically insert load display objects throughout the oneline diagram, you can force
it to insert the new objects only between the bus display objects that are currently selected. This option is enabled
only when two or more bus display objects are currently selected on the oneline.
193
Automatically Inserting Switched Shunts
The Automatic Insertion of Switched Shunts Dialog is used to automatically draw switched shunts on the oneline
diagram on existing bus-display objects. Only switched shunts that are already defined in the power flow case can be
added automatically; if you need to define a brand new switched shunt, see Switched Shunt Display Objects. Thus,
this option is useful only when you are starting with an existing power flow case, not building a case from scratch.
To insert switched shunts automatically, you must first have drawn the terminal bus for each device. Simulator then
draws the switched shunt display objects connected to the buses for each switched shunt in the power flow case not
already shown on the oneline.
To display the dialog, in the Edit Mode select Insert > Auto Insert > Switched Shunts from the main menu.
The dialog has the following options:
Minimum kV Level
Simulator will automatically draw switched shunt display objects at terminal buses whose nominal voltages meet or
exceed the minimum kV level specified in this field. For a switched shunt object to be drawn, its terminal must
satisfy this criterion.
Default Drawing Values
This button opens the Default Drawing Values Dialog. Options such as the automatic insertion of text fields are
specified in the Default Drawing Values Dialog.
Insert Text Fields
When this box is checked, the default fields associated with the switched shunt will appear around the generator,
such as nominal MVAR.
Use Only Selected Buses
Instead of having Simulator automatically insert switched shunt display objects throughout the oneline diagram, you
can force it to insert the new objects only at the bus display objects that are currently selected. This option is
enabled only when two or more bus display objects are currently selected on the oneline.
194
Edit Mode Tools and Options
Automatically Inserting Interface Display Objects
The Automatic Insertion of Interfaces Dialog is used to automatically insert interface objects on the oneline diagram
between existing area/zone display objects. Interface pie chart objects can also be inserted as part of this process.
The automatic insertion of interface display objects greatly accelerates the construction of interface diagrams, which
are particularly useful for animating the results of PTDF calculations. Only area-area and zone-zone interface records
can be displayed using interface display objects.
The following procedure describes the quickest way to create an interface diagram for showing PTDF information and
area-area or zone-zone flows. It steps through the process from the creation of area-area or zone-zone interface
records to the addition of the area or zone display objects and, finally, to the automatic insertion of interface display
objects.
· Select Case Information > Interfaces from the main menu to bring up the Interfaces Display.
· Right-click on the Interface Records Display to show its local menu. Select Auto Insert Interfaces from the local
menu. This generates the Auto-Insert Interfaces Dialog.
· Use the Auto-Insert Interfaces Dialog to create the area-area or zone-zone interface records automatically.
At this point, the interface records have been created automatically. We now want to generate an interface diagram,
with the interface display objects added to it automatically.
· On a oneline diagram (either an already open diagram or a brand new one created by choosing File > New Oneline
from the main menu), place area/ zone objects at the desired locations.
· Select Insert > Auto Insert > Interfaces to display this dialog.
· Check the Insert Pie Charts on Interfaces box to automatically insert interface pie chart objects when the
interfaces are inserted. If this option is selected, change the Default Size of Interface Pie Charts to specify their
size.
· Select OK to insert the new oneline objects. New interface objects are automatically inserted between any
area/zone objects that have a corresponding interface record that is not already represented.
Note that you can do this automatic insertion as often as you like. The Number of Interfaces Not Shown field
indicates how many interfaces still need to be added to the diagram to represent all defined area-area or zone-zone
interfaces. It is a read-only field.
195
Automatically Inserting Substations
Simulator can automatically insert substations on your oneline diagram if you have data regarding their spatial or
geographic location. To achieve this, go to the main menu and choose Insert > Auto Insert > Substation. This
opens the Auto Insert Substation Dialog.
Insert by latitude, longitude
If you have stored latitude and longitude information with the Substation records in Simulator, you can use that
information to automatically insert the substations on a oneline diagram. Select the option on the dialog for finding
substation locations based on latitude, longitude information stored with the data records. When selected, the Map
Projection option will become enabled. Choose what type of projection you would like to be used for placing the
substations on the diagram.
Insert by locations s pecified in a file
You must first specify the file which contains the location data. You must also specify whether the file contains x,y
coordinates, or if you are drawing a map of the United States, you can use longitude, latitude coordinates. The
format of the location data text file is as follows
The first line of this text file is ignored by Simulator. The following lines consist of three numbers: Substation
Number, X location, and Y location. If you are reading longitude, latitude for the United States, then X signifies
longitude and Y signifies latitude.
Num, X Location, Y Location
1,
24001.46,
19715.15
3,
24001.46,
19715.15
16,
24130.91,
19638.99
17,
24007.31,
19093.09
21,
23649.27,
18439.07
22,
23649.27,
18439.07
etc...
Simulator will place the substations on the oneline diagram at the X, Y locations. If you specified that the file
contained latitude, longitude information, then select the Map Projection you would like to be used when converting
the latitude, longitude values from the file. The substations will be drawn according to default substations object
information defined in the Default Drawing Values for New Objects dialog.
Finally, if you would like Simulator to automatically insert transmission lines after completing the auto insertion of your
substations, check this box. Transmission lines and transformers will be automatically drawn based on the Line/XFMR
default options defined in the Default Drawing Values for New Objects dialog.
Clicking the OK button wll instruct Simulator to continue by placing the substations according to the specified settings
on the dialog. Click Cancel to exit the process without inserting the substations.
196
Edit Mode Tools and Options
Automatically Inserting Borders
PowerWorld Simulator allows you to automatically insert geographic borders, which PowerWorld Corporation has
drawn. These include the states in the United States of America and several International Borders as well. You may
also define a border in a text file and insert this User-Defined border.
To bring up the Auto Insert Borders Dialog, go to the menu and choose Insert > Auto Insert > Borders. This dialog
has several tabs described below:
Options
The Options tab allows you to set characteristics of the border lines when they are inserted on the oneline diagram.
All of these options are available from the Format menu in Edit mode, and can be changed for a border by selecting
the border(s) in Edit mode and then selecting the appropriate option from the Format menu to change the desired
option(s).
Make border lines immobile
This option is very useful for preventing you from inadvertently moving the border lines in Edit mode once they have
been placed.
Line Options
Choose the line thickness and line color for the border lines.
Fill Options
Choose the fill options if you wish to "fill in" the border regions with a background fill color.
Stack Level
Choose the stack level for the border lines. The stack level affects which objects appear "over" or "under" other
objects on the diagram. Typically background lines are either placed in the Background or Base levels, so that they
appear beneath power system objects on the diagram. Further we would recommend that if you are using
background fill colors for the borders that you choose a stack level of Base. The only difference between the
Background and Base levels is that the Base level objects can be right-clicked on in run mode and allows the
default diagram popup menu to appear. Right-clicking on Background level objects in run mode will not display the
default popup menu.
Layers
When Borders are automatically inserted on a diagram using this tool, a "Borders" screen layer will be added to the
layer drop-down box, if a "Borders" layer does not already exist for the oneline diagram. You can choose to leave
the borders in the standard "Default" layer, to place the borders in the new "Borders" layer, or you can create a new
custom layer by clicking the Define Layers button. If no default borders layer has been previously established
(borders were previously inserted on the oneline), the "Borders" layer or selected user created layer will be set as
the default Borders layer. The default Borders layer is different than the standard "Default" layer for objects. The
default Borders layer information is stored in the system registry, and is only used to recall which layer Borders
were assigned to the previous time borders were automatically inserted.
Apply Default Drawing Values
Click this button to apply the Background line settings from the Default Drawing Values.
United States
This tab allows you to select states in the United States that you want to insert. (Note: to select several states to insert
at once, use the Ctrl and Shift keys w hile clicking with your mouse.) These states will be placed on the screen such
that as you add new states they will be placed geographically appropriately.
Once you have selected the states you want to insert, Click OK.
International
This tab allows to insert several borders which PowerWorld Corporation has drawn recently. Note: if you have drawn
a oneline which contains a geographic border you would like us to include in future version of Simulator, please
contact us at supportpowerworld.com and we'll add it to our next release.
User-Defined Borders
This tab allows you to read in a border from a text file that you create. The first row of this text file is a comment row
and is ignored when reading it in. After this it reads in the description of each background line. This description starts
197
with the number of points in the line followed by a list of x, y coordinates. The file ends when the number of points for
a line is read as -1. An example file follows:
Comment row
5
59, 60
10, 20
40.3, 95.20
89.3, 22.11
79.5, 34.56
45
40, 66
etc…
-1 this signifies the end of the file
198
Edit Mode Tools and Options
Equivalencing
Equivalents
An equivalent power system is a power system model of smaller dimension than the original system that approximates
the behavior of the original system reasonably well. In reality, most power system models are actually an "equivalent"
of a much larger interconnected network. When performing power system studies, it may be desirable to reduce the
size of the system model even further so that it may be solved more quickly. You can build power system equivalents
in Simulator using the Equivalencing Display. To open the display, select Tools > Create Equivalent.
The most important part of constructing an equivalent is determining which buses should be explicitly retained in the
equivalent, and which buses should be equivalenced, or removed from the case. Several definitions are useful here:
Study System
The buses that are to be retained.
External System
The buses that are to be equivalenced.
Boundary Buses
Any buses in the study system that are connected to buses in the external system.
How well the equivalent system approximates the behavior of the original system depends upon which buses are
retained in the study system. Retaining more buses yields results that more closely match those of the original case,
but at the expense of greater computation time. The number of buses to retain in the study system depends upon how
the equivalenced system will be used. Building system equivalents is as much an art as it is a science, with few solid
rules of thumb. However, to improve accuracy, you should retain as many generator units as possible.
The actual equivalent is constructed by performing a matrix reduction on the bus admittance matrix. A result of this
process is the creation of "equivalent" transmission lines that join boundary buses equipped with equivalent shunts or
loads. Equivalent lines typically have a circuit identifier of ‘99’, but have also been seen to have other numerical
values between 90 and 99, or an alphanumeric identifier of 'EQ'. Since many of the equivalent lines created during the
matrix reduction have very high impedance values, an option is provided to ignore equivalent lines with impedances
exceeding a specified threshold value. Additionally, an option is provided to convert the equivalent shunts added at
the boundary buses to constant PQ loads. These PQ loads will be given circuit identifiers similar to those given to
equivalent transmission lines.
199
Equivalents Display
The Equivalents Display is used to construct equivalent systems. An Equivalent System is a system of smaller
dimension that exhibits similar power flow properties. Equivalent systems are constructed to help accelerate
computation time without sacrificing a significant amount of accuracy. For more information, please see Equivalents.
To bring up the Equivalencing Display, select Tools > Create Equivalent from the main menu in Edit Mode. This
display contains two pages, the Bus Selection Page and the Create Equivalent Page. Use the Bus Selection Page
to partition the power system into the study system and the external system. Use the Create Equivalent Page to
· Save the external system in a file
· Extract the external system
· Build an Equivalent
Each of these tasks is described below.
Bus Selection Page
To perform any of the tasks described on the Create Equivalent Page, you first need to specify the study system and
the external system. Do this by directly assigning buses to the desired system. The Bus Selection Page has been
designed to provide a number of powerful and complimentary ways of accomplishing this task.
The most important point to keep in mind when using this page is that membership in the study system and the
external system is on a bus -by-bus basis (as opposed to by areas or zones). Thus, each bus is either in the study
system or the equivalent system. Each bus’ current assignment is indicated in the Buses list, which is shown on the
bottom left corner of the page. The Buses list is a Case Information display and can be manipulated similar to other
displays. By default, all buses initially reside in the study system. Please see Bus Selection Page for more details.
Create Equivalent Page
The Create Equivalent Page allows you to save the external system in a file, to delete the external system, and to
build the power system equivalent.
Build Equivalent
This procedure constructs an equivalent system. For background on equivalents, please see Equivalents. The
following sections are all options for building an equivalent.
Delete All External Generators or Retain Generators with Max MW Ratings Above
If the Delete All External Generators checkbox is checked, the equivalencing routine will remove all external
generators from the case, regardless of their MW rating. Otherwise, the equivalencing routine will add to the
study system any generators originally in the external system whose real power output exceeds the specified
value. Retaining large generators often makes an equivalent significantly more accurate. If you do not wish to
retain any additional generators, check the Delete All External Generators checkbox.
Retain Remotely Regulated Buses
Some generators and transformers regulate buses other than their terminals. When this box is checked, these
remotely regulated buses are automatically included in the equivalent if the regulating generator or transformer
is included. If the box is not checked, the regulated bus is set to the terminal of the retained object. It is
strongly recommended that you leave this box checked at all times.
Retain Branch Terminals For
This section allows you to customize the retention of branch terminals for special-case types of branches. You
may choose to retain terminal buses for transformers, zero impedance ties, area tie lines, and/or zone tie lines.
Max Per Unit Impedance for Equivalent Lines
During the equivalencing process, a number of equivalent lines are created joining the boundary buses. All
equivalent lines with per unit impedance values above this threshold are ignored.
Two Character Circuit ID for New Equivalent Lines
Choose the circuit identifier to be used for the equivalent lines that are created. Typical circuit ID’s for
equivalent lines are 99 or EQ.
Remove External Objects from Onelines
This feature removes display objects associated with the external system from any open onelines.
Convert Equivalent Shunts to PQ Loads
During the equivalencing process, shunt elements are added at the boundary buses. Check this box if you
would like these equivalent shunts converted to constant PQ loads. If this option is checked, equivalent loads
are created with a load ID of ‘99’.
Remove Radial Systems
200
Edit Mode Tools and Options
Checking this option results in all radial connections in the network to be reduced to their nearest non-radial bus
(i.e. node.) The equivalencing routine will iteratively reduce the network when this option is checked, until no
more radial connections exist in the system.
Delete Empty Areas/Zones/Substations that occur from Equivalencing
Since equivalencing is a process which ultimately removes buses from the system, and Areas, Zones and
Substations are system devices which are groups of buses, this option will automatically remove the definition
of these types of objects when all buses within them are removed from the case during the creation of the
equivalent.
Select Build Equivalent System to construct the equivalent system. Constructing an equivalent system
permanently removes the external system from the case and adds a number of equivalent lines and shunts/loads.
Saving the External System in a File
This procedure allows an external system to be saved in a file without deleting the external system. This option is
useful for allowing you to save a portion of the system in a file, modify it using perhaps another program, and then
use Append Case to append the modified file to the original case.
When saving the external case, there are two options: 1) save just the external case, or 2) save the external case
and any ties to the original case. Option one just saves the external case, while option two s aves the external case
and any transmission lines or transformers that connect the external system to the rest of the system. Save just the
external case if you are planning to use the external case as a standalone case. Save the external case and its ties
if you are planning to modify the external case and then to append it back to the original case.
Click Save External System to save the external system in a file. You will be prompted for the desired case format
Deleting the External System
This procedure deletes the external system from the original case. All devices in the external system are removed,
including any buses and lines/transformers in the external system and any lines/transformers that join the external
system to the study system. Check the Remove External Objects from Onelines to remove any display objects
linked to the external system from the open onelines.
This command permanently removes the external system from the case; an equivalent system is not created.
Select Delete External System to actually delete the system.
201
System Scaling
Scaling
Use the Power System Scaling Dialog to scale the load, generation, or bus shunts uniformly for either the entire
case or a group of selected buses. This display allows you to scale any of the following values:
· Bus real power load
· Bus reactive power load
· Generator real power output
· Real component of the bus shunt admittance
· Capacitive component of the bus shunt admittance
· Reactive component of the bus shunt admittance
To display the Power System Scaling Dialog, select Tools > Scale Case from either Edit Mode or Run Mode. When
the dialog appears, you may begin to select the buses to be scaled. Buses can be selected individually or in a group
by areas or zones. In addition, if you already have specific groups of devices defined as an injection group, you can
choose to scale values associated with the injection group.
Scale by Bus
The button on the left labeled Bus enables selection of loads, generators and shunts by the bus the devices are
attached to. Selection of the buses can be done individually, by their area grouping, by their zone grouping, or by their
super area grouping.
The Buses Table lists the name and number of all buses in the system and whether or not each bus will participate in
the scaling. Similarly, the Areas, Zones, and Super Area tables list the names and numbers of all areas, zones or
super areas in the system and whether or not each area will participate in the scaling. Simulator initially assumes that
you wish to scale load, generation, or shunt compensation at all buses in the case. If you instead wish to scale only a
subset of the system, press the Set All To No button and begin to select the buses and areas to scale. The Power
System Scaling Dialog furnishes a number a ways to do this:
· Use the Add to be Scaled fields to enter either a range of areas and/or buses to scale.
· Use the Remove from Scaling fields to enter either a range of areas and/or buses to omit from the scaling.
· Define a Network Cut to choose a custom set of buses within a portion of the system to be scaled or omitted from
the scaling.
· Use the Buses, Areas, Zones and Super Areas tables to change the scaling status of individual buses. Simply
double-click on the Scale field for a bus, area, zone or super area to toggle its value.
· Click the Set All To Yes button to scale the entire case. Click the Set All To No button to remove the entire case
from scaling.
Changing the scaling for an area, zone or super area changes the scaling status for all buses in the grouping. For
example, to scale all the buses in a single area, first click Set All to No. Then, click on the Scale field for the desired
area in the Area Table. To scale all buses in an area except for a select few, repeat the above process, but then click
on the Scale field for the buses not to scale.
As you select the buses to be scaled, the fields in the Totals for Selected Buses are updated to indicate the total
load, generation, or shunt compensation that will be scaled.
Once you have selected the buses, you can either use the Scale By fields to enter a new scaling factor for each of the
quantities or use the New Value fields to specify a new value direc tly. If you do not wish to scale a particular type of
device, such as bus shunts, simply leave the Scale By field as unity.
To ensure that the reactive power is scaled proportionately to maintain the current load power factor, click the
Constant P/Q Ratio option. To enforce generator limits when scaling generation, check the Enforce Gen MW Limits
option. To scale generation and load to enforce ACE, check Scale Gen to Keep ACE Constant. When Simulator
scales generation, all generator power outputs at the selected buses are scaled by the specified factor, regardless of
area control. To scale only generators whose AGC field is set to YES only, check Scale Only AGCable Generation.
To scale both in-service and out-of-service loads, check Scale Out-Of-Service Loads .
Finally, click Do Scaling to scale the load, generation, or shunt compensation.
Scale by Area
The button on the left side of the dialog labeled Area enables the selection of loads, generators and shunts based on
the area designation of the devce itself. Loads, generators and shunts can have a different area designation than the
terminal bus the device is attached to. In these cases, it is sometimes necessary to use the Scale by Area option to
202
Edit Mode Tools and Options
choose only the devices that are designated within a certain area, instead of all devices at a particular bus.
To specify the devices within certain areas to be scaled, toggle the Scale property of the areas desired in the Areas
table, or use the Add to Scaling and Remove from Scaling fields to enter ranges of area numbers to be included or
excluded from the scaling.
Scale by Zone
The button on the left side of the dialog labeled Zone enables the selection of loads, generators and shunts based on
the zone designation of the device itself. This is identic al to the concept described immediately above in the
discussion on Scale by Area. As was the case with the area designation, loads, generators and shunts can have a
different zone designation than the terminal bus the devices are attached to.
To specify the devices within certain zones to be scaled, toggle the Scale property of the zones desired in the Areas
table, or use the Add to Scaling and Remove from Scaling fields to enter ranges of zone numbers to be included or
excluded from the scaling.
Scale by Injection Group
If injection groups have been defined for the case, you can scale the generation and load values for the injection group
by first clicking on the Injection Groups button. The Buses Table will be replaced with a new table listing the
Injection Groups in the case. To choose injection groups to scale, double-click the Scale field to toggle the value
between No and Yes. As Scale fields are toggled to Yes, the Generator and Load MW and Mvar fields will update to
display the totals for the selected injection groups. When all of the desired injection groups have been selected, either
the Scale By or the New Value fields can be modified for a desired new value for the selected injection groups.
To ensure that the reactive power is scaled proportionately to maintain the current load power factor, click the
Constant P/Q Ratio option. To enforce generator limits when scaling generation, check the Enforce Gen MW Limits
option. When Simulator scales generation, all generator power outputs at the selected buses are scaled by the
specified factor, regardless of area control.
Finally, click Do Scaling to scale the load and generation for the selected injection groups.
Scale by Owners
You can scale the generation and load values by ownership by first clicking on the Owners button. The Buses Table
will be replaced with a new table listing the Owners in the case. To choose owners to scale, double-click the Scale
field to toggle the value between No and Yes. As Scale fields are toggled to Yes, the Generator and Load MW and
Mvar fields will update to display the totals for the selected owner. When all of the desired owners have been
selected, either the Scale By or the New Value fields can be modified for a desired new value for the selected
owners.
To ensure that the reactive power is scaled proportionately to maintain the current load power factor, click the
Constant P/Q Ratio option. To enforce generator limits when scaling generation, check the Enforce Gen MW Limits
option. To scale generation and load to enforce ACE, check Scale Gen to Keep ACE Constant. When Simulator
scales generation, all generator power outputs at the selected buses are scaled by the specified factor, regardless of
area control. To scale only generators whose AGC field is set to YES only, check Scale Only AGCable Generation.
To scale both in-service and out-of-service loads, check Scale Out-Of-Service Loads .
Finally, click Do Scaling to scale the load and generation for the selected injection groups.
Note: When scaling generators with multiple owners, the scaling will be done on the entire output of these generators,
regardless of the fact that not all the owners have been set to scale. If this is not a desired behavior, you can define
multiple generators at the bus, each with 100% ownership.
203
Facility Analysis
Overview of Facility Analysis in PowerWorld Simulator
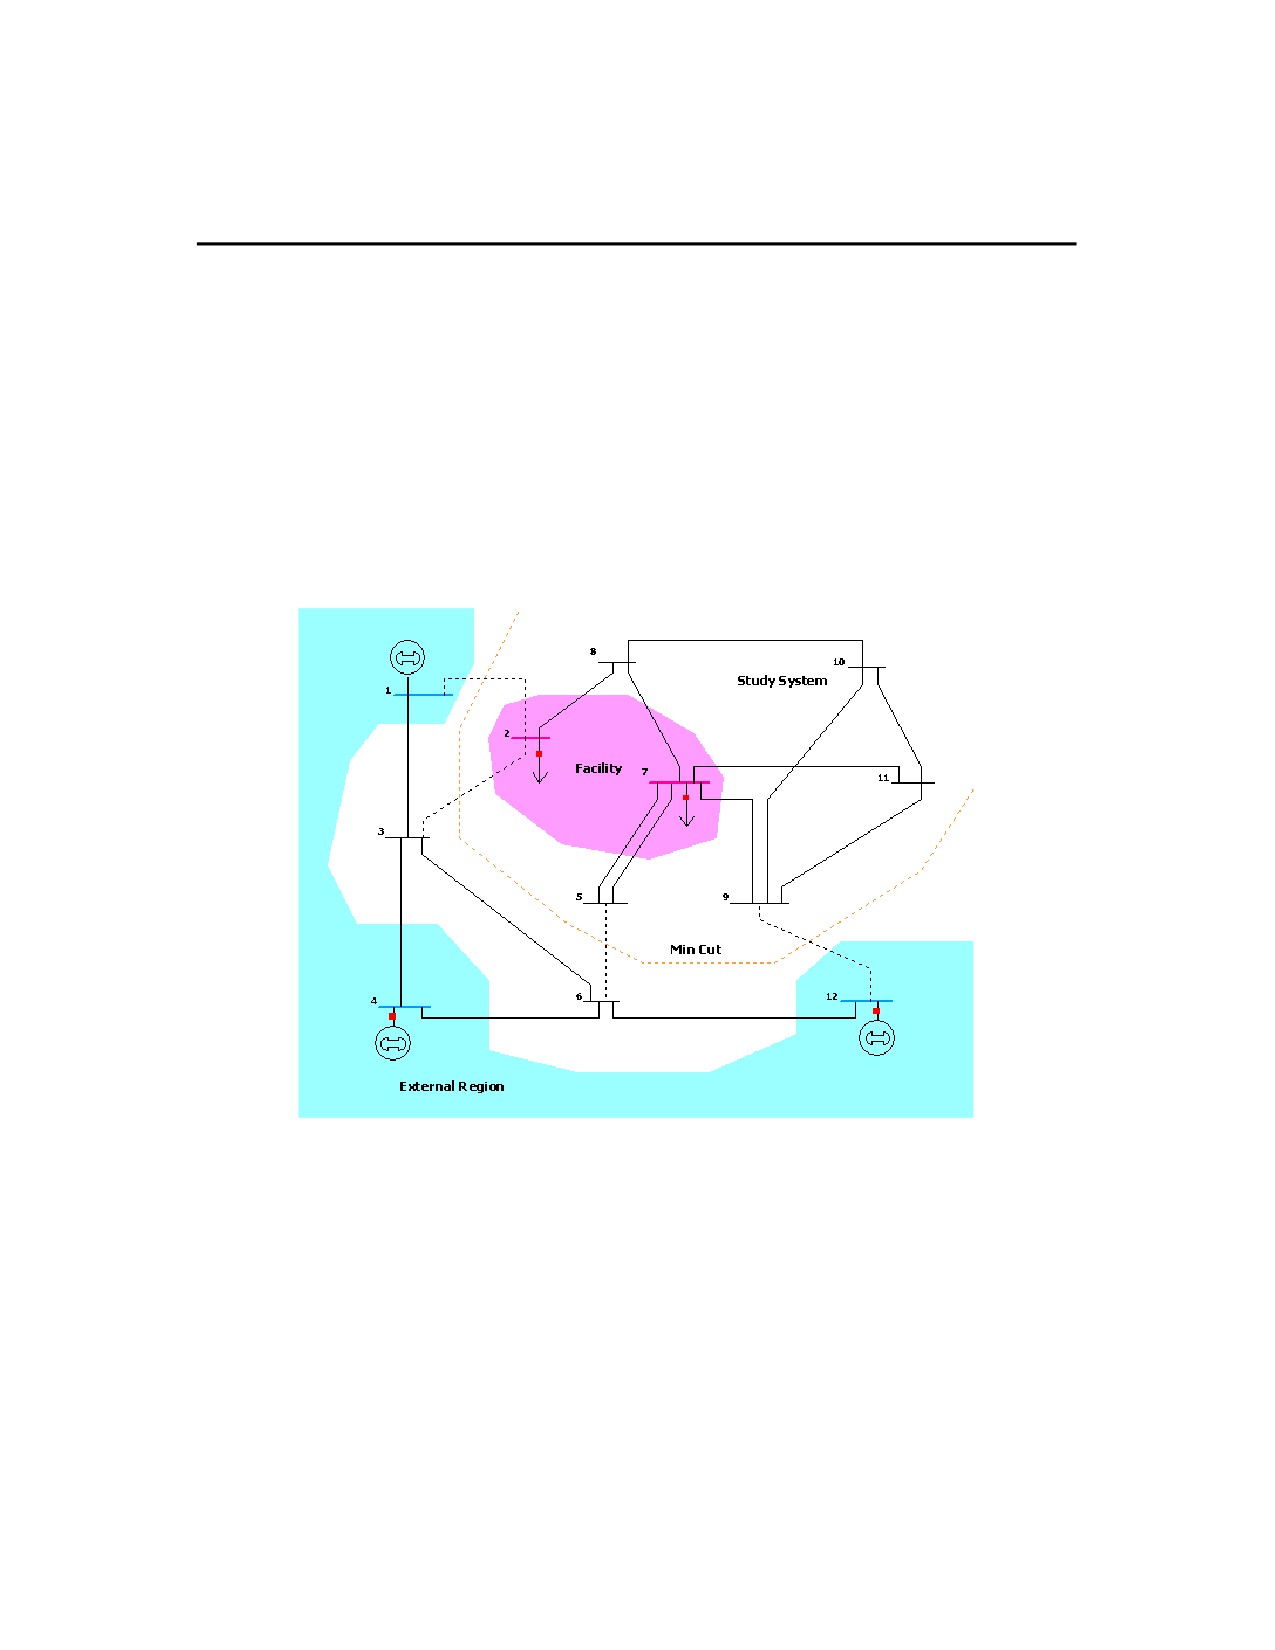
Facility Analysis is used to study the topological redundancy of interconnect specific electric facilities. This application
determines the minimum set of AC transmission lines and transformers that, when opened or removed from the
system, would electrically isolate a set of Facility buses from a set of External buses.
The tool is an application of the augmenting path max flow min cut algorithm with modifications to handle electric
networks.
The Facility analysis process has two steps:
1 The Select the Buses dialog is used to specify the External and Facility buses. Multiple selection of the External
buses can be done using any of the area or zone selectors. The Facility buses are specified by setting the selected
field of buses to YES.
2 The Facility Analysis dialog is used to determine the Min Cut and visualize the branches that belong to the min cut.
The Facility analysis application runs in edit mode and takes into consideration the open or closed status of the
branches. Open lines are considered as not present in the system. The Figure below illustrates the functionality of the
Facility Analysis tool.
204
Edit Mode Tools and Options
Facility Analysis Dialog
This dialog is used to determine the branches that would isolate the Facility from the External region as specified in
the Select the Buses dialog. When switching to the Facility Analysis page, the application builds a graph data structure
and reports information regarding the External Region and the Facility. The Facility Analysis tool is only av ailable in
Edit Mode, and can be opened from the menu Options / Tools > Network Topology > Facility Analysis .
Select the Buses
The options and use of this page are described in their entirety in the topic titled Bus Selection Page.
Facility Analysis
External Region
Is a set of buses from which the Facility would be isolated. Although the buses in the External region may not be
adjacent to each other, the algorithm will assume that any of these buses can supply electricity to the Facility and
thus the bus es in the External region are considered to be connected. The External region is defined using the
Select the Buses dialog.
External Region - Number of Buses
Indicates the number of buses in the External region. This number is equal to the number of buses in the system
that were labeled as External in the Select the Buses dialog. There should be at least one bus in the external
region.
External Region - Capacity
Indicates the number of branches that connect the external buses to study buses in the system. This is the outgoing
graph flow capacity from the External region toward the Facility.
Facility
Is the set of buses that constitute the Facility. Although the buses in the Facility may not be adjacent to each other,
the algorithm will assume that any of these buses may receive power from the External region, and thus the Facility
buses are considered to be connected to each other.
Facility - Number of Buses
Indicates the number of buses in the Facility. This number is equal to the number of buses in the system that were
labeled as Study and whose selected field is set to YES. There should be at least one bus in the Facility.
Note that if a bus was specified to be External and its selected field is YES, then the application will issue an error,
since Facility buses cannot be in the External region. In such cases the status will indicate that the graph structure
is incomplete.
Facility - Capacity
Indicates the number of branches that connect Facility buses with study buses. This number is equal to the
outgoing graph flow capacity from the Facility toward the External region.
Status
Shows the status of the Facility Analysis application. If the External region and the Facility are specified, the status
will indicate that the graph structure is ready. During execution of the Min Cut algorithm, the status shows the
number of the augmenting paths found so far and the number of branches in the current path.
Find Minimum Cut
Press this button to initiate the Min Cut algorithm. The button is inactive if the graph structure is incomplete, i.e.,
there is either no external bus or facility bus, or facility buses were found inside the External region.
Show Paths
Toggle this button to visualize the augmenting paths at the bottom of the form. The augmenting paths are listed in
the order in which they were found. Note that the first path has fewer nodes, since the algorithm uses a shortest
(least number of nodes) path routine. For each augmenting path the number of buses in the path, as well as the
corresponding bus numbers are listed in the dialog. This button is enabled only if a min cut has been found.
205
Augmenting Path Max Flow Min Cut Algorithm
The augmenting path max flow - min cut algorithm is used to identify the minimum number of branches that need to
be opened or removed from the system in order to isolate the Facility from the External region.
The algorithm is an application of the Max Flow - Min Cut theorem, which states that the maximum flow that can be
transferred from a set of source nodes to a set of sink nodes across a graph equals the capacity of the minimum cut.
The facility analysis in Simulator finds a min cut, although this cut may not be unique.
The application consists of three stages:
1 Convert the electric network to a graph structure
In this stage, each branch of the system is converted to an undirected arc with graph flow capacity equal to one.
Thus, only one unit of graph flow can be sent through a branch. The Facility buses and the External buses are
converted to Facility and External supernodes, respectively. This effectively reduces the problem to finding the min
cut between these two supernodes.
The number of nodes and capacities of the Facility and the External region are also computed during this stage.
2 Find the Max Flow using the Augmenting Path Algorithm
This is an iterative process. At each step, the algorithm finds a new augmenting path from the Facility to the
External region and augments the graph flow along this path in one unit. Consequently, the branches in the path
won’t be available for flow augmentation in the next step. Each new path is determined using a shortest path
routine.
The algorithm stops when no augmenting path from the Facility to the External region can be found. The number of
units transferred from the Facility to the External region (path augmentations) reaches the number of branches in a
certain cut. Note that the number of branches in the min cut can not exceed the capacity of either the Facility or the
External region.
3 Determine the branches in the min cut
The identification of the branches that constitute the min cut consists in tracking down labels in the buses and
branches used during each path augmentation.
206
Edit Mode Tools and Options
Graph Flow
Most network and graph theory applications use the concept of flow to represent any object that can be transported,
such as communication packets or trucks, but also connectivity properties of graphs. In the augmenting path max flow
min cut algorithm the flow is an artificial concept used to represent topological connectivity of buses. Two buses are
adjacent if flow can be sent from one to the other through a branch.
Graph Flow Capacity of a Branch
Networks that transport some flow are said to be capacitated if its arcs (here synonym of "branches") have some
limit associated to the flow transportation. For instance, capacity of a communication channel, or number of trucks
that can be simultaneously on a certain road. The algorithm used in the Facility Analysis assigns a capacity of one
to each branch. This means that the branch can be used only once for "connecting" two nodes.
Graph Flow Capacity of a Cut
The capacity of a topological cut is equal to the sum of the capacities of its arcs. In the Facility Analysis, the
capacity of the min cut is equal to the number of branches in the min cut, since each branch has a capacity of one.
207
Editing Oneline Diagrams
Chapter 6: Editing Oneline Diagrams
The Format Menu is used in the Edit Mode to customize the appearance of the oneline diagrams.
This chapter covers the following:
· Editing Overview
· Selecting Objects
· Changing Basic Display Object Properties
· Delete, Copy and Undo
209
Overview
Edit Menu
The Edit Menu allows most of the basic editing functions. It is available only in Edit Mode. The following commands
are available on the Edit Menu:
Undo
Removes the last change made on the oneline diagram.
Cut
Deletes the currently selected object(s) from display. Cut objects are also copied into the paste buffer.
Copy
Copies the currently selected object(s) into the paste buffer without deleting them.
Paste
Copies the contents of the paste buffer (if any) onto the display at the current cursor location.
Delete
Deletes the currently selected object(s) from the display; does not copy the object(s) to the clipboard. When
deleting objects from oneline diagrams, Simulator will prompt you to specify whether you want to delete both the
display object and the model record or just the display object. See Relationship between Display Objects and the
Power System Model for more details.
Select by Criteria
Brings up the Select by Criteria Dialog which allows selection of many objects which meet a set of criteria. For
example, you could select all the 345 kV transmission lines in Area X and then change them to the color blue using
the Format Selection Dialog.
Select Region
Allows you to select objects on the diagram by dragging a box around the objects you wish to select. To form the
box, left click and hold the mouse button down at the starting point, drag the mouse to form the box around the
objects, and release the mouse button. Only objects which fall ENTIRELY within the box will be selected.
210
Editing Oneline Diagrams
Selecting Objects
Rectangle Selector
You can use the Rectangle Selector button on the Edit Toolbar to select all objects in a particular region of the oneline.
After clicking the Rectangle Selector button, click and hold the left mouse button on the oneline at the point where you
would like to begin the selection. Then, drag the mouse to size the selection rectangle. Finally, let go of the mouse
button once every object you need to select has been selected by the selection rectangle. Handles will appear on
every object located entirely within the selection rectangle, indicating that they have been selected.
211
Select by Criteria Dialog
Selecting Edit > Select By Criteria from the main menu brings up the Select By Criteria Dialog. The Select By
Criteria Dialog provides a way of selecting objects that meet a specific set of criteria. The criteria may include Area
Numbers, Zone Numbers, Voltage Levels, Zoom Levels, and Object Type.
Use the dialog's controls to specify the selection criteria. Use the Area and Zone fields to select the areas and zones
in which you want to select display objects. Ranges of area and zone numbers can be entered in the usual way, or
you can check the All Areas or All Zones boxes to select all areas and all zones. You can also use the Area and
Zone tab pages to check or uncheck areas or zones in which you want to select display objects.
Specify the max and min voltage levels for selected objects using the boxes that are provided, keeping in mind that all
voltages are in kV.
Specify the layers for selected objects in the Layers tab. If not all layers are selected, the Layers Range option will be
selected. If the All Layers option is clicked, then all the layers will be selected.
The check box labeled Require Linked Object can be selected if you want to apply the criteria selection only to
objects that are linked to underlying load flow data. If an object on the diagram is not linked to any valid data, and this
option is checked, the object on the diagram will not be selected.
Next, select the type of object in which you are interested from the supplied list. To select items from this list, check
the box next to the type of field(s) you desire. Display object types that are followed by a right-arrow, such as Area
Fields , are expandable, meaning that they have several associated subtypes. If you checked a field type that has
subtypes, you can highlight the type in the list to see the available subtype list. You can then more specifically select
subtypes that you wish to include. By default, all subtypes of a general object type are selected. You also have the
option for the list to display all fields available for a particular object type, or to display only the most commonly
selected fields.
You can also choose to associate an advanced filter with a particular type of object in the list for selecting only objects
of that type that meet the filter. To do so, right-click in the Filter column next to the object type for which the filter
applies, or click on Add/Modify Filter… Some objects cannot be associated with an advanced filter, and the option
will be disabled when that is the case for an object selected in the dialog.
If you wish to select objects that do not have the chosen criteria, then check Select All Except What Meets the
Above Criteria.
If the Select by Criteria Dialog is open and some display objects have already been selected, an advanced selection
option becomes available. If the box labeled Use as a filter on presently selected objects is checked, the criteria
chosen in the Select by Criteria Dialog will only affect the previously selected objects. In other words, only the objects
that were previously selected AND that match the chosen criteria will remain selected when the OK button is pressed.
For example, you could have used the Rectangular Selector to select a group of objects on the oneline. Then using
the Select by Criteria Dialog, choose the Bus criteria and check Use as a filter on presently selected objects to
select only the buses from the rectangular selected group of objects.
If you wish to only select objects that are currently visible on the diagram (due to layering, etc.), check the box labeled
Select only currently visible objects to apply the criteria settings only to objects on the diagram that are currently
visible.
Once you have selected the criteria and pressed OK, all objects that satisfy ALL the criteria will be chosen. If the
Select All Except What Meets the Above Criteria is unchecked, then the selected objects will lie within the specified
areas AND zones, the specified voltage level, and the specified zoom levels, and will be of one of the drawing types
specified.
You can save your settings for your Select by Criteria session with the case by clicking Save As to save with a new
name or Save to save with the current name. This allows you to re-open the Select by Criteria dialog, and quickly
recover settings you may have previously used. Use the Rename to rename an already saved set, or Delete to
remove a previously saved set of criteria.
If you have saved different criteria sets, you can export them all to an Auxiliary file by choosing Save to AUX file . The
Load All from AUX file will load an entire auxiliary file, regardless of whether it contains Select by Criteria settings or
not.
If you wish to clear all settings you have modified on the dialog, click the Reset to Defaults button.
Using this dialog in conjunction with the Format Selection Dialog, can be a very fast and easy way to customize your
displays.
NOTE: When choosing to select all tie lines, all objects associated with the tie line will also be selected. This includes
all line fields for the line as well as the two buses that are the endpoints of the line.
212
Editing Oneline Diagrams
Changing Basic Display Object Properties
Grid/Highlight Unlinked Objects
The Grid/Highlight Unlinked Objects tab is only available in Edit mode. It controls the appearance of a grid in the
oneline. A grid is not visible by default, but can be setup from the Grid/Highlight Unlinked Objects page of the Oneline
Display Options dialog. Additional options are available from this dialog for disabling anchors and highlighting
unlinked objects on oneline diagrams.
Snap Objects to Grid
If checked, new objects placed on the oneline will be aligned with the grid; the grid does not need to be visible on
the oneline to align objects to it.
X Grid Spacing, Y Grid Spacing
These determine the horizontal and vertical spacing of the grid.
Display Grid Lines on Oneline
If checked, the grid lines will appear on the oneline
Horizontal Show Every, Vertical Show Every
These numbers determine the density of the visible gridlines; for fewer lines enter higher numbers.
Gridline Color
Click in the rectangle to choose the color of the gridlines. The default is grey.
Anchor Options
A check box is available for temporarily disabling anchors on a oneline diagram. This option will disable the anchor
properties of all objects on the oneline diagram.
Do not prompt regarding relinking objects after dragging
Check this check-box to avoid being prompted whether to relink a graphical object after this has been dragged.
Highlighting of Unlinked Objects
Highlight Unlinked Objects with Color
Checking this box allows for any objects on all open oneline diagrams that are currently not linked to any data
in the case to be highlighted using the highlight color. To change the highlight color used, left-click in the color
box to choose a different color.
Minimum Highlighted Object Pixel Size
The minimum size, in pixels, of the highlight image. This is to prevent the highlight from being unnoticeable
when the zoom level is very low.
Extra Width for Highlighted Lines (pixels)
Sets an extra width parameter, in pixels, for highlighting line objects. This will make line object highlights
appear wider than other highlighted objects.
Display Unlinked Elements in Run Mode
This option allows the highlighting of unlinked elements when you switch to run mode. By default the
highlighting of unlinked elements is restricted to edit mode, to avoid confusion in run mode, particularly when
drawing contours.
213
Setting Background Color
The Background Color Dialog changes the background color for the display. To view this dialog, select Options >
Oneline Display or right-click in the background of the oneline and select Oneline Display Options from the local
menu. Switch to the Display Options tab, click Change Background Color, or click on the colored rectangle to bring
up the Color Dialog, which you can then use to select the new background color. Click OK to register the new color.
The Oneline Display Options dialog w ill provide a preview of the color you selected. To define this color as the default
background color to use in all new onelines you create, click the Set as Default Background Color. Finally, click OK
to save your color selection.
214
Editing Oneline Diagrams
Zoom, Pan, and Find
The Zoom, Pan, and Find Options Dialog is used to specify a desired zoom level and screen location or to locate a
particular bus or area/zone on the oneline. The dialog can be opened by right-clicking on the background of the
diagram and choosing Pan/Zoom Control from the oneline popup menu, or by clicking on the Find button on the
Zoom toolbar. The dialog has the following fields:
Find Objects on Oneline
The Find Object on Oneline section of the dialog is used to pan to any desired bus object , area/zone object , branch
object, interface object, or substation object on the oneline. The dialog makes use of the advanced find functionality of
Simulator to locate a device.
Only Include Objects Visible at Current Zoom Level
If checked (the default), then the Object ID combo box only lists those objects that are visible at the current zoom
level.
Object Type
Select the type of object to find: Buses, Areas, Zones, Interfaces, Substations and Lines/Transformers.
Sort By
Specify whether you are entering the object by its number or by its name by choosing either Sort by Name or Sort
by Number. This option also determines how the entries in the list of objects are sorted (either by number or by
name).
Object ID
Enter the object’s number or name (depending on the sort type chosen) or select the object from the list.
Allow Auto Updating on Selection
Check this box to automatically pan to the specified object. The object will be located at the center of the oneline
diagram. This command does not change the zoom level.
Pan to Object on Oneline
Click this button to pan to the specified object if the Auto Updating box is not checked. The object will be located at
the center of the oneline diagram. This command does not change the zoom level.
Auto-Zoom when Panning
Check this box to automatically change the zoom when panning to the specified object.
Zoom / Pan
The Oneline Zoom / Pan tab on this dialog is used to allow the user to specify either a new zoom level and/or screen
center and to define these as the new display default settings. The zoom level and screen center can also be
changed from the keyboard. Please see Oneline Zooming and Panning for details.
Zoom Level
Enter the desired percentage zoom level (nominal is 100%).
Horizontal, Vertical
Enter a desired location for the center of the screen. The nominal screen center is 50 horizontal and 50 vertical.
Restore Default Values
Resets the zoom level and screen center to the default values.
Set as Default Values
Sets the current zoom level and screen center as the default values for the oneline. The Pan/Zoom to New
Location button must be clicked before this feature can be implemented.
Pan/Zoom to New Location
Changes the screen center and zoom level to the values specified in the above fields.
215
Default Drawing Values
The Default Drawing Options Dialog allows you to see and change the various default values used to create new
objects. To show this dialog select Options > Default Drawing Values in Edit Mode.
216
Editing Oneline Diagrams
Format Menu
The Format Menu can be used to change the screen appearance of either individual objects or the entire display. If no
items are currently selected, the menu options on the Format Menu will be unavailable.
Choosing any of the first three options offered by the Format Menu brings up the Format Selection Dialog. The
Format Selection Dialog is subdivided into four tabs that control different aspects of display objects, including font, line
thickness and style, fill color, zoom levels and layers, and individual object size and display orientation.
The Format Menu offers the following options:
Font
Select this option to change the font with which the selected objects are displayed. The Font Tab of the Format
Selection Dialog is displayed.
Line/Fill
Select this option to change the line thickness and style with which a display object is drawn, or the fill color for
closed shapes. The Line/Fill Tab of the Format Selection Dialog is displayed.
Levels/Layers
Select this option to change the stack level of an object, the layer the object is contained in, and optional settings for
when an object should resize. The Levels/Layers Tab of the Format Selection Dialog is displayed.
Display/Size
Simulator can change the attributes of the way multiple objects are displayed using this option, which opens the
Display/Size page of the Format Selection Dialog. The size of the objects can be adjusted, as well as the
orientation of the object(s) from their terminal buses. Objects can also be Anchored to their terminal buses or
devices, or marked as Immobile, meaning the object(s) cannot be moved on the oneline diagram.
Send to Back, Bring to Front
The Send to Back and Bring to Front menu options govern the visibility of display objects that occupy the same
screen stack level. All objects have an associated screen stack level, which may be one of Base, Background,
Middle, or Top. Objects having a screen stack level of Top obscure all objects having stack levels of Middle,
Background, or Base that occupy the same region of the screen. They may or may not obscure objects having the
same stack level of Top depending on the order in which the objects having the same stack level are drawn.
Selecting Send to Back for a selected object will cause it to be obscured by all other same-level objects that occupy
its location. Selecting Bring to Front for a selected object will cause it to be drawn above all other same-level
objects that occupy the same region of the screen. The Send to Back and Bring to Front menu options govern
relative placement of objects only within stack levels. The Send to Back and Bring to Front options do not affect the
relative placement of objects having different stack levels.
217
Format Multiple Objects
The Format Selection Dialog features four tabs of controls for modifying the display attributes of selected objects. To
open the Format Multiple Options dialog, select multiple objects using either Select By Criteria or the Rectangular
Selection tool. Next, right click on any of the s elected objects and select Format Selection from the local menu
Line/Fill
The Line/Fill Tab is used to change the line size, color, and style and the fill color with which the selected objects
are drawn.
Levels/Layers
The Levels/Layers Tab is used to change the stack level of an object, the layer the object is contained in, and
optional settings for when an object should resize.
Display/Size
The Display/Size Tab controls the size and orientation of the selected objects.
Font
The Font Tab is used to change the font used in text/font objects.
Field
The Field Tab is used to change selected fields on the diagram to a different field designation.
218
Editing Oneline Diagrams
Font Properties
The Font Tab allows you to define the font for the selected objects by choosing Font type, size, color and effects. The
page also allows you to control the default display font using the Make Default button.
By clicking on Make Default, the current font name, size, and effects will be set as the def ault font for the display.
This has the same effect as opening the Default Drawing Values and setting the default font.
If a field is currently selected on the oneline diagram, the Include Suffix check-box will specify whether to include the
corresponding field suffix. If a number field is currently selected, the Total Digits in Field and Digits to Right of
Decimal define the format of the number displayed by the selected field.
219
Line/Fill Properties
The Line/Fill Tab is used to customize the line size/color and the fill color of selected objects. You can view this tab by
selecting Format > Line/Fill from the main menu. This tab’s controls can be used to change the appearance of most,
but not all, screen objects. When you modify the line thickness or color of an object, these new values will be set as
the default settings for all new line objects. You can view the case defaults using the Default Drawing Options Dialog.
The Line and Fill Options tab has the following fields/commands:
Line Thickness
Thickness of the line in pixels.
Dashed
Allows setting a line to appear as a dashed line on the diagram. There are three types of line dashing to choose
from in the drop down menu for this option.
Note: Due to drawing limitations, the line thickness for a dashed line must be equal to 1. Any other line thickness
will result in the line being drawn as solid, regardless of the dashed setting.
Line Color
The Line Color field shows the current line color. To change the line’s color, click on the box displaying the current
line color, or click the Change Line Color button. This displays the Color Dialog. Select the desired color and
select OK to change the color, or click Cancel if you do not wish to change the color.
Line Color 2
The Line Color 2 field applies only to transformer objects. Transformers can be represented by different colors on
each side of the transformer coils. This is commonly used to color match each side of the transformer with the color
used to represent the voltage level of the transmission system on each particular side of the transformer. However,
you can customize the colors for selected transformers by modifying them here.
Note that the Line Color 2 field ALWAYS applies to the high voltage side of the transformer when you change
Use Background Fill
Click on this field to toggle whether or not to fill the background for the selected objects with the s elected
background fill color. Only text objects such as Text, Bus Fields, Generator Fields, Load Fields, Switched Shunt
Fields, Line Fields, Transformer Fields, and Area Fields and background objects such as Background Lines and
Background Rectangles can be filled.
Fill Color, Change Fill Color
The Fill Color field shows the current fill color. To change the fill color, click on the box that displays the current fill
color, or click the Change button. This displays the Color Dialog. Click on the desired color and the select OK to
change the color, or click Cancel if you do not wish to change the color.
220
Editing Oneline Diagrams
Levels/Layers Options
The Levels/Layers Tab is used to customize the stack level or layer an object is contained in. To set layers for
objects, select the objects on the oneline diagram (edit mode only) and then choos e Format > Levels/Layers. The
Levels/Layers Options page of the Format Multiple Objects dialog will be displayed, with the following settings
available.
Stack Level
An object’s stack level dictates what objects it will appear above, and which objects it will appear below on a oneline
diagram. For example, circuit breaker and pie chart objects have a default stack level of Top. Therefore anything
with a stack level of Middle, Background or Base will appear underneath pie charts and circuit breakers on the
oneline diagram. Objects that are within the same stack level and are drawn in the same location will result in the
last object drawn being the visible object on the diagram. You can toggle which elements within the same stack
level at the same location is visible using the Send to Back and Bring to Front options of the Format Menu.
Layers
Layers are different than stack levels in that layers are designed to allow the user to filter the elements visible on a
diagram (in run mode). Initially all diagram objects are in the same layer, called Default. This default layer cannot
be modified or deleted. However, you can introduce additional layers using either the Add New… or Define…
buttons. Clicking on Add New… will open a dialog to name the new layer, and will automatically add the new layer
to the case and change the Layer name in the drop down list to the new layer. Clicking on Define… will open the
Screen Layers list display, which will allow you to manage the full list of layers defined for the diagram. Once layers
have been defined, you can choose which layer the selected objects belong to by choosing the Layer name from
the drop-down list by clicking on the down arrow to the right of the layer name.
Settings for resizing when zooming
You can modify the maximum and minimum zoom levels at which the selected text fields will no longer resize. Thus
when zooming in or out on the diagram, text fields will resize according to the zoom level until the minimum or
maximum zoom level are reached. At that point, text fields will no longer resize, but will stay fixed at their current
size as you continue to zoom.
Maintain Fixed Screen Location (do not pan)
This option is available for text fields. When checked for selected text fields, these text fields will no longer pan
when you pan the rest of the diagram. This allows you to place text that will always be visible, regardless of what
part of the diagram you are observing. You can still move the individual text field itself in edit mode.
Maintain Fixed Screen Size (do not resize on zoom)
This option is available for text fields. When checked for selected text fields, these text fields will no longer resize
when the zoom level of the diagram is changed. This allows you to place text that will always be vis ible at a
constant size, regardless of what zoom level you are currently observing on the oneline diagram. You can still
select the text fields themselves in edit mode and change their font size.
221
Screen Layers
The Screen Layers display can be invoked from either the Levels/Layers option of the Format menu in Edit Mode, or
by right-clicking on the oneline diagram background and choosing Edit Screen Layers.
Screen layers provide a method to filter objects on a oneline diagram based on either zoom level or to which layer the
objects are assigned. Initially each object is in a common layer called Default, which cannot be modified or deleted.
You can create new layers using the Screen Layers display.
Since the Screen Layers display is a Case Information Display, it shares the properties and controls of other case
information displays. You can access many case information display features by right-clicking on the display to invoke
the local popup menu. Most importantly, this menu contains the options to Insert and Delete screen layers.
To delete a screen layer, right-click on that layer in the display and select Delete from the popup menu. The one
exception is the Default layer, which cannot be deleted.
To insert a new screen layer, right-click on a record in the display and choose Insert from the popup menu. This will
open the Screen Layer Options dialog for defining the options of the new layer you are inserting.
222
Editing Oneline Diagrams
Screen Layer Options
The Screen Layer Options are used to define options for new layers, or modify options for existing layers. Devices
can be added to a layer by choosing the layer name from the drop-down list on the Levels/Layers Tab of the Format
Multiple Objects dialog.
Name
Layers can have any name desired to describe the layer. The default naming convention is "Layer #".
Show Layer
If this box is checked, any objects on the diagram which are contained in this layer may be visible. This depends on
the settings for low and high zoom level, described below. If the box is unchecked, however, then any objects
contained in this layer will be hidden. Unlike Custom Display Detail, layers can be applied in both edit mode and
run mode.
Use Conditional Display by Zoom Level
Objects can be displayed or hidden based on the Screen Layer to which they are assigned and the current zoom
level of the oneline diagram. Checking this box, and setting the Low Zoom Level and High Zoom Level fields,
dictates at what zoom range the objects contained in the zoom level will be visible. If the zoom level is outside the
range defined, any objects belonging to the zoom level will be hidden. This also applies to both edit mode and run
mode.
223
Format Field Properties
The Field tab of the Format Multiple Objects dialog can be used to modify the format of the selected fields, or to
change a set of selected fields from one field representation to another. Use the Select by Criteria dialog to select
fields of a particular type, and then select Format > Fields from the main menu.
Note that this option also applies to objects which display information related to specific object fields, such as Line and
Interface Pie Charts.
Object Type
This field will be filled in automatically based on the type of object the selected field(s) apply to. You cannot change
this field, which means that you can only change the selected field(s) to another field for the same type of object.
Field
The field type of the selected field(s). To change the selected fields to a new field type, click on the drop-down
arrow of the combo box, or click on the Find… button, and select a new field from the list of fields for the Object
Type.
Include Suffix
Checking this option will add the unit suffix to the selected fields.
Total Digits in Field
Modify the number of digits to display in the field. This number includes the decimal and the numbers to the right of
the decimal.
Digits to Right of Decimal
Modify the number of the total digits that should appear to the right of the decimal.
224
Editing Oneline Diagrams
Other Display Object Properties
Use the Display/Size Tab of the Format Multiple Objects dialog to change the display size, orientation, anchor property
of the selected objects. To change the display size of the selected objects, modify the Size parameter. To change the
orientation of the selected objects, modify the Orientation setting. To toggle whether or not the selected objects are
anchored , check or uncheck the Anchored option. To force the object to stay in the same position, check the
Immobile check-box.
Number of Selected Objects
This field shows the number of objects that are currently selected on the oneline.
225