PowerWorld Simulator version 11. Manual - page 10
Text-Based Information Displays
Custom Expressions
Custom Expressions
Simulator allows you to define Custom Expressions that are functions of other fields. These Custom Expressions can
then be shown as a column in the Case Information Display. To define custom expressions, right click on a Case
Information Display and choose Define Expression from the local menu. This brings up the Define Custom
Expressions Dialog. When you bring up the dialog you will only see expressions that have been defined for the type of
object shown on the Case Information Display (e.g. Bus, Generator, Interface, etc…).
To define a new custom Expression click New .
You can name the expression for easy identification in the list of fields for the object by filling in the Expression Name
field.
To define the Custom Expression, first specify which fields you would like to use in the expression and assign them to
the variables x1, x2, …, x8. Then type in the expression as function of the variables x1, x2, …, x8. For example
x1 * SIN(x2) + EXP( -x5)
or
TAN(x1) + ABS(x6)*8 - 100
For a complete list of functions and operators that are available to you, see Functions and Operators Available.
Once the Custom Expression has been defined, you may add the expression to the column of the Case Information
Display you called it from by clicking on Add Column… For more information on how to add columns to a display see
Configuring the Case Information Displays.
349
Custom Expressions Display
To open the Custom Expressions Display, select Case Information > Other > Custom Expressions . If you have
defined any custom expressions for your case, you can see the list of those expressions in this display. The name of
the expression is given, along w ith the custom expression itself. The display also shows the values being represented
by each of the variables in the custom expression.
Custom expressions cannot be inserted manually in this display, but they can be loaded from an auxiliary file by right-
clicking on the grid and selecting Load > Auxiliary File (any data)… from the local menu. Conversely you can save a
list of custom expressions in a case to an auxiliary file by right-clicking on the grid and choosing Save As > Auxiliary
file .
350
Text-Based Information Displays
Functions and Operators Available
Below is a list of functions and operators that are available for use in Defining Custom Expressions:
Symbol
Equivalent
Descr iption
Example
( )
Prioritizes an expression
5*(1+1) = 10
!
FACT
Factorial
5! = 120fact(5) = 120
%
Percentage
35% = 0.35
^
**
Raised to the power of
4 ^ 5 = 1024
Multiply by
3 * 6 = 18
/
Divide by
9 / 2 = 4.5
\
DIV
Integer divide by
9 \ 2 = 4
MOD
Modulo (remainder)
7 mod 4 = 3
+
Add
1 + 1 = 2
-
Subtract
9 - 5 = 4
>
Greater than
9 > 2 = 1
* see note
<
Less than
7 < 4 = 0
==
=
Equal test
5 == 4 = 0
>=
=>
Greater or equal
3 >= 3 = 1
<=
=<
Less or equal
#h3E <= 9 = 0
<>
Not equal
#b10101 <> 20 = 1
NOT
Bitwise NOT
NOT(15) = -16
AND
&
Bitwise AND
#b101 AND #h1E=4
OR
|
Bitwise OR
13 OR 6 = 15
XOR
Bitwise Exclusive OR
9 XOR 3 = 10
EQV
Bitwise Equivalence
6 EQV 9 = -16
IMP
Bitwise Implication
1 IMP 5 = -1
IIF
If condition
IIf(1+1=2,4,5) = 4
MIN
Minimum value
min(10,3,27,15) = 3
MAX
Maximum value
max(1,9)=9 *see note
SIN
Sine
sin(pi) = 0
*see note
COS
Cosine
cos(pi) = -1
TAN
Tangent
tan(pi) = 0
ASIN
Arc sine
asin(1) = 1.570
ACOS
Arc cosine
acos(-1) = 3.141
ATAN
ATN
Arc tangent
atan(0) = 0
SEC
Secant
sec(0) = 1
CSC
Cosecant
csc(1) = 1.18
COT
Cotangent
cot(1) = 0.642
SINH
Hyperbolic sine
sinh(3) = 10.01
351
COSH
Hyperbolic cosine
cosh(2) = 3.76
TANH
Hyperbolic tangent
tanh(1) = 0.76
COTH
Hyperbolic cotangent
coth(1) = 1.31
SECH
Hyperbolic secant
sech(0) = 1
CSCH
Hyperbolic cosecant
csch(1) = 0.85
ASINH
Hyperbolic arc sine
asinh(2) = 1.44
ACOSH
Hyperbolic arc cosine
acosh(9) = 2.89
ATANH
Hyperbolic arc tangent
atanh(.1) = 0.10
ACOTH
Hyperbolic arc cotangent
acoth(7) = 0.14
ASECH
Hyperbolic arc secant
asech(.3) = 1.87
ACSCH
Hyperbolic arc cosecant
acsch(2) = 0.48
ABS
Absolute value
abs(-8) = 8
EXP
e to the power of
exp(3) = 20.08
EXP2
2 to the power of
exp2(3) = 8
EXP10
10 to the power of
exp10(3) = 1000
LOG
LN
Natural log
log(16) = 2.77
LOG2
Log base 2
log2(8) = 3
LOG10
Log base 10
log10(100) = 2
CEIL
Round up
ceil(6.2) = 7
RND
Random number
rnd(1) = .969
INT
Truncate to an integer
int(6.8) = 6
SGN
SIGN
Sign of expression (-1, 0, or 1)
sgn(-9) = -1
SQR
SQRT
Square root
sqr(64) = 8
352
Text-Based Information Displays
General
Find Dialog Basics
Many times when working with large load flow cases, it can be somewhat difficult to locate devices in the case
information displays regarding a specific device. Simulator has many tools to facilitate filtering data, such as the
Area/Zone/Owner filters and the Advanced Filtering tool. Even with these helpful tools, finding a device can still be
hampered when the bus number or exact spelling of the bus name are not known.
To facilitate locating devices in Simulator, you can use the Find tool to use Simulator’s advanced search engine for
finding the device(s) you are looking for. The Find tool is available from the popup menus of almost all case
information displays, as well as several of the various information dialogs in Simulator. Anywhere you see a button or
menu option labeled Find… you can open the advanced search tool.
Once the Find dialog has been opened, the dialog will automatically adjust to suit the type of device you are searching
for. The caption of the dialog should reflect the type of object the dialog is currently attuned to locate. For most
devices, such as buses, generators, loads, etc., there will be one list displayed at the bottom of the dialog containing
numbers and names of the type of device you are searching for. In some instances, mostly when searching for
branch-type devices, the bottom panel is split with a second list is displayed in the right side panel. This list is used to
display the possible connections of the bus selected in the first list. For example, if bus number one is selected and it
has connections to bus two and bus three, the second list will display the information for bus two and bus three. Thus
you can search for a bus in the first list, then choose from the possible connections in the second list to get a specific
branch from the list.
Despite what type of device you are trying to find, the first few options and buttons on the dialog will be the same.
Sort by Name and Sort by Number allow you to choose how you wish to find a device in the list. If you know the bus
number you are looking for, choose Sort by Number. If you know the name, or at least part of the name, that you are
looking for, then choose Sort by Name. The list (or first list for branches) will be sorted accordingly.
If you wish to narrow down the list of devices to search through, you have a couple of options for filtering the list before
searching through it. First you can make use of the traditional Area/Zone/Owner filters by clicking in the associated
check box. If you need to set more specific conditions for filtering the list, you can instead click the Define Filter
button to set up an advanced filter. Either one will reduce the number of devices in the list for the search.
Once you have the list set up for your search, you can type in the number or name you wish to find in the text box. If
you do not know the exact number or name, you can use wildcards to facilitate the search and find all possible
matches for a set of characters or numbers. You can use a question mark (?) to represent a single character wildcard,
or an asterisk (*) to represent a multiple character wildcard.
For example, if you want to find bus number 10005, but all you know is the first four digits are 1000, you can type in
*1000*, and Simulator will search until it finds the f irst number that contains those four digits. You can then use the
Search Next button (note that pressing Enter is the same as clicking Search Next) to find the next number containing
the four numbers, and so on. The same goes for searching by name. If you are looking for bus ACEONE, but all you
know is the name contains the string ACE, then you can type in *ACE* and then keep pressing Enter until you find the
bus named ACEONE. By using the beginning and ending *, we would also find elements such as NEWACE, because
the double * looks for strings that contain ACE anywhere in the string. Note that if you know the first few letters (or
numbers), you can narrow down the number of elements found from the search by eliminating the first * from the
search string. For example, to find bus ACEONE, we could have instead used ACE*, and this would have gone
through all matches that started with ACE, ignoring other elements such as NEWACE. You can also use wildcards in
the middle of a string, such as AC*NE, and Simulator will find any name that starts with AC and ends with NE.
353
Search for Text Dialog
This dialog allows you to search for specific text in a case information display. Specify the text you want to search in
Search for edit box. Clicking on Search Next will take you to the next field whose content matches with the text
specified. The search can be made By Rows, in which the text is searched first in all the fields of a record, before
searching in the next record. If the search is made By Columns then the text is searched first in all the fields of a
column, before searching the text in the next column. If the option Match case is checked, the search for text will be
case-sensitive. The option Find entire cells only will take you only to fields whose entire content matches completely
with the text you are searching for.
354
Text-Based Information Displays
Model Conditions Display and Dialog
Model Conditions are a type of Model Criteria. Model Criteria represent Boolean expressions regarding the present
state of the power system model. They can be used to create a convenient display that shows whether the power
system meets a set of criteria. They can also be used in conjunction with the definition of a contingency in the
Contingency Definition Display to create contingency actions that are conditional on the state of the power system.
A model condition contains two parts: a power system element and an advanced filter. The model condition will then
return true or false depending on the result of applying the advanced filter to the power system element specified.
Model conditions can also be used as part of a Model Filter.
The Model Conditions Display is a type of Case Information display and has the abilities common to this type of
display. To delete a model condition, right-click on the display and choose Delete . To insert a new model condition,
right-click on the display and choose Insert. This brings up the Model Conditions Dialog that can be used to create,
delete, and modify Model Conditions.
Model Conditions Dialog
The Model Conditions Dialog has three sections. The top section provides the ability to Save, Save As , Rename
and Delete model conditions. To choose a different Model Condition, use click on the down arrow next to the
Model Condition name.
The middle section provides a location to specify what power system element this Model Condition is related to. On
the left is a list of Element Types that are available. When clicking on one of these types, the right portion of the
dialog will provide you with a list of the elements of this type. This list is a familiar Find Dialog and provides you the
ability to search for the element you are interested in.
The bottom section provides a location to specify an Advanced Filter which you would like to have applied to the
power system element chosen in the middle section. The bottom section of the dialog behaves identically to the
Advanced Filtering Dialog. If an Advanced Filter exists for the type of element you are creating a Model Condition
for, you can click the Set Filter Same As button to choose this filter. This will then set the parameters of the Model
Condition to be the same as the Advanced Filter.
355
Model Filters Display and Dialog
Model Filters are a type of Model Criteria. Model Criteria represent Boolean expressions regarding the present state
of the power system model. They can be used to create a convenient display that shows whether the power system
meets a set of criteria. They can also be used in conjunction with the definition of a contingency in the Contingency
Definition Display to create contingency actions that are conditional on the state of the power system.
A model filter contains a list of Model Conditions and a Boolean operator to apply to these model conditions. The
model filter then returns true or false depending on the resulting of applying the Boolean operator to the Boolean
results of the model conditions.
The Model Filters Display is a type of Case Information display and has the abilities common to this type of display.
To delete a model filter, right-click on the display and choose Delete. To insert a new model filter, right-click on the
display and choose Insert. This brings up the Model Filters Dialog that can be used to create, delete, and modify
Model Filters.
Model Filters Dialog
The Model Filters Dialog behaves in a manner very similar to the Advanced Filtering Dialog. To choose model
conditions for the model filter, click the down arrows next to the model conditions list. You may also click the Find...
button to the left of the list. To insert or delete model conditions from the model filter, click the Add>> or Delete
button. When specifying more than one model condition, choose the Logical Comparison that will be used to
compare the conditions. Finally, the top of the dialog provides the ability to Save , Save As , Rename and Delete
model filters. To choose a different Model Filter, use click on the down arrow next to the Model Filter name.
To modify the model conditions in the case, click the Modify Model Conditions Dialog. This will open the Model
Conditions Dialog.
356
Text-Based Information Displays
Entering a Range of Numbers
On a number of displays it is often convenient to enter a group of numbers, including ranges. Examples include
entering buses or areas to scale on the Scaling Display, or buses on the Quick Power Flow List. The format for this
field is to enter individual numbers separated by commas, and/or ranges with a dash between the beginning of the
range and the end of the range.
For example the entry
1-5,21,23-25
corresponds to numbers 1 through 5, 21 and 23 through 25.
357
Copying Simulator Data to and from Other Applications
You may sometimes find it useful to copy data from Simulator to other applications such as a word processor or
spreadsheet program. Alternatively, you may want to copy data from other applications into Simulator. Simulator’s
case information displays provide a convenient way to accomplish this. In particular, the Copy All, Copy Selection,
and Paste options from the local menu allow Simulator to communicate data with other applications.
To copy a selection of data from a case information display to another application, first select the range of cells to copy
from the case information display. Then, right-click on the case information display to display its local menu, and
choose Copy Selection. To copy the entire content of a case information display to another application, follow the
same procedure, except choose Copy All from the local menu instead of Copy Selection. Switch to the application
that will serve as destination for the data and use that application’s Paste command to finish copying the selected
Simulator data to that application. Note that not only is the data copied, but by default so are the data headings. The
data headings are very important to maintain if you are planning on copying data from a spreadsheet back into a
Simulator case information display.
Note: Be aware that most programs have limitations on the amount of information you can paste. For example, some
spreadsheet programs only allow up to 256 columns and 65,000 rows of information. Some power system
information, particularly the Ybus or Jacobian matrices, can easily exceed these limitations.
To paste data from another application into a case-information display, select the data in the other application and use
that application’s Copy command. In order to paste back into Simulator, you must have the record type and data
headings selected with the columns of data. The record type (or object name) must match the case information
display you are attempting to paste into, and the data headings (or variable names) tell Simulator which columns of
data you are pasting. In order for the data to be pasted to the correct records, you must include the key field columns
in the data to be pasted into Simulator. It is not necessary to copy and paste all columns or rows of data back into
Simulator, as long as the column headings match a valid heading for the case information display. It is also important
to note that you CANNOT have columns of data that are unrecognizable by Simulator in between valid data columns
in the data you are attempting to paste. Simulator will only paste columns of data from the clipboard up to the point
where it finds an unrecognizable column header. If there are any valid columns of data after the unrecognized
column, that data will be ignored. If you wish to copy data from a spreadsheet into a Simulator display, you must
make sure they are ordered in such a way that all the information you wish to paste can be grouped and copied as one
block of date from the spreadsheet. Once you have copied all the information from the spreadsheet you wish to
transfer, switch to Simulator, open the case information display in which to paste the data, and select Paste from its
local menu.
Note: You can only paste values into the case information displays if the values are enterable on the display (shown
blue by default). Also, be careful about pasting redundant data. For example, in the Bus Records display both voltage
in per unit and voltage in kV are enterable, but they specify the same information. Make sure you only copy ONE of
these columns into Simulator. Otherwise you may not get what you expect. Simulator will paste the value in twice,
and whatever value was pasted 2nd will be used.
358
Text-Based Information Displays
Save Case Information Data
The Save Data Dialog gives you quick access to saving data from certain Case Information Displays in a PowerWorld
Simulator Auxiliary File.
Specify the name of the auxiliary file in which to save the data records in the text box labeled Name of File to Save .
Instead of typing the name of the file by hand, you can press the Browse button to locate it. Then, indicate whether
you want the objects whose data you are writing to the file to be identified by number or by name. Finally, to ensure
that only the records currently listed in the Case Information Display are written to the auxiliary file, check the Save
Only Records Listed in this Display checkbox. Otherwise, data for all such objects in the entire system will be
saved to the file.
When you have finished setting these options, click OK. If you changed your mind and do not want to save the data to
a file, click Cancel.
359
Key Fields
Key fields are required fields when attempting to paste data into a Case Information display from another data
application. Other fields are also considered required fields for the purpose of creating new objects in Simulator by
pasting or loading information from another source, such as Excel or a PowerWorld Auxiliary file. The key fields are
easily identified from a few different locations.
Column Headings
The column headings of case information displays are colored to indicate fields that are key fields. Any field that is
a required key field will be highlighted yellow. Also note that some fields are highlighted green. These fields are
fields that are required when you are attempting to create a new object by pasting or loading the data into the
display from another application. If the necessary key fields (yellow) are not included in the data loaded into the
display from another source, the information for that object is ignored. If all of the required (green) fields are not
included in an object that is detected as new, Simulator will skip it. If all the required fields are present, then
Simulator can create the new object. Note that for new objects, the key fields are required as well.
Display/Column Options
The Display/Column Options dialog, available by right-clicking on any case information display, also has the
capability to highlight both the key fields and required fields, as described above. The check box labeled "Highlight
Key Fields" will enable highlighting of the field names in the two lists on the display.
Export Object Fields
This option from the Help menu in Simulator allows you to export a list of most fields for each type of object in a
case. The list also indicates which fields are key fields for each object. You can output this list of fields as either a
text file or into Excel.
The following table lists some of the more commonly accessed key f ields needed when attempting to Paste data into
existing objects in a Case Information Displays from another data application.
Type of Data
Data Description
Required Key
Columns for Paste
Area
Area Records
Area Num
Bus
Bus Records
Number
DC Line
DC Line Records
Rectifier Number
Inv Number
Num
Gen
Gen Records
Number
ID
Interface
Interface Records
Name
Line/Transformers
Line Records
From Number
To Number
Circuit
Load
Load Records
Number
ID
Substations
Substation Records
Sub Num
Switched Shunt
Switched Shunt Records
Number
ID
Zone
Zone Records
Zone Num
360
Text-Based Information Displays
Customized Data Grids
To open the Customized Data Grids display, select Case Information > Other > Customized Data Grid. If you have
customized any of the case information displays for your case, you can see a list of the customized displays and their
settings from this display.
Customized Data Grid settings cannot be inserted manually or modified on this display. Those modifications must be
done on the actual case information display. The primary use of this list display is to provide you a location to save
and load case information customizations to an auxiliary file. Customizations can be loaded from an auxiliary file by
right-clicking on the grid and choosing to load data from an auxiliary file. To save the customizations, right-click on this
display and select Save As > Auxiliary Data.
361
Contour Column Dialog
The Contour Column Dialog allows you to contour case information display columns.
The Contour Column Dialog has tw o tabs: the Contour Type Tab, and the Custom Color Map Tab.
362
Text-Based Information Displays
Contour Column Type
Color Map
Choose from various predefined color maps using the color map combo-box. A color map, along with the values
specified, defines how values are mapped to a color on the contour image.
If a color map showing both high and low values is desired (such as for bus voltages), use of "Blue = Low, Red =
High" is recommended. If a color map showing only high values is desired (such as for line flows), use of "Weather
Radar, Nominal to High" is recommended.
A user may also define additional color maps by going to the Custom Color Map Tab.
Reverse Color Map Colors
Check this box to reverse the colors of the selected color map, so the low color becomes the high color, and vice
versa.
Brightness
Modify the brightness track bar to change the brightness of the color map.
Use cell values directly
Select this option to use the cell values to do the contouring.
Use the specified field below
Select this option to use a different field value to do the contouring.
Value
Select the quantity to use in the contouring from the Value dropdown box or click the Find Value button to find
the desired field.
Draw Color Key
Checking this box will cause the contour to draw a color key showing which colors are mapped to which values.
You can also give the color key a title, unit label, and specify the number of digits to display in numerical values.
Title
Title for the color key.
Entry Labels
Units of the contoured value displayed on the color key.
Label Digits to Right of Decimal
Number of decimal places of the contoured value displayed on the color key.
Save Contour Image with Oneline
Checking this box will allow a displayed contour to be saved with a oneline diagram. If a contour is saved with a
oneline diagram, the next time the oneline diagram is opened the contour will automatically be redrawn as well.
Continuously Update Contours
Normally contouring is only done on a snap shot of the power system state. However, you can also set
PowerWorld to automatically update the contour every time the display is redrawn. In this way, an animation of the
contour can be created. If you would like to create this animation, simply check the Continuously Update Contours
checkbox. Note, however, that this will slow down the animation of the display, as the program must recalculate the
contour at each step. If this slows down your display too much, try lowering the contour resolution to speed it up.
Use absolute value
Check this check-box to use the absolute values of the quantity selected at the Value dropdown box (above).
Values
These values along with the color map define how to convert your values into a color for the contour. The values
are:
Maximum
The largest value allowed in the contour. All values above this will be mapped
to the highest color. This value corresponds to 100% in the color map.
Break High
This value is used by some color maps to highlight a lower limit. This value
corresponds to 75% in the color map.
Nominal
This value is the nominal value for the contour. Values around this will be
mapped to the middle color. This value corresponds to 50% in the color map.
Break Low
This value is used by some color maps to highlight a lower limit. This value
corresponds to 25% in the color map.
363
Minimum
The smallest value allowed in the contour. All values below this will be mapped
to the lowest color. This value corresponds to 0% in the color map.
Note: a representation of the color map is shown to the right of the values.
364
Text-Based Information Displays
Grid Metrics Dialog
The grid metrics dialog allows you to determine the metrics for a set of columns. The metrics determined include:
Sum, Average, Variance, Standard Deviation, Maximum and Minimum.
By default the dialog is set to determine the metrics for the whole column of the case information display where the
option has been selected. However, the selected record set can be modified. The Start Column and End Column
values specify what columns to include in determining the metrics. The Start Row and End Row values specify what
records to include when computing the metrics. If the option Treat blank cells as zero is checked, then any blank
cells will be considered as zero when computing the metrics. Instead, if the option Ignore blank cells for calculation
is checked, any blank cell will be taken out of the metrics calculation. Check Use Absolute Values to use the
absolute values of field values for the metrics computation. Finally, click Update Metrics to determine the metrics with
the new set of options.
365
Custom Case Information Displays
Custom Case Information Display
To open the Custom Case Information Displays, choose Case Information > Custom Case Info from the menu.
(Note: if this option is not displayed by default, then it can be added by right-clicking on the Toolbars and choosing
Customize. Then either "Reset" the Main Menu or add the command under the Commands tab.)
Custom Case Information Displays can be used to create a display very similar in appearance to a spreadsheet
workbook with several worksheets. This display can show any information that can be shown on a case information
display, but also allows you to customize the layout of the information in any manner.
There are three buttons which allow you to Rename the present sheet, Add a new sheet, or Delete the present sheet.
There are three different kinds of cells allowed on this display
· Blank Cell - contains nothing
· Plain Text Cell - contains a user-entered string with no link to any data in the model.
· Model Field Cell - contains a link to model field similar to inserting a model field on a oneline diagram
Each cell of the display will behave differently depending on the Custom Case Info Mode. There are four distinct
modes that control the user interaction and operation of the custom case information display. These four modes and
the effect they have on the display are described in topics
· Define Fields/Strings
· Change Field Data
· Show Fields Primary
· Show Fields Secondary
366

Text-Based Information Displays
Define Fields/Strings
The "Define Fields/String" mode is the primary mode for use when setting up a new Custom Case Information Display.
The three kinds of cells behave as follows in this mode.
Blank Cell
To convert to a Plain Text Cell, just type in the cell. To convert to a Model Field Cell, double-click on the cell to
open up a dialog for defining the model field.
Plain Text Cell
These cells will appear in the Case Info Display Enterable Color (blue by default). To change them just type on the
cell. When pasting into such a cell or editing it directly it will parse the string entered trying to create a Model Field
as though the s tring represents the model fields as shown in the Show Fields modes. If the string does not
represent such a field, then it will remain a Plain Text Cell
Model Field Cell
Model Field cells will not be enterable. In order to edit these fields, you must double-click on the cell to open a
dialog for defining the model field.
367
Change Field Data
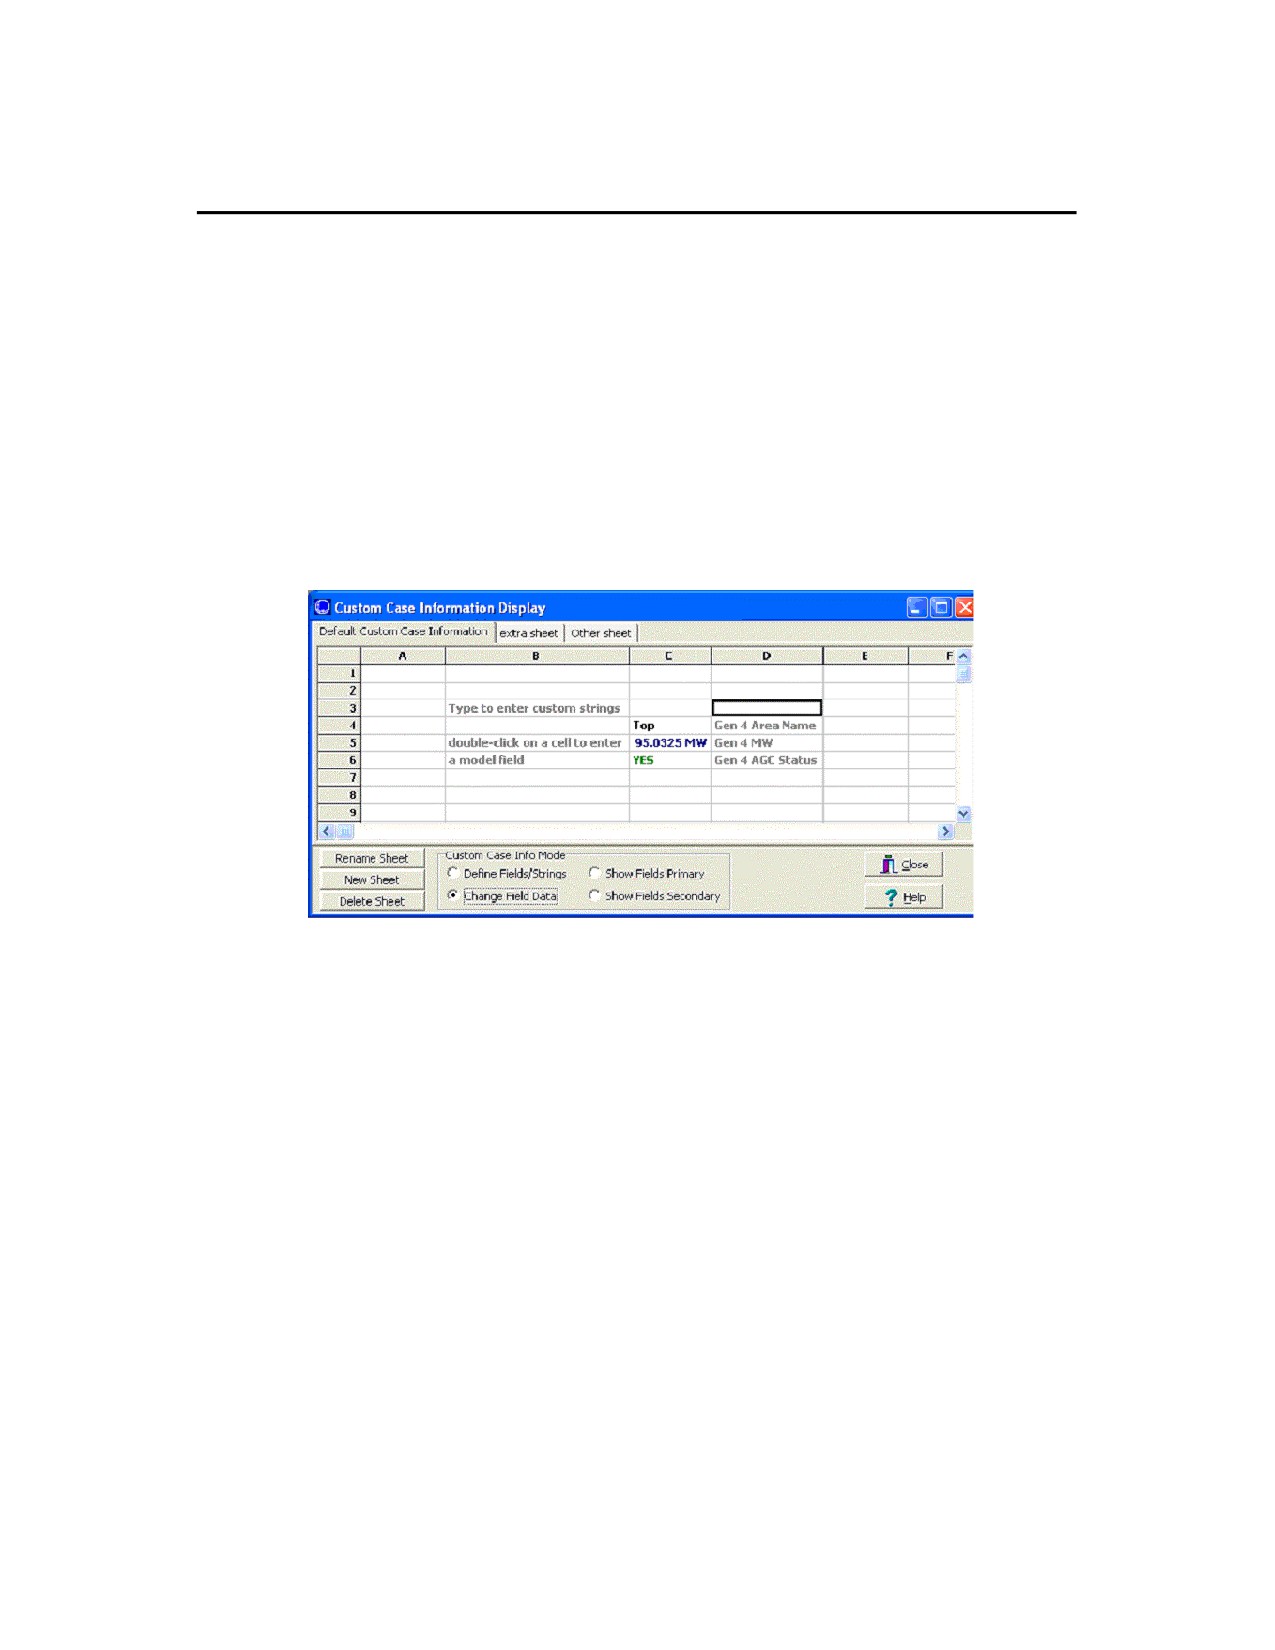
The "Change Field Data" mode can be used to edit the data referred to by the model fields on a custom case
information display. The three kinds of cells behave as follows in this mode.
Blank Cell
Blank cells may not be edited in any manner.
Plain Text Cell
Plain Text cells may not be edited in any manner. It will appear in a special color defined for the custom case
information display which may be specified from the local menu of the workbook tabs. By default this color is dark
gray.
Model Field Cell
Model Field cells will behave according to the field to which they refer. Enterable fields will be enterable, toggleable
fields will toggleable, etc… When pasting in the sheet in this mode you will be modifying the model data directly. In
the following picture there are three fields in cells C4, C5, and C6 that refer to read-only, enterable, and toggleable
field respectively. The fields are labeled using the plain text cells in D4, D5, and D6.
368

Text-Based Information Displays
Show Fields Primary
The "Show Fields Primary" mode is used for interacting with an external spreadsheet to create the model field links in
custom case information displays. The three kinds of cells behave as follows in this mode.
Blank Cell
Blank cells behave the same as for the "Define Fields/Strings " mode.
Plain Text Cell
Plain Text cells behave the same as for the "Define Fields/Strings " mode.
Model Field Cell
Model field cells will display a string which represents information about the model field link. The format for this
string will be
‘model field name’ ‘variable name’ totaldigits decimalpoints IncludeUnits
The model field string will use the primary key fields.
When pasting into such a cell or editing it directly it will parse the string entered trying to create a Model Field as
though the string represents the model fields as shown in the Show Fields modes. If the string does not represent
such a field, then it will remain a Plain Text Cell.
369

Show Fields Secondary
This mode is identical to the Show Fields mode, except that it will show model fields string using the secondary key
fields.
370
Text-Based Information Displays
Custom Case Information Display Local Menu
By right-clicking on the tabs representing the various sheets of the custom case information display, a local menu
appears giving you the following options.
· Rename Sheet - this is only available if you click directly on a specific tab. Choose it to rename the sheet.
· Delete Sheet - this is only available if you click directly on a specific tab. Choose it to delete the sheet.
· New Sheet - Choose this to add a new sheet
· Save All Sheets… - Choose this save all the information on the sheets to an auxiliary file. For the fields one
the display, all information will be saved to the auxiliary file using Primary Key Fields unless the Custom Case
Info Mode is set to Show Fields Secondary. In this case, they will be saved using the secondary key fields.
· Custom Case Info Mode - Choose this to open a submenu that allows you to change the mode.
· Tabs Position - Choose this to open a submenu that allows you to change the location of the tabs relative to
the sheets
· Plain Text Change Data Color - Choose this to change the color which is used to denote Plain Text cells when
the Custom Case Info Mode is set to Change Field Data. The default color is dark gray.
By right-clicking on one of the Custom Case Information Display sheets, you will open a local menu that has many
options which are the same as other Case Information Displays. There are a few extra options listed as follows
· Insert Row - Choose this to insert a new row at the location of the presently selected cell
· Delete Row - Choose this to delete rows that are part of the present selection
· Insert Column - Choose this to insert a new column at the location
· Delete Column - Choose this to delete columns that are part of the present selection
· Delete Cell - Choose this to delete the presently selected cells
· Custom Case Info Menu - Choose this to open the same menu available by right clicking on the tabs
representing the various sheets
371
Summary Displays
Case Description
The Case Description Dialog allows you to enter a text description of a case. The portion of the description that is
saved with the case varies with case type:
PowerWorld Binary (*.pwb)
Essentially an unlimited number of lines allowed
PTI Raw Data format (*.raw)
Two lines
GE EPC Data format (*.epc)
No case description supported
PowerWorld Case (*.pwc)
No case description supported
IEEE Common Format (*.cf)
No case description supported
In PowerWorld Viewer, these descriptions are read-only.
Select Case Information > Case Description from the main menu to display the Case Description Dialog.
372
Text-Based Information Displays
Case Summary
The Case Summary Display provides a summary of the current case. Note that there are no enterable fields on the
display. To display the Case Summary, select Case Information > Case Summary from the main menu. The fields
shown on this display include:
Number of Devices in Case shows the number of each of the following device types:
Buses
Total number of buses in the case. Use the Bus Display to see a listing of these buses.
Generators
Total number of generators in the case. Use the Generator Display to see a listing of these generators.
Loads
Total number of loads in the case. Use the Load Display to see a listing of these loads.
Switched Shunts
Total number of switched shunts in the case. Use the Switched Shunt Display to see a listing of these switched
shunts.
Lines/Transformers
Total number of transmission lines and transformers in the case. Use the Line/Transformer Display to see a listing
of these lines and transformers.
2 Term. DC Lines
Total number of two-terminal dc transmission lines in the case. Use the DC Transmission Line Display to see a
listing of these dc lines.
N-Term. DC Lines
Total number of multi-terminal dc transmission lines in the case. Use the DC Transmission Line Display to see a
listing of these dc lines.
Control Areas
Total number of control areas in case. Use the Area Display to see a listing of these areas.
Zones
Total number of zones in the case. Use the Zone Display to see a listing of these zones.
Islands
Total number of islands in the case. An island is a group of buses that are interconnected through ac transmission
lines or transformers but are isolated from the rest of the system. Each island must have a s lack bus. In Simulator,
use the Power Flow Solution tab of the PowerWorld Simulator Options display to specify whether multiple islands
are allowed.
Interfaces
Total number of interfaces in the case. An interface is a grouping of tie line objects between area objects. In
Simulator, use the Interfaces Display to open the Interface Dialog to define and modify interface objects.
Injection Groups
Total number of injection groups in the case. An injection group is a collection of loads and generators (objects
that inject power into a network). In Simulator, use Injection Groups Display to open the Injection Groups Dialog to
define and modify injection groups.
Case Totals
Summarizes the total load, generation, shunt compensation, and losses for the case. Positive shunt compensation
denotes shunt load, whereas negative shunt compensation indicates a shunt injection (such as shunt capacitance).
The case totals fields are valid only when the current case is solved.
Generator Spinning Reserves
The total difference between the present total generator output versus the total maximum possible output of all in-
service generation.
Slack Bus Number(s)
The number(s) of the slack bus or buses. One slack bus is required for each island.
Case Pathname
Full file name of the current case.
373
Power Flow List
The Power Flow List shows detailed information about the system’s power flows in a more traditional text-based form.
This information is intended for users who would like detailed flow information about the power flow. Including the per
unit voltage at the bus, the bus’ load and generation, and flows on all lines and transformers emanating from the bus.
The content of this display (i.e. which buses are included in the list) is governed by the area/zone/owner filters.
To show this display select Case Information > Power Flow List from the main menu.
To view flows at just a few select buses you may want to use the Quick Power Flow List instead. For large systems
with no area/zone filtering set, it may take Simulator a long time to generate the complete Power Flow List. Note also
that this display can show a maximum of 32,767 lines of text. If this limit is exceeded, Simulator will generate a
resource error. Either use the area/zone/owner filters to limit the number of devices shown on this display, or use the
Quick Power Flow List to focus on a few selected buses of interest.
The Power Flow List allows you to navigate through the system’s buses rather easily. You can also use the display to
show the flows for a bus’ neighbor by double-clicking on the line that reads "TO nnnnn…," where nnnnn is the number
of the bus you would like to see. The display is then positioned at this bus. If the bus is in an area and/or zone whose
area/zone filter is not set, the area/zone filter is set automatically. In this way, you can inspect the system bus by bus.
The display can also be used to quickly display the dialog box associated with different bus objects. Place the cursor
on the desired device, depress the CTRL key and then left click. The corresponding bus, load, generator, or shunt
information dialogs will be displayed.
The Power Flow List also has its own local menu, which can be viewed by clicking the right mouse button on the
display. Select Change Font to modify the style and size of the display’s font. Select Refresh to ensure that the
display’s contents concur with the current system state. To skip to particular bus in the list, click Find Bus, which will
open the Find Bus Dialog. To display the information dialog for the currently selected branch, bus, load, or shunt,
select Display Object Dialog. To print the display, choose the Print local menu option. Choosing Copy enables you
to copy the display into the Windows clipboard, from where the information can be pasted into another application.
Finally, select Close to close the display.
When printing the display you can either send the results directly to the printer or save them to a text file. To save the
results in a text file on the Print Dialog select the Save to File option shown in the lower left corner of the dialog.
For each bus, the following items are shown:
Bus
Shows the bus’ number, name, and nominal voltage in kV. The next four fields are the MW, MVar, MVA and
percentage headers for subsequent rows. The next fields specify the per unit voltage magnitude, voltage angle in
degrees, the bus’ area number and the bus’ area name. Depress the CTRL key and then left click on this line to
display the Bus Dialog.
Generator
For each generator at the bus, the Power Flow List shows the generator’s ID (immediately after the keyword
GENERATOR) and the power output of the generator in MW. Following this is generator’s reactive power output in
Mvar. A single character is shown immediately after the Mvar field. An ‘R’ indicates that the generator is regulating
the bus voltage, ‘H’ indicates that the generator is at its high reactive power limit, ‘L’ indicates that the generator is
at its low reactive power limit, and a blank suggests that the generator is set off of AVR. The last field in the
GENERATOR item is the MVA output of the generator. Depress the CTRL key and then left click on this line to
display the Generator Dialog. If no generators are connected to the bus, this item will be absent from the display.
Load
Shows the total power consumed by each load at the bus. If no loads are present at the bus, this item will be
absent from the display. Depress the CTRL key and then left click on this line to display the Load Dialog.
Shunt
Shows the total power for the fixed shunts at the bus. Positive shunt values denote shunt load, while negative
shunt quantities indicate injection. If no shunts are connected to the bus, this item will be absent from the display.
Switched Shunt
Shows the total power for the switched shunts at the bus. Depress the CTRL key and then left click on this line to
display the Switched Shunt Dialog. If no switched shunts are located at the bus, this item will be absent from the
display.
Lines and Transformers
For each line or transformer coming into the bus, the Power Flow List shows the line’s flow and percentage loading.
For transformers, the off-nominal tap ratio and phase shift angle in degrees are also shown. Immediately to the
right of the off-nominal tap ratio is a two-character designation indicating the tapped side of the transformer: ‘TA’
374
Text-Based Information Displays
indicates that the bus is on the tapped side, while ‘NT’ identifies the bus as residing on the side without the tap.
You can left- click on this field to immediately reposition the bus to the other end of the line or transformer.
Depress the CTRL key and then left click on this line to display the Transmission Line/Transformer Dialog. Simply
left-click (without holding the CTRL key) to navigate through the system from bus to bus.
375
Quick Power Flow List
The Quick Power Flow List provides a convenient means of viewing a listing of the flows at individual buses in the
system. The format and control of the Quick Power Flow List is generally the same as that of the Power Flow List,
except that the Quick Power Flow List displays results for just the desired bus or range of buses.
You can access this Quick Power Flow List in a number of different ways:
· Select Case Information > Quick Power Flow List
· From most of the Case Information Displays, right-click to invoke the display’s loc al menu, and select Quick Power
Flow List.
· From the Bus Information Dialog click on the View All Flows at Bus button.
· From the oneline diagram, right-click on the bus symbol to display the bus’ local menu, and select Quick Power
Flow List.
· Select the toolbar icon from the Options/Info Toolbar.
This display is automatically created if it is not already shown. Information on subsequent buses appears at the
bottom of the display.
As with the Power Flow List, you can navigate through the system bus-by-bus by double-clicking on the lines that
begin with "TO nnnnn …," where nnnnn is the number of the bus you would like to investigate. Information for that bus
will appear at the bottom of the display.
Like the Power Flow List, the Quick Power Flow List has a local menu that is accessed by right-clicking on the display.
Among the things y ou can do from the local menu is to display the bus, branch, generator, load, or shunt
corresponding to the currently selected record by selecting Display Object Dialog. You can also navigate through
the system bus-by-bus just as you can do through double-clicking by choosing Goto Line Bus from the local menu.
376
Text-Based Information Displays
Making Reports
Choosing Report Writer allows you to create text style reports of all power system information. This includes
information regarding Areas, Zones, Buses, Generators, Loads, Switched Shunts, and Transmission Lines. These
reports may be printed and customized as desired.
When you select Case Information > Report Writer (run mode only), the Reports Criteria Dialog will appear. This
allows you to customize the information contained in the report. By default, the Make Reports activity will create a
comprehensive set of reports for all areas whose Area/Zone/Owner Filter settings allow them to be displayed. To
specify which types of reports will be created and for which buses, use the options provided on the Reports Criteria
Dialog.
· First, select either Area Reporting or Zone Reporting. This will designate whether to organize the report by areas or
by zones.
· Next, select the areas or zones you would like to include in the report. To add or remove an area/zone from the
report, click on its status with the left button to toggle between ‘In Report’ and ‘NOT in Rep’. You may also add or
remove large ranges of area/zone numbers by typing number ranges into the Add or Remove text boxes and
pressing Return.
· Select the voltage levels you would like the reports to cover. The report will include records only for power system
equipment whose nominal voltage falls in this range.
· Choose the Types of Reports you would like to create. To produce the entire set of reports (which is the default
setting), select All. You can select multiple items from this list by using the shift and/or control keys.
· Select either List Reports by Area/Zone or List Reports Together. This will determine the format of the report.
For instance, if you choose to List Reports Together, then all of the bus information will be grouped in one listing;
whereas if you choose List Reports by Area/Zone, then the information will be grouped by Area/Zone.
· Finally, choose, OK, Make Reports .
A new dialog containing the report will appear. The report dialog features both a main menu and a local menu
(accessible by right-clicking on the report) that allow you to change the font of the report, send it to a printer, or copy
portions of the report to the Windows clipboard for use with another application.
377
Outages_Topic
The outages display, available by choosing Case Information > Outages_Topic menu option (run mode only),
presents a tabular listing of devices that are currently out-of-service in the load flow model. The display contains
pages that resemble case information displays for branches, generators, loads, switched shunts, buses, and Multi-
section lines. All devices listed in the pages on this display are the out-of-service elements.
378
Text-Based Information Displays
Area and Zone Displays
Area Display
:
Areas Case Info
Editing Displays
The Area Display houses data about each area in the case. The Area Display is a class of Case Information Display
and therefore can be used in a manner consistent with all other case information displays. It has a local menu from
which you can print, copy, or modify its records as well as view the information dialog of its associated areas. You can
also sort the area records by clicking on the heading of the field by which you want to sort.
To show the area records display, select Case Information > Areas .
By default, the area records display contains the following fields:
Number, Name
Area’s number, between 1 and 9999, and its alphanumeric identifier. Simulator supports names of any character
length. However, when writing out names to file formats with limitations on name length, the area names will be
truncated at their maximum supported length.
AGC Status
Area’s automatic generation control status. This field indicates whether or not the area’s generation is changing
automatically to control the area interchange. See Area Control for more details. You can toggle the value of the
area’s AGC Status (except in Viewer) by left clicking on the entry. Valid entries in this field include:
Off AGC
Area is off AGC. Generation must be adjusted manually to meet changes in
load and losses. If it is not, the system slack will be forced to pick up the
balance.
Part AGC
Area is on AGC, with generation dispatch controlled by its units’ participation
factors.
ED
Area is on economic dispatch control so that generation is dispatched in order
of least cost.
OPF
Area is on OPF control (only used with Simulator OPF ). This option is only
used with Simulator OPF. When the case is solved using the OPF the area
controls are changed by the OPF to maintain area power balance. During non-
OPF solutions this option is equivalent to Off AGC.
Gen MW
Total real power generation in the area in MW.
Load MW
Total real power load in the area in MW.
Tot Sched MW
The net of the base and scheduled transactions between the area and all other areas, w ith exporting power
indicated as a positive value. The base interchange for an area is set on the Area Information Dialog; the
scheduled transactions for an area can be viewed using the specified MW Transactions display. See Area
Transaction Modeling for a description of the difference between base and scheduled transactions.
Int MW
The actual interchange between this area and all other areas, with exporting power positive. If an area is on AGC
control, its actual interchange should match its scheduled interchange.
ACE MW
The area control error in MW. This is the amount of MW flow difference between the actual MW interchange and
the desired MW interchange. A positive value means the super area is generating and exporting excess MW's, and
a negative value means the super area is under-generating and importing too many MW's.
Lambda
The area’s marginal cost. This marginal cost is relevant only when an Economic Dispatch (not OPF) solution has
been run. Theoretically, if losses are ignored, an area operates most economically if all generators operate at the
same incremental cost. This common incremental cost is the area’s lambda, or marginal cost.
The local menu of the area records display has an additional option labeled All Area Gen IC Curves. Select this
activity to generate a plot showing the incremental cost curves for all units located in a particular area.
Loss (MW)
Total real power losses for the area.
Auto Shunts
379
Determines whether switched shunts for the area are available for automatic control. You can use this field to
disable all the switched shunts in an area. Click on this field to toggle its value. Click on the Toggle All Yes or
Toggle All No local menu options to set the auto shunts property for all switched shunts. Note that a switched shunt
is available for automatic control only if it meets three conditions: 1) its control mode property is set to Automatic
(see Switched Shunt Information Dialog); 2) its associated area’s Auto Shunts property is set to Yes ; and 3) the
Disable Switched Shunt Control option on the Power Flow Solution tab of the PowerWorld Simulator Options Dialog
must not be checked.
Auto XF
Determines whether tapped transformers for the area are available for automatic control. You can use this field to
disable all the transformers in an area. Click on this field to toggle its value. Click on the Toggle All Yes or Toggle
All No local menu options to set all entries in this column. Note that three conditions must be met for a transformer
to be used for automatic control: 1) its Auto field must be set to Yes (see Transformer Modeling for details); 2) its
associated area’s Auto XF property is set to Yes; and 3) the Disable Transformer Control option on the Power Flow
Solution tab of the PowerWorld Simulator Options dialog must not be checked.
Load Schedule
Identifies the load variation schedule that governs how load varies in the area. The load variation schedule
specifies values for the load multiplier at specific points in time. To examine the details of a load schedule or to
modify its prescription, select Case Information > Load Variation Schedules from the main menu to bring up the
Load Variation Dialog.
Load Mult
Shows the current load multiplier for the area, as constrained by the prevailing load schedule. All load in the area is
scaled by this multiplier. This value of this field can be modified only through adjusting or redefining the area’s
associated load schedule using the Load Variation Dialog.
380
Text-Based Information Displays
Zone Display
The Zone Display provides information about all the zones in the case. Similar to the Area Display, the Zone Display
provides a means of dividing up a power system. System results can then be summarized by zones using this display.
Buses can be assigned to zones independent of their area assignments. Thus a single area could contain multiple
zones, or a single zone could span multiple areas. The zone number for each bus is shown on the Bus Dialog. In the
Edit Mode, groups of buses can be easily moved from one zone to another using the Zone Dialog.
The Zone Records Display is a class of Case Information Display and therefore can be used in a manner consistent
with all other case information displays. It has a local menu from which you can print, copy, and modify its records as
well as view the information dialog of its associated zones. You can call up the Quick Power Flow List or Bus View
Display to obtain more information about representative bus in the zone. You can also sort the zone records by
clicking on the heading of the field by which you want to sort.
To show this display select Case Information > Zones.
The display contains the following fields by default:
Zone Number, Zone Name
Zone’s number, between 1 and 9999, and its alphanumeric identifier. Simulator supports names of any character
length. However, when writing out names to file formats with limitations on name length, the zone names will be
truncated at their maximum supported length.
Load MW, Load MVR
Total real and reactive power load in the zone.
Gen (MW), Gen (Mvar)
Total real and reactive power generation in the zone.
Loss MW, Loss MVR
Total real and reactive power loss in the zone. Losses are computed by summing the losses of the individual
transmission lines and transformers in the zone. Because of shunt charging, these devices can also generate
reactive power. Therefore, reactive power losses may actually be negative.
Int MW, Int MVR
Net interchange of real and reactive power with all other zones. Exported power is assumed to be positive.
Load Schedule
Identifies the load variation schedule that governs how load varies in the zone. The load variation schedule
specifies values for the load multiplier at specific points in time. To examine the details of a load schedule or to
modify its prescription, select Case Information > Load Variation Schedules from the main menu to bring up the
Load Variation Dialog.
Load Mult MW
Shows the current load multiplier for the zone, as constrained by the prevailing load schedule. All load in the area is
scaled by this multiplier. This value of this field can be modified only through adjusting or redefining the area’s
associated load schedule using the Load Variation Dialog.
381
Super Area Display
The Super Area Display identifies any super areas that have been defined for the case. Super areas are groups of
areas whose generators are dispatched as a coordinated group. Super areas can thus be useful for modeling the
operation of independent system operators or power pools.
Super areas cannot be inserted into a case from the Insert menu. Instead, a super area can be defined when
modifying or creating an area simply by typing the name of a new super area in the Super Area dropdown box on the
Area Information Dialog.
The Super Area Records Display is a class of Case Information Display and therefore can be used in a manner
consistent with all other case information displays. It has a local menu from which you can print, copy, and modify its
records as well as view the information dialog of its associated super areas. You can call up the Quick Power Flow
List or Bus View Display to obtain more information about representative bus in the super area. You can also sort the
super area records by clicking on the heading of the field by which you want to sort.
To show this display select Case Information > Super Areas.
The display contains the following fields by default:
Name
The name of the super area.
AGC Status
The Super Area may operate without automatic generation control (AGC Status = Off AGC), with participation factor
control (AGC Status = Part. AGC), or according to an economic dispatch (AGC Status = ED). This is a toggleable
field.
Use Area PF
Indicates whether to use the areas participation factors when the super area is to operate with participation factor
control (Part. AGC).
Num Areas
Indicates the number of areas defined as being part of the super area. Areas are added to super areas using the
Super Area dropdown box on the Area Information Dialog.
Gen MW
Total MW injection from all the generators in the super area.
Load MW
Total MW load demanded in the super area.
Tot Sched MW
Total scheduled MW interchange with other areas or super areas.
ACE MW
The area control error in MW. This is the amount of MW flow difference between the actual MW interchange and
the desired MW interchange. A positive value means the super area is generating and exporting excess MW's, and
a negative value means the super area is under-generating and importing too many MW's.
Lambda
The super area’s marginal cost.
Loss MW
Indicates the real power losses incurred within the super area.
ED Use PF
Indicates whether the power flow engine will calculate loss penalty factors in computing the economic dispatch
solution for the super area. If loss penalty factors are not calculated, then the economic dispatch is calculated
assuming that the super area is lossless. Otherwise, the economic dispatch solution incorporates losses. The
penalty factors gauge the sensitivity of the area’s losses to changing injection at specific generators. The option to
calculate loss penalty factors is relevant only when the super area operates according to Economic Dispatch
Control . Usually, if the system’s cost curves are relatively flat, the inclusion of losses in the solution will not have
much of an effect on the dispatch.
382
Text-Based Information Displays
Bus Displays
Bus Display
The Bus Display presents data describing each bus in the case. The Bus Display is a class of Case Information
Display and therefore can be used in a manner consistent with all other case information displays. It has a local menu
from which you can print, copy, and modify its records as well as view the information dialog of its associated bus. You
can also sort the bus records by clicking on the heading of the field by which you want to sort. Additionally, you can
choose to restrict the records shown by the Bus Records Display according to the constraints of the area/zone/owner
filters. Finally, when Simulator is in Edit Mode, the local menu allows you to add new buses to or remove existing
buses from the system.
To show the bus records display, select Case Information > Buses.
By default, the bus records display contains the following fields:
Number and Name
Bus number between 1 and 99,999, and its alphanumeric identifier, eight characters maximum.
Area Name
Alphanumeric identifier of the bus’ area.
Nom kV
The nominal base voltage of the bus in kV.
PU Volt
Bus’ per unit voltage magnitude.
Volt (kV)
Bus’ actual voltage magnitude in kV. This is the per unit voltage magnitude multiplied by the bus’ nominal voltage.
Angle (Deg)
Bus’ voltage angle in degrees.
Load MW, Load Mvar
Total real and reactive load at the bus. If no loads are located at the bus, these fields are blank.
Gen MW, Gen Mvar
Total real and reactive generation at the bus. If no generators are located at the bus, these fields are blank.
Switched Shunt Mvar
Total switched shunt device reactive power injection at the bus.
Act G Shunt MW, Act B Shunt Mvar
Total real and reactive fixed bus shunt injections.
Area Num
The area number in which the bus is located.
Zone Num
The zone number in which the bus is located.
383
Remotely Regulated Bus Display
The Remotely Regulated Bus Display provides information about all buses that are remotely regulated by one or more
generators. The bus that a generator regulates is specified in the Edit Mode using the Generator Dialog. Whenever a
generator is regulating a bus that is not its terminal, it is considered to be remotely regulating that bus. The bus that is
remotely regulated, along with the regulating generators, will appear on this display.
The Remotely Regulated Bus Display is a class of Case Information Display and therefore can be used in a manner
consistent with all other case information displays. It has a local menu from which you can print, copy, and modify its
information as well as view the information dialog of its associated buses. You can find a specific remotely regulated
bus, and you can learn more information about a particular remotely regulated bus by choosing either Quick Power
Flow List or Bus View. You can also sort the remotely regulated bus information by clicking on the heading of the field
by which you want to sort. Additionally, you can choose to restrict the information shown by the Load Display
according to the constraints of the area/zone/owner filters.
To call up the Remotely Regulated Bus Display, click Case Information > Other > Remotely Regulated Buses.
This Remotely Regulated Bus Display contains the following fields by default:
Number, Name, Area Name
Number, name, and area name for the bus that is being remotely regulated.
PU Volt
Per unit voltage magnitude for the bus.
Set Volt
Setpoint voltage for the bus. When a bus is being remotely regulated by a set of generators, the generators vary
their reactive power output to maintain the voltage at the bus at the setpoint value. You can enter a new value for
this field. Changing the setpoint voltage here changes the setpoint voltage for all the generators that are remotely
regulating this bus.
Volt Diff
Per unit difference between the actual voltage magnitude and the set point voltage magnitude.
AVR
Combined automatic voltage regulation (AVR) status for all the generators remotely regulating this bus. If AVR is
No, no generators regulate voltage; if AVR is Yes, all the available generators are regulating; if AVR is Mixed, some
generators regulate voltage and some do not. Regulation of individual generators can be specified using the
Generator Display . You can toggle this field between "Yes" and "No" by clicking on it.
Total Mvar
Total of the reactive power being supplied by all the generators remotely regulating the bus.
MVR Min, MVR Max
Total of the minimum and maximum reactive power limits for all the generators remotely regulating the bus.
Gen Buses
The next several fields list the generators that are remotely regulating this bus. Left clicking on either of these fields
allows you to see all the flows into the generator’s bus using the Quick Power Flow List, while right clicking on the
fields displays the Generator Dialog for the generator.
384
Text-Based Information Displays
Bus Mismatches Display
The Bus Mismatches Display lists the real and reactive mismatches at each bus. The bus mismatches are defined as
the difference between the power entering the bus and the power leaving the bus. A power flow case is considered
solved when all the bus mismatches are below the convergence tolerance specified on the Power Flow Solution tab of
the PowerWorld Simulator Options dialog.
Most of the time you will not need to be concerned about the bus mismatches. If the power flow solves, the
mismatches are guaranteed to be below the desired tolerance. However, advanced users will find this display useful
in determining the cause when a power flow diverges.
The Bus Mismatch Display is a class of Case Information Display and therefore can be used in a manner consistent
with all other case information displays. It has a loc al menu from which you can print, copy, and modify its information
as well as view the information dialog of its associated bus. You can find a specific bus mismatch using the name or
number of the bus, and you can learn more about the bus by choosing either Quick Power Flow List or Bus View. You
can also sort the bus mismatch information by clicking on the heading of the field by which you want to sort.
To show this display select Case Information > Mismatches. You can view bus mismatches only when the
application is in Run Mode.
The Bus Mismatch Display contains the following fields by default:
Number, Name, Area Name
The number and name of the bus and the name of the area in which it is located.
MW Mismatch, MVR Mismatch, MVA Mismatch
The real and reactive mismatches at each bus, and the total complex power mismatch.
385
Substation Displays
Substation Records Display
The Substation Records Display presents data describing each substation in the case. The Substation Display is a
class of Case Information Display and therefore can be used in a manner consistent with all other case information
displays. It has a local menu from which you can print, copy, and modify its records as well as view the information
dialog of its associated substation. You can also sort the substation records by clicking on the heading of the field by
which you want to sort. Additionally, you can choose to restrict the records shown by the Substation Records Display
according to the constraints of the area/zone/owner filters. Finally, when Simulator is in Edit Mode, the local menu
allows you to add new substations to or remove existing substations from the system. Note: a substation is
considered in an area/zone if any single bus in the substation is in the area/zone.
To show the substation records display, select Case Information > Substations .
By default, the substation records display contains the following fields:
Sub Num
An integer identifier for the substation.
Sub Name, Sub ID
Two alphanumeric identifiers for the substation.
Area Name, Zone Name
The names of the area and zone of the buses in the substation. If some of the buses in the substation are in
different areas or zones, then this is the most common area or zone.
# of Buses
The number of buses inside the substation.
Gen MW, Gen MVR
Total real and reactive generation at the substation. If no generators are located at the substation, these fields are
left blank.
Load MW, Load MVR
Total real and reactive load at the substation. If no loads are located at the substation, these f ields are left blank.
Shunt MW, Shunt MVR
Total real and reactive shunt values at the substation. If no shunts are located at the substation, these fields are left
blank.
386
Text-Based Information Displays
Generator Displays
Generator Display
The Generator Display presents data describing each generator in the case. The Generator Display is a class of Case
Information Display and therefore can be used in a manner consistent with all other case information displays. It has
a local menu from which you can print, copy, and modify its records as well as view the information dialog of its
associated generators. The Quick Power Flow List and Bus View Display tools are available for finding more
information on the generator’s terminal bus. You can also sort the generator records by clicking on the heading of the
field by which you want to sort. Additionally, you can choose to restrict the records shown by the Generator Records
Display according to the constraints of the area/zone/owner filters. Finally, you can use the local menu’s Insert and
Delete options when the application is in Edit Mode to insert a new generator into the case or to delete an existing
generator.
Some columns which can be added to the generator records are related to the post-contingency solution options. For
more information about these columns see the sections "Define Generator Line Drop and Reactive Current
Compensation" and "Define Generator Maximum MW Responses in Post-Contingency" in the Advanced Modeling
Options for Contingency Analysis.
To show the generator records display, select Case Information > Generators.
By default, the generator records display contains the following fields:
Number, Name
Number and name of the bus to which the generator is attached. The display’s local menu offers you the
opportunity to view the Quick Power Flow List and the Bus View Display for the bus.
ID
Single character ID used to distinguish multiple generators at the same bus. This default value for this field is ‘1’.
Status
Displays the Open / Closed status of the generator. This field is a toggleable field.
Gen MW, Gen Mvar
The real and reactive power output of the generator. If the generator is on AVR control, the reactive power is set
automatically.
Set Volt
Per unit setpoint voltage for the generator. When a generator is on AVR control, the reactive power output of the
generator is varied automatically in order to maintain the regulated bus voltage at this value. The regulated bus is
usually, but not always, the generator’s terminal bus. Use the Generator Dialog to see the regulated bus number.
AGC
Designates whether the generator’s real power output is governed by automatic generation control. If the AGC field
is set to Yes, the generator is on automatic generation control (AGC). When a generator is on AGC, its real power
output can be varied automatically. Usually the purpose for AGC is to keep the area interchange at a desired value.
You can click on this field to toggle its value (except in Viewer). Please see Area Control for more details.
AVR
Designates whether the generator will vary its reactive power output to maintain a constant terminal voltage. If the
AVR property is set to Yes , the generator is on automatic voltage regulation (AVR) control. When a generator is on
AVR control, its reactive pow er output is varied automatically to keep the regulated bus voltage at the Set Volt
value. AVR is limited by the generator’s reactive power limits. You can click on this field to toggle its value (except
in Viewer).
Min MW, Max MW
Minimum and maximum allowable real power output of the generator.
Min Mvar, Max Mvar
Minimum and maximum allowable reactive power output of the generator.
Cost Model
The type of cost model the generator is currently set to use. Cost models are necessary for performing economic
analysis, such as Economic Dispatch or Optimal Power Flow.
Part. Factor
Generator’s participation factor. Participation factors are used to determine how AGC generators participate in area
control when their area is on participation factor control. Please see Area Control for more details.
387
Generator/Load Cost Models
The Generator/Load Cost Models option from the Case Information menu allows you to choose to view detailed
information on generator cost curves or load benefit curves. This cost information can be very important when solving
an Optimal Power Flow or Security Constrained Optimal Power Flow solution.
The Generator/Load Cost Models option has four submenu options to choose from:
Generator Cubic Cost Models
Generator Piecewise Linear Cost Models
All Generator Cost Models
All Load Benefit Models
388
Text-Based Information Displays
Generator Cost Models Display
The Generator Cost Models Display presents detailed cost information for each generator in the case, regardless of
what type of cost curve has been entered for the generator. The Generator Cost Models Display is a class of Case
Information Display and therefore can be used in a manner consistent with all other case information displays. It has
a local menu from which you can print, copy, and modify its records as well as view the information dialog of its
associated generators. The Quick Power Flow List and Bus View Display tools are available for finding more
information on the generator’s terminal bus. You can also sort the generator records by clicking on the heading of the
field by which you want to sort. Additionally, you can choose to restrict the records shown by the Generator Cost
Models Display according to the constraints of the area/zone/owner filters. Finally, you can use the local menu’s Insert
and Delete options when the application is in Edit Mode to insert a new generator into the case or to delete an ex isting
generator.
To show the generator piecewise linear cost display, select Case Information > Generator/Load Cost Models > All
Generator Cost Models .
By default, the generator records display contains the following fields:
Number, Name
Number and name of bus to which the generator is attached.
Area Name of Gen
Name of the area to which the generator belongs. The generator can be assigned to an area different than the area
to which its terminal bus is assigned.
ID
Single character ID used to distinguish multiple generators at the same bus; ‘1’ by default.
Status
The Open / Closed status of the generator. This is a toggleable field.
AGC
Designates whether the generator’s real power output is governed by automatic generation control. If the AGC field
is set to Yes, the generator is on automatic generation control (AGC). When a generator is on AGC, its real power
output can be varied automatically. Usually the purpose for AGC is to keep the area interchange at a desired value.
You can click on this field to toggle its value (except in Viewer). Please see Area Control for more details.
Gen MW
Current real power output of the generator.
Min MW
Minimum MW output of the generator.
Max MW
Maximum MW output of the generator.
Cost Model
The type of model this generator is currently using. Can be Cubic, Piecewise Linear or None.
IOA, IOB, IOC, IOD
Parameters used to model the cost characteristic of the generator. Please see Generator Cost Information for
details. Please note that these values can be saved/loaded using the Generator Cost Data auxiliary file.
These fields will be disabled unless the Cost Model type is set to Cubic.
Fuel Cost
The fuel cost of the type of fuel for the generator.
Variable O&M
Operations and Maintenance costs for the generator.
This field will be disabled unless the Cost Model type is set to Cubic.
Fuel Type
An informational field that can be set to the type of fuel the generator uses.
Unit Type
An informational field that can be set to reflect the type of unit the generator is, such as combined cycle, steam,
hydro, etc.
389